
We use cookies to ensure our website works properly and to personalise your experience. Cookies policy
Ikon Pharmacy College, Bheemanahalli, Bidadi, Bangaluru, Karnataka – 562109
The present study focused on the formulation and evaluation of pantoprazole sodium transdermal patches for the treatment of peptic ulcers. Transdermal drug delivery systems (TDDS) are designed to provide controlled and sustained release of drugs through the skin, ensuring maximum therapeutic benefit while minimizing adverse effects. In this work, novel controlled-release patches were prepared by the solvent evaporation method using HPMC E15 as the film-forming polymer, Eudragit L100 and PVP K30 as stabilizers, and propylene glycol as a plasticizer. The patches were evaluated for FT-IR analysis, thickness, weight variation, moisture content, folding endurance, surface pH, drug content, and in-vitro drug release. Results indicated that pantoprazole sodium was uniformly incorporated into the polymeric matrix across all six formulations. FT-IR spectra confirmed the compatibility of the drug with the selected excipients. Among all formulations, F6 (containing HPMC E15, Eudragit L100, PVP K30, and propylene glycol) exhibited the highest drug release of 79.0%, compared to the others. Overall, the findings suggest that pantoprazole sodium transdermal patches can serve as an effective controlled-release system for the management of peptic ulcers.
Peptic ulcer disease is a problem of the gastrointestinal tract characterized by mucosal damage secondary to pepsin and gastric acid secretion. It usually occurs in the stomach and proximal duodenum, it occurs in the lower esophagus, the distal duodenum or the jejunum as in unopposed hypersecretory states such as Zollinger-Ellison syndrome. The word ‘peptic’ refers to pepsin a stomach enzyme that break down proteins. Peptic ulcer located in stomach is called gastric ulcer.
Peptic ulcers, despite being a common gastrointestinal disorder, have a complex and multifactorial etiology. Understanding the various factors contributing to ulcer formation is crucial for effective management and prevention. The primary causes of peptic ulcers include Helicobacter pylori (H. pylori) infection, the use of nonsteroidal anti-inflammatory dru(NSAIDs) and less commonly stress-related mucosal damage.
NSAIDs: NSAIDs are commonly used for their analgesic, anti-inflammatory, and antipyretic properties. However, their use is associated with an increased risk of peptic ulcer perforation (PPU). Approximately 25% of chronic NSAID users will develop peptic ulcer disease (PUD), and 2%-4% may experience bleeding or perforation.
H. Pylori: Recurrent peptic ulcer disease (PUD) predominantly occurs in patients with H. pylori infection, suggesting that H. pylori play a significant role in the development of PUD and its complications. While proton pump inhibitor therapy significantly reduces the risk of recurrent H. pylori infection, its efficacy in reducing ulcers is modest in NSAID users.
Smoking: Tobacco is thought to inhibit pancreatic bicarbonate secretion, leading to increased acidity duodenum. It also inhibits the healing of duodenal ulcers. However, in some studies, there was no difference in tobacco use between patients with non-H. pylori, non-NSAID duodenal ulcersand those with H. pylori related ulcers, indicating a limited role of smoking. This indicated that smoking did not increase the risk of ulcer recurrence once the H. pylori had been eradicated.
MATERIALS AND METHODS
MATERIALS:
|
Sr. No |
Materials |
Source |
|
1 |
Pantoprazole sodium |
Embiotic labs Pvt. Ltd |
|
2 |
HPMC E15 |
Loba Chem Pvt. Ltd |
|
3 |
Eudragit L100 |
Thermo electron LLS, Mumbai |
|
4 |
PVP K30 |
Loba Chem Pvt. Ltd |
|
5 |
Propylene glycol |
SD fine chem. Ltd |
METHOD OF FORMULATION
SOLVENT EVAPORATION METHOD:
The polymers were accurately weighed and dissolved in 10 ml of ethanol and in the case of Eudragit L100, the chloroform: methanol (1:1) solution was also used and kept aside to form a clear solution. Drug pantoprazole sodium was dissolved in the above solution and mixed until the formation of a clear solution. Then the plasticizer and the permeation enhancers were added to the formulation step by step and mixed uniformly. The resulted uniform solution was cast on the petri dish, which was lubricated with glycerine and dried at room temperature for 24 h. An inverted funnel was placed over the petri dish to prevent fast evaporation of the solvent. After 24 h, the dried patches were taken out and stored in a desiccator for further studies.
Pre-formulation study
Percentage Moisture Content =
Initial weight − Final weight x100
Final weight [35]
Percentage Moisture Content =
Initial weight − Final weight x100
Final weight
Qt = Q? + K? t
Where,
Q? = Initial amount of drug in the solution (most times, Q0 = 0)
Q? = Amount of drug dissolved at time t
K? = Zero order release constant expressed in units of concentration/time.
To study the release kinetics, data obtained from in-vitro drug release studies were plotted accumulative % drug release versus time and R2 was calculated.
Qt = Q? e-kt
Where,
Qt = Amount of drug dissolved in time t
Q? = Initial amount of drug in solution
K = First order release constant (hr-1)
Log C = log C? - Kt/ 2.303
Where,
K = 1st order rate constant expressed in units of time.
C? = initial concentration of drug
When the obtained data is plotted as Log cumulative percentage of drug release versus time, the obtained graph is a straight line; indicating that the release follows first order kinetics. The constant k can be obtained by multiplying 2.303 with the slope value.
This model is based on the hypotheses that.
Qt = KH t1/2
Where,
Qt = Amount of drug released in time t KH = Higuchi dissolution constant.
The data obtained were plotted as cumulative % drug release versus square root of time.
Kors Meyer et al. developed a simple, semi empirical model which relates exponentially, the drug release to the elapsed time in order to understand the mode of release of drug from swellable matrices. The equation that describes Peppas model is:
M? / M = Ktn
Where,
K = constant incorporating structural and geometrical characteristics of the drug from dosage form
n = Release exponent, indicative of the drug release mechanism.
The function of t is M?/ M?= Fraction of drug release at time t.
Equation can be simplified as:
Log M? / M?= Log K + n log t
When the obtained data is plotted as log of drug released versus log time, the graph obtained is a straight line with a slope equal to n and K can be obtained from the intercept.
This model is used to analyze the release from polymeric dosage forms, when the release mechanism is not well known or when there is a possibility of more than one type of release phenomenon being involved.
To study release kinetics, data obtained from in-vitro drug release studies were plotted as log cumulative % drug release versus log time.
FORMULATION TABLE:
Table: Various formulation of pantoprazole sodium transdermal patch.
|
Ingredients |
F1 |
F2 |
F3 |
F4 |
F5 |
F6 |
|
Pantoprazole sodium (mg) |
635 |
635 |
635 |
635 |
635 |
635 |
|
HPMC (mg) |
200 |
300 |
400 |
300 |
200 |
400 |
|
PVP (mg) |
400 |
300 |
200 |
- |
- |
- |
|
Eudragit (mg) |
- |
- |
- |
300 |
400 |
200 |
|
Ethanol (ml) |
10 |
10 |
10 |
10 |
10 |
10 |
|
Chloroform: methanol (ml) |
- |
- |
- |
6 |
6 |
6 |
|
Propylene glycol (ml) |
0.5 |
0.5 |
0.5 |
0.5 |
0.5 |
0.5 |
RESULTS ANDDISCUSSION
PREFORMULATION STUDIES:
API characterization:
Table: Organoleptic properties of Pantoprazole sodium.
|
Property |
Specifications |
Observations |
|
Colour |
Pale yellow |
Pale yellow |
|
Odour |
Odourless |
Odourless |
|
Taste |
Bitter |
Bitter |
This study is important as organoleptic property determination is a preliminary test for each and every drug. Pantoprazole sodium as white to off white.
Solubility studies were carried out in different solvents as I.P and observations were showed.
Table: Solubility studies of Pantoprazole sodium.
|
Solvents |
Inference |
|
Water |
Freely soluble |
|
Ethanol |
Slightly soluble |
|
Methanol |
Soluble |
Solubility analysis is important because the drug has to dissolve in the solvents and also in the dissolution medium used. Pantoprazole sodium was found to be freely soluble in water, slightly soluble in ethanol and soluble in methanol.
Melting points were carried out and observations were shown in table.
Table: Melting point of Pantoprazole sodium.
|
Trials |
Observed melting point |
|
1 |
160o C |
|
2 |
159o C |
|
3 |
161o C |
|
Average melting point |
160o C |
This study is very much important as melting point is characteristic property of each drug and also helps in determining the purity of the drug. The melting point of pantoprazole sodium was found to be 160°C.
The pH solubility profile of a pantoprazole sodium drug was found to be within range of 7.4
Table: Standard calibration curve of Pantoprazole sodium with water
|
Sr. No. |
Concentration (μg/ml) |
Absorbance at 288nm |
|
1. |
0 |
0 |
|
2. |
2 |
0.128 |
|
3. |
4 |
0.254 |
|
4. |
6 |
0.382 |
|
5. |
8 |
0.512 |
|
6. |
10 |
0.638 |
|
7. |
12 |
0.770 |
DRUG EXCEPIENT COMPATIBILITY STUDY
The compatibility study between drug and the carriers was carried out using FTIR spectrometer. The peak numbers of the drug exhibiting OH, C-C, S=O, C=O, C-C, C=C, COO, C-O-C, CH2, CN, C-H, stretching was observed and are depicted as below
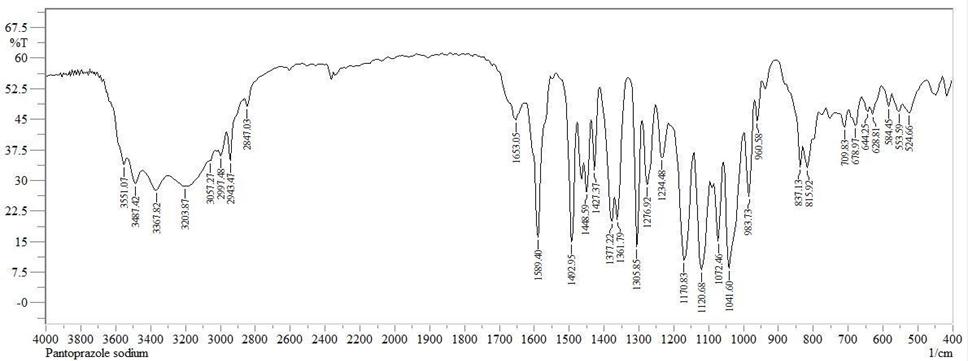
Fig: FT-IR Spectrum of Pantoprazole sodium
Table: Interpretation of FT-IR spectral data of Pantoprazole Sodium
|
Functional Group |
Frequency (cm-1) |
|
OH (Stretching) |
3551.07 |
|
C-H (Stretching) |
3057.27 |
|
C=C (Stretching) |
1589.40 |
|
S=O (Stretching) |
1305.85 |
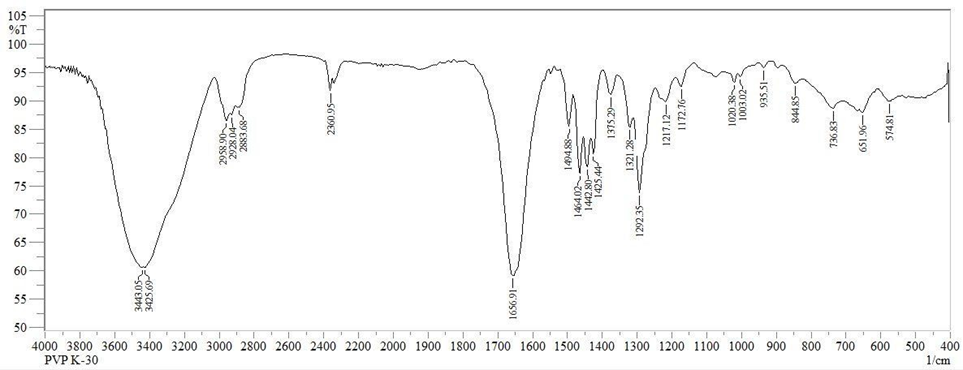
Fig: FT-IR spectrum of PVP K30
Table: Interpretation of FT-IR spectral data of PVP K30
|
FUNCTIONAL GROUP |
FREQUENCY (cm-1) |
|
OH |
3425.69 |
|
C-H |
2958.90 |
|
C=O |
1656.91 |
|
C-N |
1172.76 |
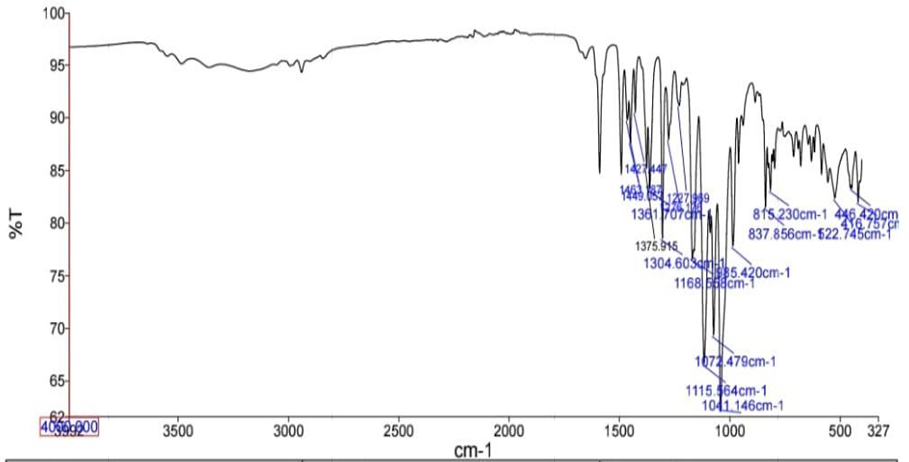
Fig: FT-IR spectrum of Drug and polymer
Table: Interpretation of FT-IR spectral data of Drug and polymer
|
FUNCTIONAL GROUP |
FREQUENCY (cm-1) |
|
C-O |
1304.60 |
|
C-O-C |
1168.55 |
|
S=O |
1072.47 |
|
C-Cl |
522.74 |
EVALUATION OF TRANSDERMAL PATCH
|
FORMULATION CODE |
THICKNESS (mm) |
FOLDING ENDURANCE |
WEIGHT UNIFORMITY (gm) |
|
F1 |
0.345±0.011 |
203±5 |
0.417±0.56 |
|
F2 |
0.380±0.012 |
208±1 |
0.256±0.53 |
|
F3 |
0.328±0.008 |
220±7 |
0.366±0.49 |
|
F4 |
0.425±0.012 |
278±5 |
0.376±0.58 |
|
F5 |
0.458±0.009 |
290±3 |
0.288±0.55 |
|
F6 |
0.412±0.010 |
263±8 |
0.423±0.5 |
|
FORMULATION CODE |
DRUG CONTENT UNIFORMITY (%) |
MOISTURE CONTENT (%) |
|
F1 |
89.2 |
7.18 |
|
F2 |
92.4 |
5.01 |
|
F3 |
99.1 |
7.42 |
|
F4 |
95.7 |
9.38 |
|
F5 |
98.4 |
12.11 |
|
F6 |
87.3 |
16.23 |
|
FORMULATION CODE |
MOISTURE UPTAKE (%) |
FLATNESS |
|
F1 |
6.81% |
98±0.3 |
|
F2 |
6.23% |
97±0.5 |
|
F3 |
3.68% |
97±0.8 |
|
F4 |
4.77% |
98±0.1 |
|
F5 |
3.66% |
96±1.2 |
|
F6 |
2.46% |
99±0.5 |
Table: In-vitro Dissolution studies of formulation F1-F6
|
Time (hrs) |
F1 |
F2 |
F3 |
F4 |
F5 |
F6 |
|
0 |
0 |
0 |
0 |
0 |
0 |
0 |
|
2 |
22.8 |
20.4 |
19.3 |
21.9 |
20.3 |
16.6 |
|
4 |
49.3 |
39.7 |
36.7 |
46.8 |
38.6 |
29.8 |
|
6 |
68.2 |
58.9 |
49.8 |
59.2 |
55.2 |
47.7 |
|
8 |
79.0 |
67.6 |
62.3 |
68.4 |
64.7 |
56.4 |
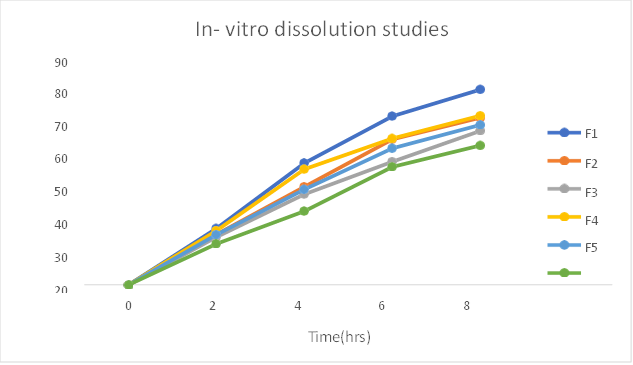
Fig: In-vitro dissolution studies of formulation F1-F6
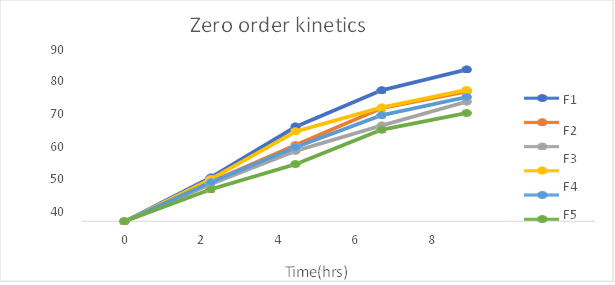
Fig: Zero order release kinetics of formulation F1-F6
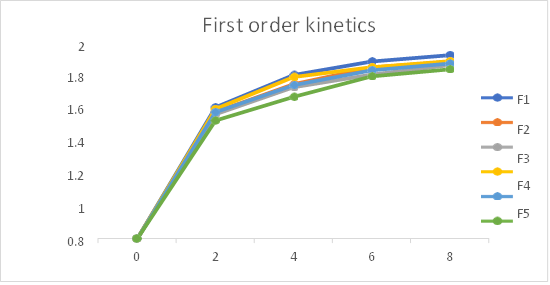
Fig 24: First order release kinetics of formulation F1-F6
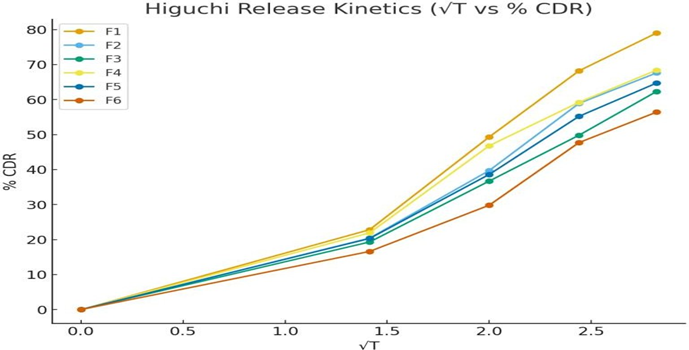
Fig 25: Higuchi release kinetics of formulation F1-F6
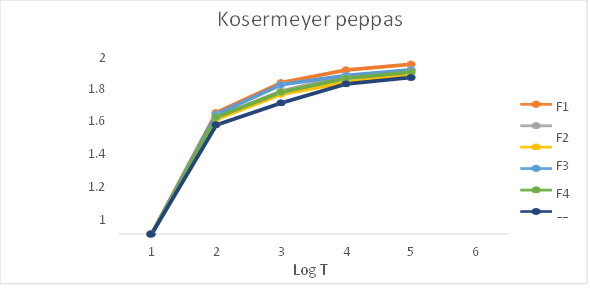
Fig 26: Kosermeyer Peppas release kinetics (Log T vs Log %CDR)
Table: In-vitro drug release kinetics studies of Pantoprazole sodium transdermal patch
|
Formulation |
Zero order |
First order |
Higuchi |
Kosermeyer- Peppas |
Best fit model |
|
|
r2 |
r2 |
r2 |
r2 |
n |
||
|
F1 |
0.966 |
0.963 |
0.985 |
0.997 |
0.44 |
Kosermeyer peppas Fickian diffusion |
|
F2 |
0.978 |
0.985 |
0.965 |
0.992 |
0.50 |
Kosermeyer peppas Fickian diffusion |
|
F3 |
0.986 |
0.998 |
0.965 |
0.998 |
0.48 |
First order Fickian diffusion |
|
F4 |
0.963 |
0.980 |
0.986 |
0.983 |
0.39 |
Higuchi Fickian diffusion |
|
F5 |
0.974 |
0.999 |
0.973 |
0.997 |
0.47 |
First order Fickian diffusion |
|
F6 |
0.988 |
0.991 |
0.937 |
0.992 |
0.50 |
Kosermeyer peppas Fickian diffusion |
The In- vitro dissolution studies was carried out for 8 hrs. The regression co-efficient for F1, F2, F6 formulations follows Kosermeyer peppas kinetic type of drug release, F4 formulations follow the Higuchi kinetic type of drug release, F3 and F5 follows first order kinetic type of drug release. The ‘n’ value obtained from peppas equation were less than 0.5. which indicated that all formulations showed drug release by fickian diffusion mechanism.
CONCLUSION:
The present study has been a successful attempt to formulate transdermal patches of Pantoprazole sodium, an anti-ulcer drug to treat peptic ulcer with a view to improve its bioavailability, avoid first pass metabolism and provide sustained release of the drug. Transdermal patches of Pantoprazole sodium were formulated by solvent evaporation method. Formulations were evaluated for various physicochemical parameters like pH, drug content uniformity, folding endurance, flatness and in-vitro drug release study. F1 was selected as the best formulation because of its good in-vitro drug release. Drug release of F1 formulation was found to be 79.0%. Various properties of the formulation were found to be depend on the concentration of the polymer used in the formulations. The developed formulations met all prerequisites to give sustained and controlled release. Hence, it can be concluded that transdermal patch of Pantoprazole sodium can be an effective formulation that shows improved efficacy, prolonged release, patient compliance and cost effective over conventional formulation.
ACKNOWLEDGEMENTS
The authors thank the management of Ikon Pharmacy College, for their continuous support and encouragement. Thanks are also due to department of pharmaceutical sciences for instrumentation facilities provided towards carrying out the work.
CONFLICT OF INTEREST
There is no conflict of interest.
REFERENCE


Pooja HV, Arpitha BM, Manyashree S, Mohith H, Pooja V, Chandana KP, A Research on Formulation and Evaluation of Transdermal Patches for Peptic Ulcer, Int. J. of Pharm. Sci., 2025, Vol 3, Issue 11, 3309-3319. https://doi.org/10.5281/zenodo.17731351
 10.5281/zenodo.17731351