
We use cookies to ensure our website works properly and to personalise your experience. Cookies policy
V.S.S.D College, Kanpur, Uttar Pradesh
In this study, we present a comprehensive comparative analysis of basil essential oils using Fourier-transform infrared (FT-IR) spectroscopy. Basil essential oil is renowned for its diverse biological activities and wide applications in the pharmaceutical, cosmetic, and culinary industries. FT-IR spectroscopy offers a rapid, non-destructive, and cost-effective method for assessing the chemical composition of essential oils. In this research, we collected basil essential oil samples from the local market in Kanpur other samples were prepared by steam distillation using the Clevenger apparatus in the laboratory. Our findings reveal distinct spectral fingerprints corresponding to various functional groups present in basil essential oils, allowing for differentiation between samples based on their chemical compositions.
The essential oil upward trend in the past several years. Essential oils aren’t a new invention. Essential oils have been mentioned in many ancient Indian texts. Evidence of essential oils is present in the Vedas [1]. The genus Ocimum contains more than one hundred species and is considered one of the greatest genera of the Lamiaceae family. Ocimum basilicum L. (basil) is the major essential oil crop that is produced commercially in most regions of the world. Basil, also called sweet basil, is likely native to India and is widely grown as a kitchen herb. Basil Essential oil [2] is a mixture of aromatic, volatile organic, and natural compounds produced by basil plants. Basil [4] essential oil, derived from the leaves and stems of the basil plant (Ocimum basilicum), is highly valued for health advantages and diverse applications across various industries. The leaves, seeds, and roots of this plant have been used in indigenous Ayurvedic medicine. Tulsi has two varieties – Black (Krishna Tulsi) and Green (Ram Tulsi). They have similar chemical and medicinal properties. Genus Ocimum has various species like Ocimum sanctum L (Tulsi), O. gratissimum (Ram Tulsi), O. canum (Dulal Tulsi), O. basilica (Ban Tulsi), O. kilimandschricum, O. americanum, O. camphor, and O. micranthum. They are cultivated in different parts of the world and are widely known for their medicinal properties [5].
The aroma of essential oil of basil [6] is fresh, sweet, and herbaceous, with varying nuances depending on the species and chemotype. It contains numerous bioactive compounds, including monoterpenes (such as linalool and methyl chavicol), sesquiterpenes, phenols, and flavonoids, which play a role in its therapeutic efficiency.[7]. There are many benefits to basil oil, including its antibacterial, anti-inflammatory, antioxidant, and analgesic properties. Basil oil is an effective ingredient in aromatherapy and natural health products. Herbal medicine uses basil essential oil for its therapeutic and medicinal properties [8]. It is included in various pharmaceutical [9] preparations, herbal remedies, and natural healthcare products for its antimicrobial, anti-inflammatory, and digestive properties. Basil oil is studied for its potential pharmacological applications in the treatment of respiratory conditions, gastrointestinal disorders, and skin ailments. There are many applications for basil essential oil in the food and beverage industry [10], adding a distinctive flavor to a wide range of dishes. Basil essential oil [11] is valued in the personal care and cosmetics industry for its aromatic profile and skincare benefits. Due to its antiseptic, astringent, and cleansing properties, it is often used in skincare formulations such as lotions, creams, soaps, and facial masks. Basil essential oil is [12, 13, 14] a popular choice in aromatherapy for its mood-enhancing, stress-relieving, and invigorating effects on the mind and body. The aromatherapy benefits of basil oil vapor include alleviating mental fatigue, improving mental clarity, and uplifting the mood. In addition to its versatility and multi-functionality, basil essential oil [15,16] has been widely utilized in the food, beverage, personal care, cosmetics, aromatherapy, and pharmaceutical industries [17, 18].
The comparative study of FT-IR (Fourier Transform Infrared) spectroscopy [19] for the recognition of various functional groups presentin Ocimum basilicum L. Infrared spectroscopy characterization of Basil oil communicates the existence of various functional groups with intensity peak of phenol groups, O-H stretching, or hydrogen bonding, C-H stretching bonding which is associated with alkynes and alkanes, C-X bonding which is for alkyl halide groups, C=O stretching frequency which describe the ketone, aldehyde, esters and amides. These functional groups of bioactive compounds contain linalool, camphor, methyl chavicol, eugenol, and 1,8-cineole. FTIR (Fourier-transform infrared) spectroscopy [20] is a technique used to analyze the chemical composition and functional groups in basil essential oil samples from different sources or under various conditions.
Basil oil was obtained by the hydro distillation method in the Clevenger apparatus, and a sample was collected from a local market.
2.1 Sample Selection
The main purpose of this analysis was to differentiate the various functional groups present in the Basil oil that was purchased from the local market and compare it with standard FTIR spectra of Basil oil extracted in the laboratory. The sample was purchased from Kumar Sales Corporation, Nayaganj, which is a local market of Kanpur, and the essential oil was extracted in the laboratory. The leaves were collected from the FFDC extension unit in Kanpur for the extraction of oil.
2.2 Method of Extraction-
Hydro-distillation method. Firstly, freshly collected leaves were cleaned under tap water to avoid dust particles and dried at room temperature. Plant material was placed in a 2-liter round bottom flask with distilled deionized water, and the essential oil was extracted by water distillation using a Clevenger apparatus. The distillation period was three hours, and after that oil was collected from the collector in a bottle for further analysis. Two samples local market Basil essential oil [MBEO]) and laboratory-prepared Basil essential oil [PBEO] was studied here.
2.3 Fourier Transform Infrared (FTIR)
The Fourier Transform Infrared (FTIR) was carried out using a device of type ATR-FTIR mode using the BRUKER ALPHA ll spectrometer with OPUS software, and spectra were solved and plotted through Origin 2022b in the range of wavelength of 500 to 4000 cm-1
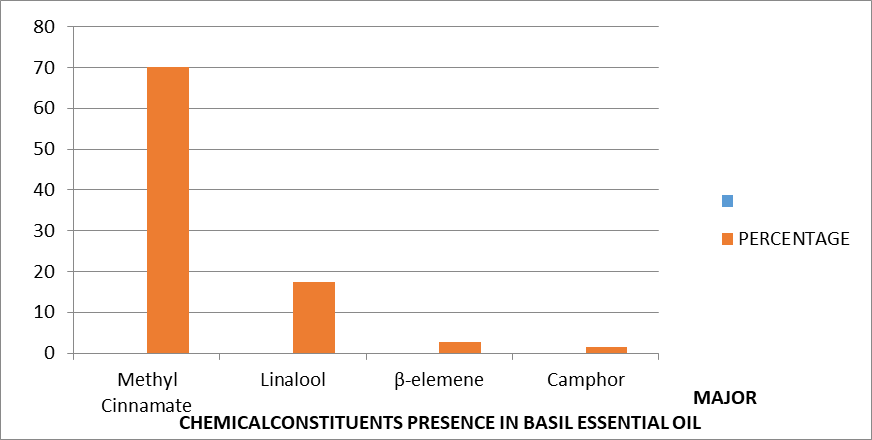
Fig. 1 Chemical constituents’ percentage presence in Basil Essential Oil (Poonkodi Kathirvel & Subban Ravi)
Table no-1 FTIR Peak in Basil Essential Oil samples
|
Group |
Peaks |
Samples-1 (MBEO) |
Sample-2(PBEO) |
|
O-H stretching |
3200-3550cm-1 |
3500 |
3550 |
|
C-H stretching |
2800-2960cm-1 |
2900 |
2900 |
|
C=O stretching |
1730-1750 cm-1 |
1710 |
1700 |
|
C=O stretching (aromatic) |
1450-1600 cm-1 |
1460 |
1450 |
|
C=C stretching (alkene) |
1620-1680cm-1 |
1620 |
1620 |
|
C-H bending (alkanes) |
1375-1450cm-1 |
1350 |
1350 |
|
C-O stretching |
1000-1300cm-1 |
1200 |
1300 |
|
C-H stretching (aromatic) |
3000-3100cm-1 |
3050 |
3060 |
Fourier transform infrared spectroscopy is the most common technique for the identification of different types of functional groups present in compounds. The FT-IR spectrum of essential oil samples was collected from the local market of Kanpur, and another sample of oil was extracted in the laboratory, and is given in Figures 1(local market Basil essential oil [MBEO]) and Figure 2 (laboratory-prepared Basil essential oil [PBEO]), respectively. The comparison of FT-IR spectrum data of the peak and the most feasible functional group appears in the oil sample, which was collected from the market, and another one extracted in the laboratory, shown in Fig. 1 & Fig. 2
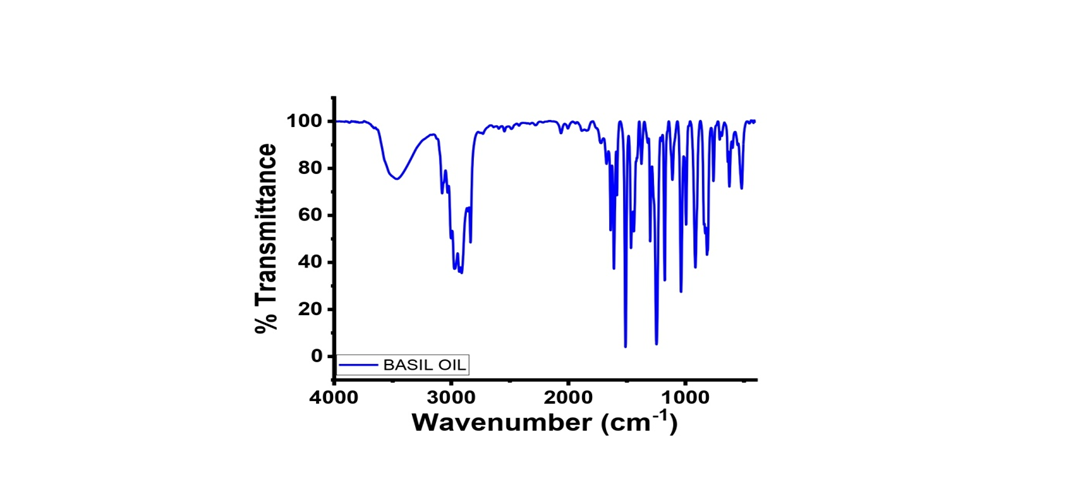
Fig. No. 2 FTIR spectroscopy of local market Basil essential oil (MBEO)
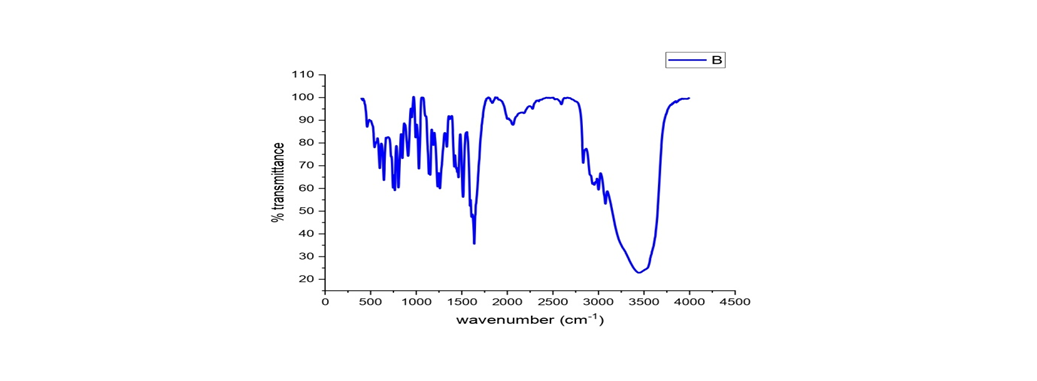
Fig. No. 3 FTIR spectroscopy of laboratory-prepared Basil essential oil (PBEO)
Analysis of FTIR Peaks in Basil Oil from Different Sources. The Fourier Transform Infrared Spectroscopy (FTIR) analysis of basil oil samples, specifically Sample 1 (market) and Sample 2 (extracted in the lab), reveals distinct differences in peak locations, intensities, and the functional groups present. This analysis focuses on the general peak locations corresponding to various functional groups identified in both samples.
3.1 Broad Peak Near 3500 cm?¹
The O-H stretching peak appears as a broad band in both samples, indicative of hydroxyl groups, which may arise from water content or phenolic compounds. In Figure 1 (MBEO), the O-H stretching is characterized by a long and broad peak, suggesting higher water content or a greater concentration of phenolic compounds. Conversely, Figure 2 (PBEO) exhibits a significantly smaller O-H stretching peak, indicating a lower concentration of these hydroxyl groups than the market sample.
3.2 Peak Near 2900 cm?¹
A sharp peak near 2900 cm?¹ signifies C-H stretching associated with aliphatic C-H bonds in saturated hydrocarbons and fatty acids. This suggests that basil oil contains various fatty compounds. Notably, the intensity of this peak is greater in Figure 2 (PBEO) than in Figure 1 (MBEO), implying a higher concentration of aliphatic compounds in the extracted sample. Additionally, an aromatic C-H stretching peak is observed at approximately 3050 cm?¹, which is smaller than the aliphatic C-H peak.
3.3 Peak Around 1700 cm?¹
A distinct peak around 1700 cm?¹ corresponds to C=O stretching related to carbonyl groups, indicating the presence of compounds such as aldehydes, ketones, or esters. Both samples show peaks in this region; however, Figure 1 (MBEO) displays a broad peak, suggesting a wider range of carbonyl-containing compounds. In contrast, Figure 2 (PBEO) has a shorter peak, which may imply a more specific presence of carbonyl groups or a lower concentration of these compounds.
3.4 Strong Peaks Between 1600 and 1400 cm?¹
The peaks within this region are associated with C=C stretching from aromatic rings or alkenes, likely due to the presence of eugenol or other phenolic compounds responsible for the characteristic fragrance of basil oil. The C-H bending peaks are linked to alkanes, where Figure 1 (MBEO) shows smaller peaks, while Figure 2 (PBEO) exhibits a larger and sharper peak. Additionally, both samples display a peak around 1350 cm?¹.
3.5 Peaks Near 1300–1000 cm?¹
Peaks in this range indicate C-O stretching, potentially signaling the presence of ethers, alcohols, or esters. Compounds such as linalool or estragole may contribute to these absorption bands. Figure 1 (MBEO) shows a smaller peak at approximately 1200 cm?¹, whereas Figure 2 (PBEO) has a more pronounced peak at around 1300 cm?¹, characterized by its long and sharp nature.
The FTIR analysis of basil oil samples reveal significant differences in the functional groups and their corresponding peak intensities between the market sample and the lab-extracted sample. Figure 1 (MBEO) displays broader peaks with higher intensities, indicating the presence of a more diverse range of compounds, while Figure 2 (PBEO) shows sharper peaks with higher concentrations of specific aliphatic and carbonyl groups. These variations highlight the impact of extraction methods, sample sourcing, and potentially the age of the samples on the chemical composition of basil oil.
CONCLUSION
The results obtained by the current study could be interpreted that the various functional groups present, they are showing the presence of the O-H group, alkyl halide, esters, and amide. These functional groups confirmed the presence of constituent linalool, camphor, methyl chavicol, eugenol, and 1,8-cineole, etc. The O-H group can make a hydrogen bond that shows inhibitory activity against microorganisms.
ACKNOWLEDGMENTS
The author is thankful to the CSIR for the financial support to carry out this experiment and to IIT Kanpur for providing the necessary facilities to finish this work successfully. I would like to express my thanks to Dr. Bhakti Shukla (F.F.D.C. Kanpur) and Prof. Arvind Kumar Dixit, Ex-head of the Chemistry Department, V.S.S.D. College Kanpur for their constant support and guidance.
REFERENCES

Ankit Kanaujia, Neelam Pal, Nand Lal, Anuradha Tiwari, Comparative Study of FTIR Spectroscopy of Basil Essential Oil in Kanpur, Int. J. of Pharm. Sci., 2025, Vol 3, Issue 12, 3110-3116. https://doi.org/10.5281/zenodo.18000753
 10.5281/zenodo.18000753