Department of Pharmacy, Mahatma Jyotiba Phule Rohilkhand University, Bareilly, Uttar Pradesh, India-243006.
Folic Acid is the water-soluble vitamin (vitamin B9) and lysine hydrochloride is Amino acid Supplement. Folic Acid and Lysine Hydrochloride used as Growth and Development of Children, folate deficiency, amino acid deficiency. Development and validation of simple, Precise and Accurate RP-HPLC method for simultaneous estimation of Folic Acid and Lysine in synthetic mixture. The validation of this method was achieved as per ICH Q2 (R2) guidelines with the optimized experimental conditions. To achieve the proposed method on C18 column (250 mm x 4.6 mm, 5 µm) column as Stationary Phase and run time was 30 min. The Mobile Phase consists of Methanol, Acetonitrile: Phosphate buffer (50:20:30). UV detection was carried out at 300nm. Linearity co-relation co-efficient found is Folic acid is 0.9993 and lysine hydrochloride is 0.9999. The method was validated by determining its accuracy, linearity and precision. The proposed method is simple, precise, economical and hence can be applied for routine quality control of Folic Acid and Lysine Hydrochloride in synthetic mixture.
The chemical name of Dapagliflozin Folic Acid isN-(4-((2-amino-4-oxo-1,4-dihydropteridin-6-yl) methylamino) benzoyl)-L-glutamic acid and Lysine Hydrochloride chemical name is(S)-2,6-diaminohexanoic acid monohydrochloride. Folic acid (Vitamin B9) and lysine hydrochloride are commonly combined in oral liquid formulations used as nutritional supplements. While folic acid plays a key role in DNA synthesis, cell division, and hematopoiesis, lysine hydrochloride, an essential amino acid, supports protein synthesis, immune function, and overall growth. Given their widespread use, especially in pediatric and nutritional applications, it is essential to establish a robust method for their simultaneous estimation in combined formulations. Simultaneous estimation of compounds with distinct physicochemical properties, such as folic acid (a vitamin) and lysine hydrochloride (an amino acid salt), poses unique analytical challenges. These include differences in polarity, solubility, and UV absorbance, which require careful selection of chromatographic conditions to achieve proper resolution and detection. Reversed-phase high-performance liquid chromatography (RP-HPLC) is a preferred analytical technique due to its high sensitivity, specificity, and suitability for a wide range of pharmaceutical compounds. This study focuses on the development and validation of a simple, reliable, and reproducible RP-HPLC method for the simultaneous estimation of folic acid and lysine hydrochloride in their combined oral liquid formulation. The method was optimized for key parameters such as mobile phase composition, pH, flow rate, detection wavelength, and retention time to ensure adequate separation and quantification of both analytes. Validation of the developed method was performed in accordance with ICH Q2(R1) guidelines, evaluating parameters such as linearity, accuracy, precision, specificity, and robustness.
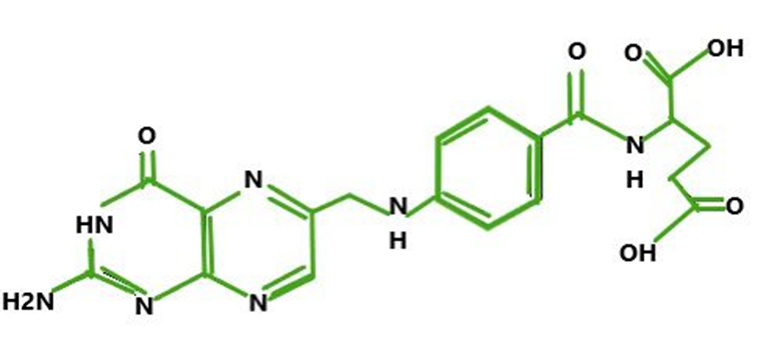
Folic Acid

Lysine Hydrochloride
MATERIALS AND METHOD:
Materials
Table 1.0 Materials & Sources
|
Sr. No. |
Name of APIs |
Source |
|
1 |
Folic Acid |
Orion Life Science |
|
2 |
Lysine Hydrochloride |
Mcdil Laboratories |
Instrumentation
Chemicals and Reagents: Folic Acid API, Lysine Hydrochloride API, Acetonitrile HPLC Grade, Methanol HPLC Grade, Phosphate Buffer HPLC Grade and HPLC Grade water.
Preparation of Phosphate Buffer 0.05M: Weight accurately 9.8g of Potassium Dihydrogen Phosphate, Transfer in 1000mL of volumetric flask add 700mL of distilled water sonicate properly and markup to volume.
Preparation of Mobile Phase: The mobile phase was prepared by adding the ratio of (50:20:30 v/v/v) Methanol: Acetonitrile: Buffer 0.05M (Potassium Dihydrogen Phosphate) and then filtered through 0.45 μm membrane filter; sonicated for 15 min.
Preparation of Standard Stock Solution
Standard Stock Solution for Folic acid Propionate: Accurately weighed quantity of Folic acid Propionate 10 mg was transferred into 100 mL volumetric flask, dissolved in methanol and diluted up to mark with methanol. This will give a stock solution having strength of 100 μg/mL. Withdraw 1 ml from Stock Solution and make up to 0.1 ml with to get 1 μg/mL.
Standard Stock Solution for Lysine Hydrochloride: Accurately weighed quantity of Lysine Hydrochloride 10 mg was transferred into 100 mL volumetric flask, dissolved in methanol and diluted up to mark with methanol. This will give a stock solution having strength of 100 μg/mL. Withdraw 7 ml from Stock Solution and make up to 10 ml with to get 70 μg/mL
Chromatographic Conditions:
Table 2.0 Chromatographic Conditions
|
Column |
C-18 (id 4.6 x 250 mm, 5 µm) |
|
Mobile Phase |
Methanol: Acetonitrile: Phosphate buffer (50:20:30 v/v/v) |
|
Detection |
300nm |
|
Flow rate |
1.5 mL/minute |
|
Run Time |
10 minutes |
|
Detector |
UV detector |
|
Injection volume |
10 μl |
|
Column oven temperature |
40°C |
|
Mode: |
ISOCRATIC |
Identification And Characterization
The identification of taken standard API for experimental work had done for confirmation of its identity, standard quality and purity. The identification had done by taking IR and UV spectra, solubility study and melting point determination.
Solubility Study:
The solubility of Folic Acid & Lysine Hydrochloride practically determined separately by taking 100 mg of both the drugs in 100 ml volumetric flasks, adding required quantity of solvent at room temperature and shaken for few minutes. Solubility data for each study was observed and recorded in Table 4.0.
Table 3.0 Solubility Table
|
Description Terms |
Relative Quantities of solvent for 1 Parts of solute |
|
Very soluble |
Less than 1 part |
|
Freely soluble |
From 1 to 10 parts |
|
Soluble |
From 10 to 30 parts |
|
Sparingly soluble |
From 30 to 100 parts |
|
Slightly soluble |
From 300 to 1000 parts |
|
Very slightly soluble |
From 1000 to 10000 parts |
|
Practically Insoluble |
More than 10000 parts |
Table 4.0 Solubility Data for Dapagliflozin & Bisoprolol
|
Solvent |
Folic Acid |
Bisoprolol |
|
Water |
Very Slightly soluble |
Very soluble |
|
Chloroform |
Soluble |
Non-Soluble |
|
0.1 N HCL |
Soluble |
Highly Soluble |
|
Acetonitrile |
Very Soluble |
Low Soluble |
|
Methanol |
Very Soluble |
Slightly Soluble |
|
Ethanol |
Very Soluble |
Less Soluble |
Identification by Melting Point Determination:
Melting point of Dapagliflozin & Bisoprolol hydrochloride has been determined. The melting points of the compounds were taken by open capillary method.
Table 5.0 Melting Point of Drugs
|
Sr. No. |
APIs |
Melting Point |
|
|
Reported |
Measured |
||
|
1 |
Folic Acid |
250-260°C |
240-260 °C |
|
2 |
Lysine Hydrochloride |
260-265°C |
263-264°C |
IR Spectra:
The IR Spectra of Lysine Hydrochloride with its functional group identification, were shown in the following graph. IR Spectra scanning of sample: Lysine Hydrochloride.
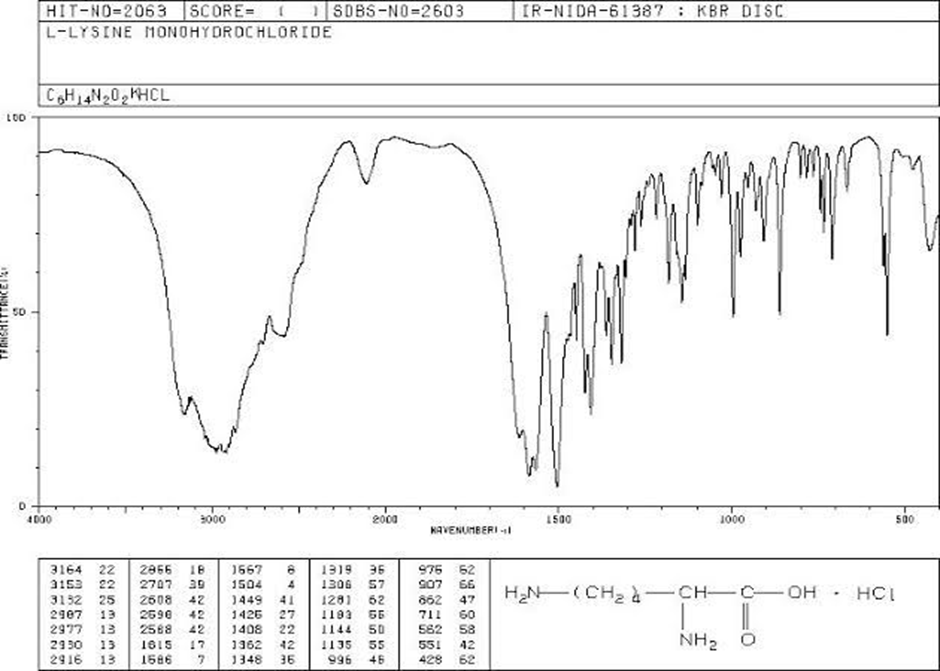
Fig 1.0 IR Spectra of Standard Lysine Hydrochloride
Table 6.0 IR Spectra Interpretation for Lysine Hydrochloride
|
Groups |
General Range(cm-1) |
Observed Range(cm-1) |
|
N-H (s) |
3400-3100 |
3164 |
|
C-H (s) |
3000-2800 |
2866 |
|
COO- (a) |
1650-1600 |
1667 |
|
NH3+ (b) |
1580-1510 |
1581 |
|
C-N (s) |
1200-1000 |
1667 |
|
NH3+ (r) |
800-600 |
711 |
The IR Spectra of Folic Acid with its functional group identification, were shown in the following graph. IR Spectra scanning of sample: Folic Acid.

Fig 2.0 IR Spectra of Standard Bisoprolol
Table 7.0 IR Spectra Interpretation for Folic Acid
|
Groups |
General Range(cm-1) |
Observed Range(cm-1) |
|
N-H (s) |
3400-3200 |
3376 |
|
C-H (s) |
3100-3000 |
2925 |
|
C=O (s) |
1700-1650 |
1659 |
|
C=C(s) |
1650-1550 |
1575 |
|
C-O(s) |
1100-1000 |
1050 |
Method Development
Selection of Wavelength:
To determine wavelength for measurement, standard spectra of Folic acid & Lysine Hydrochloride were scanned between 200-400 nm against diluents. Absorbance maxima of Folic acid & Lysine Hydrochloride have detected at 300. Chromatogram was taken at 300 nm, both drugs give good peak height and shape. So, 300 nm was selected for Simultaneous estimation of Folic acid & Lysine Hydrochloride in their formulation.

Fig 3.0 Overlay UV Spectra of Lysine Hydrochloride and Folic Acid
Selection Of Column:
For RP-HPLC Method, various columns are available but based on literature survey C-18 (id 4.6 x 250 mm, 5 µm) was selected over the other columns.
Selection of Mobile phase:
Table 8.0 Trial 1: Selection of Mobile Phase
|
Trial :1 |
|
|
Column |
: C-18 (id 4.6 x 250 mm, 5 µm) |
|
Mobile Phase |
: Acetonitrile: Phosphate Buffer (30:70v/v) |
|
Detection |
300nm |
|
Flow rate |
1mL/minute |
|
Run Time |
10 minutes |
|
Observations: |
No peak observed |
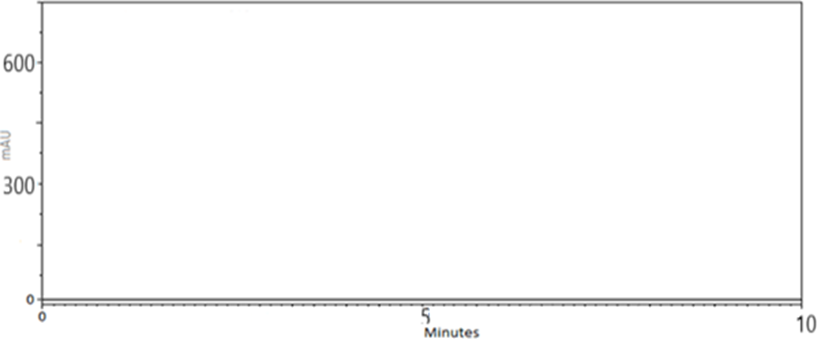
Fig 4. Trial 1: Chromatogram of Folic acid & Lysine Hydrochloride Acetonitrile: Phosphate Buffer(30:90v/v)
Table 9.0 Trial 2: Selection of Mobile Phase
|
Trial :2 |
|
|
Column |
C-18 (id 4.6 x 250 mm, 5 µm) |
|
Mobile Phase |
Acetonitrile: Phosphate Buffer (50:50v/v) |
|
Detection |
300nm |
|
Flow rate |
1 mL/minute |
|
Run Time |
10 minutes |
|
Observations: |
Only one peak detected byt broad peak observed |
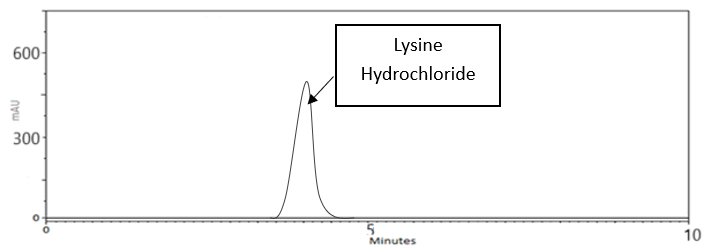
Fig 5.0 Trial 2: Chromatogram of Folic acid & Lysine Hydrochloride Acetonitrile: Phosphate Buffer(50:50v/v)
Table 10.0 Trial 3: selection of mobile phase
|
TRIAL :3 |
|
|
Column |
C-18 (id 4.6 x 250 mm, 5 µm) |
|
Mobile Phase |
Acetonitrile: Phosphate Buffer (80:20v/v) |
|
Detection |
300nm |
|
Flow rate |
1 mL/minute |
|
Run Time |
10 minutes |
|
Observations: |
Only one peak detected byt broad peak observed |

Fig. 6.0 Trial 3: Chromatogram of Folic acid & Lysine Hydrochloride Acetonitrile: Phosphate Buffer(80:20v/v)
Table 11.0 Trial 4: Selection of Mobile Phase
|
Trial :4 |
|
|
Column |
C-18 (id 4.6 x 250 mm, 5 µm) |
|
Mobile Phase |
Methanol: Phosphate Buffer(60:40v/v) |
|
Detection |
300nm |
|
Flow rate |
1 mL/minute |
|
Run Time |
10 minutes |
|
Observations: |
Only one peak detected |

Fig 7.0 Trial 4: Chromatogram of Folic acid & Lysine Hydrochloride Methanol: Phosphate Buffer(60:40v/v)
Table 12.0 Trial 5: selection of mobile phase
|
Trial :5 |
|
|
Column |
C-18 (id 4.6 x 250 mm, 5 µm) |
|
Mobile Phase |
Methanol: Phosphate Buffer (70:30v/v) |
|
Detection |
300nm |
|
Flow rate |
1 mL/minute |
|
Run Time |
10 minutes |
|
Observations: |
Only one peak detected |
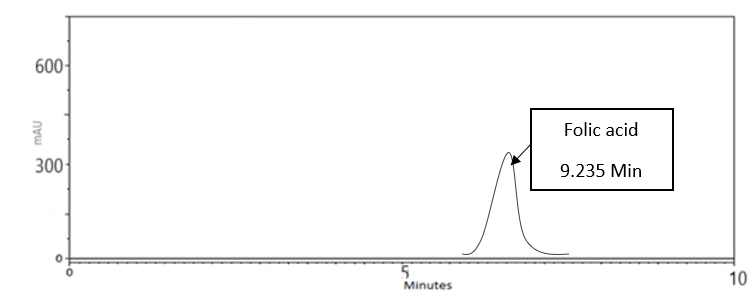
Fig 8.0 Trial 5: Chromatogram of Folic acid & Lysine Hydrochloride Methanol: Phosphate Buffer(70:30v/v)
Table 13.0 Trial 6: selection of mobile phase
|
Trial :6 |
|
|
Column |
C-18 (id 4.6 x 250 mm, 5 µm) |
|
Mobile Phase |
Methanol : Phosphate Buffer(80:20v/v) |
|
Detection |
300nm |
|
Flow rate |
1 mL/minute |
|
Run Time |
10 minutes |
|
Observations: |
Peaks detected but broad peaks observed |

Fig 9.0 Trial 6: Chromatogram of Folic acid & Lysine Hydrochloride Methanol: Phosphate Buffer(80:20v/v)
Table 14.0 Trial 7: Selection of Mobile Phase
|
Trial :7 |
|
|
Column |
C-18 (id 4.6 x 250 mm, 5 µm) |
|
Mobile Phase |
Chloroform: Acetonitrile (70:30v/v) |
|
Detection |
300nm |
|
Flow rate |
1 mL/minute |
|
Run Time |
10 minutes |
|
Observations: |
One Peak detected but broad peak observe. |
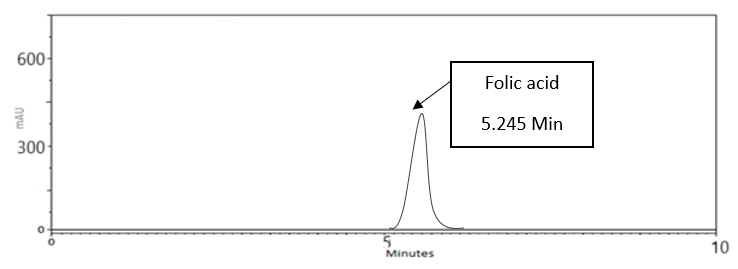
Fig 10.0 Trial 7: Chromatogram of Folic acid & Lysine Hydrochloride Chloroform: Acetonitrile (70:30 v/v)
Table 15.0 Trial 8: Selection of Mobile Phase
|
TRIAL :8 |
|
|
Column |
C-18 (id 4.6 x 250 mm, 5 µm) |
|
Mobile Phase |
Chloroform: Acetonitrile (60:40v/v) |
|
Detection |
3000nm |
|
Flow rate |
1 mL/minute |
|
Run Time |
10 minutes |
|
Observations |
Peak detected but broad peaks observed |
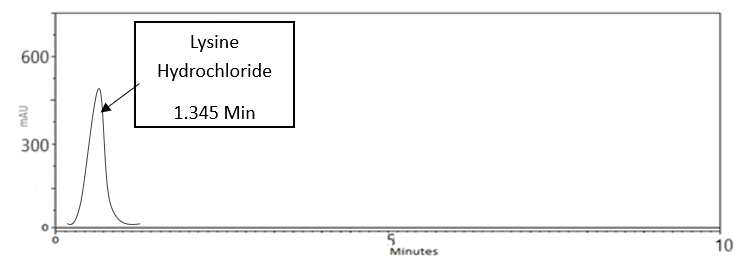
Fig 11.0 Trial 8: Chromatogram of Folic acid & Lysine Hydrochloride Chloroform: Acetonitrile (60:40 v/v)
Table 16.0 Trial 9: selection of mobile phase
|
Trial :9 |
|
|
Column |
C-18 (id 4.6 x 250 mm, 5 µm) |
|
Mobile Phase |
Chloroform: Acetonitrile (50:50v/v) |
|
Detection |
300nm |
|
Flow rate |
1 mL/minute |
|
Run Time |
10 minutes |
|
Observations |
Peak detected and separated but broad peaks observed |

Fig 12.0 Trial 9: Chromatogram of Folic acid & Lysine Hydrochloride Chloroform: Acetonitrile(50:50v/v)
Table 17.0 Trial 10: selection of mobile phase
|
Trial :10 |
|
|
Column |
C-18 (id 4.6 x 250 mm, 5 µm) |
|
Mobile Phase |
Acetonitrile: water (30:70v/v) |
|
Detection |
300nm |
|
Flow rate |
1 mL/minute |
|
Run Time |
30 minutes |
|
Observations |
C-18 (id 4.6 x 250 mm, 5 µm) |
Fig 13.0 Trial 10: Chromatogram of Folic acid & Lysine Hydrochloride Acetonitrile: Water(30:70v/v)
Table 18.0 Trial 11: selection of mobile phase
|
Trial :11 |
|
|
Column |
C-18 (id 4.6 x 250 mm, 5 µm) |
|
Mobile Phase |
Acetonitrile: Phosphate buffer (55:25:25 v/v/v) |
|
Detection |
300nm |
|
Flow rate |
1 mL/minute |
|
Run Time |
10 minutes |
|
Observations |
only one peak detected. |

Fig 14.0 Trial 11: Chromatogram of Folic acid & Lysine Hydrochloride Methanol: Acetonitrile: Phosphate buffer (55:25:25 v/v/v)
Table 19.0 Trial 12: selection of mobile phase
|
Trial :12 |
|
|
Column |
C-18 (id 4.6 x 250 mm, 5 µm) |
|
Mobile Phase |
Methanol: Acetonitrile: Phosphate buffer (60:20:20 v/v/v) |
|
Detection |
300nm |
|
Flow rate |
1 mL/minute |
|
Run Time |
10 minutes |
|
Observations |
Peaks detected and separated, but broad peaks observe. |
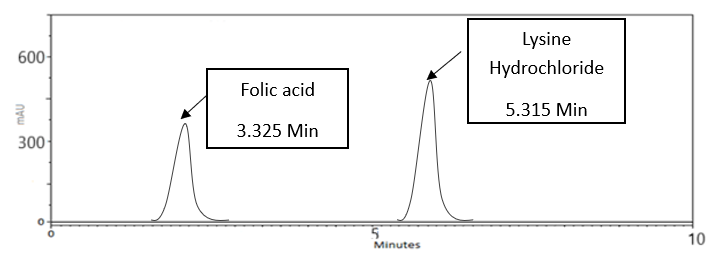
Fig 15.0 Trial 12: Chromatogram of Dapagliflozin & Bisoprolol Acetonitrile: Water (80:20v/v)
Table 20.0 Trial 13: selection of mobile phase
|
Trial :13 |
|
|
Column |
C-18 (id 4.6 x 250 mm, 5 µm) |
|
Mobile Phase |
Methanol: Acetonitrile: Phosphate buffer (50:20:30 v/v/v) |
|
Detection |
300nm |
|
Flow rate |
1.5 mL/minute |
|
Run Time |
10 minutes |
|
Observations |
Good peaks with Adequate solution were observed. |
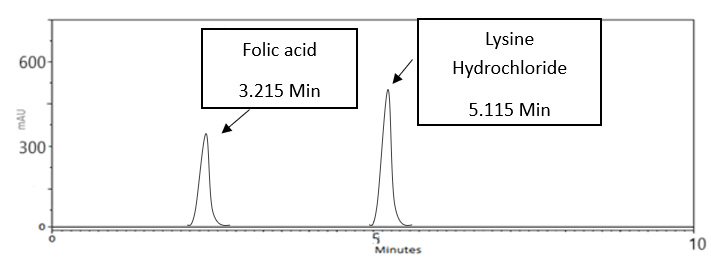
Fig 16.0 Trial 13 Optimized mobile phase trial for optimized chromatogram of Std. Folic acid:3.215 min, Lysine Hydrochloride: 5.115 min
Optimized Chromatographic Conditions:
Optimized mobile phase trial for optimized chromatogram of Std. Folic acid:3.215 min, Lysine Hydrochloride: 5.115 min
Fig 17.0: Chromatogram of blank Methanol: Acetonitrile: Phosphate buffer (50:20:30 v/v/v)
Chromatographic conditions for optimized mobile phase trial OF Dapagliflozin & Bisoprolol
Table 23.0: optimized mobile phase trial of Folic Acid &Lysine Hydrochloride
|
Optimized Method |
|
|
Column |
C-18 (id 4.6 x 250 mm, 5 µm) |
|
Mobile Phase |
Methanol: Acetonitrile: Phosphate buffer (50:20:30 v/v/v) |
|
Detection |
300nm |
|
Flow rate |
1.5 mL/minute |
|
Run Time |
10 minutes |
|
Detector |
UV detector |
|
Injection volume |
10 μl |
|
Column oven temperature |
40°C |
|
Mode: |
ISOCRATIC |
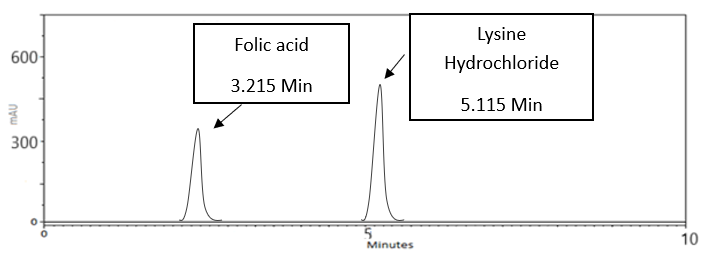
Fig 19.0: Optimized mobile phase trial for optimized chromatogram of Std Folic Acid :3.215 min Lysine Hydrochloride: 5.115 min
Introduction Of Method Validation Parameter:
Method validation is the process of documenting or proving that an analytical method provides analytical data acceptable for the intended use. The need to validate a method and the procedure to be followed are matters of professional judgement, although well-prescribed procedures and guidelines are now available that aid in decision making. According to that the various validation parameters to validate each and every above stated method are:
Accuracy and Recovery:
The capability of a procedure to generate outcomes close to the actual or standard value (Standard value may be reference value given in official compendia).
The chosen concentration for precision investigations must encompass the complete concentration range (i.e. one may the lowest concentration, one may the middle and one may be the last of range).
Accuracy is performed by performing recovery studies by spiking in 2 ways:
It can be performed at different level like 50, 100 and 150 % of test concentration or 80, 100, 120% of test concentration.
Reproducibility and Precision:
It is defined as the degree of similarity between test findings obtained from many samplings of the same sample. C.V. or relative standard deviation is capable of expressing it is further classified as reproducibility, repeatability, and intermediate precision. Repeatability is the capability of an analytical procedure to produce identical test findings when performed in a similar setting by the same operator over a brief period of time. It is stated as R.S.D. when a minimum of three concentrations is analysed at least six times each, and R.S.D. is determined. At least 6 repetitions encompassing 100% of the target concentration or 9 repetitions covering the complete linear range must be assessed. (i.e., three replications for every concentration) Reproducibility is the capacity of an analytical procedure to yield same test findings when applied to identical samples under various conditions and by different analysts. Conditions of operation vary, but the variance is still within acceptable parameters. It is a crucial validation parameter if the procedure must be executed under diverse situations.
Range and Linearity:
It is the capability of the method to generate findings that are directly proportional to the concentration of a specific component in the samples. It is shown via certain mathematical modifications.
Robustness:
A technique has the ability to be unaffected by tiny, purposeful changes to operating settings, but these changes are still within the method's range. The effects of these adjustments on the method's output are evaluated. By conducting robustness, one may assess if revalidation is necessary or not. Variable technique parameters include flow rate, mobile phase composition, mobile phase pH, and detection wavelength. This modification can be within the permissible range (i.e., 2% to 5% of the original value). The essential method parameter that identifies the susceptibility of the technique to change must be reported following ICH rules. However, it is not a registration requirement.
Limit of Quantification and Limit of Detection:
It refers to the analytical method's capacity to identify analyte in the presence of a matrix with sufficient accuracy and precision. The method may be able to detect the analyte but not quantify it. There may be confusion between technique sensitivity and LOD. Sensitivity can distinguish between minute differences in concentration. It may be described as the slope of the regression line.
Following methods are available other than signal to noise ratio that are as follows:
RESULT AND DISCUSSION:
Analytical method Validation
Linearity
For the purpose of linearity, accurately weighed amount of Folic acid (10 mg), and Lysine Hydrochloride (10 mg) was taken into the volumetric flask (10 ml) and volume of the flask was raised to 10 ml with methyl alcohol to give stock solution containing 100 µg/ml of Folic acid, and 100 µg/ml of Lysine Hydrochloride. Various aliquots from this stock solution were transferred to another 10 ml volumetric flask and volume was raised to the mark with mobile phase to give final solutions containing 0.5+35, 0.8+56, 1.0+70, 1.2+84 µg/ml and 1.5+105 µg/ml of Folic acid and Lysine Hydrochloride respectively.
Table 24.0 Linearity data for Folic Acid
|
|
|
FOLIC ACID |
||
|
Linearity level |
Conc. (µg/ml) |
Mean Area |
± SD (n=5) |
% RSD |
|
50 % Linearity |
0.5 |
162606 |
162606± 354.94 |
0.22 |
|
75% Linearity |
0.8 |
266614 |
266614± 2844.91 |
1.07 |
|
100% Linearity |
1.0 |
323891 |
323891± 2629.41 |
0.81 |
|
125% Linearity |
1.2 |
387361 |
387361± 2278.43 |
0.59 |
|
150% Linearity |
1.5 |
487099 |
487099± 1083.92 |
0.51 |
Table 25.0 Linearity data for Lysine Hydrochloride
|
Linearity level |
Conc. (µg/ml) |
Mean Area |
± SD (n=5) |
% RSD |
|
50 % Linearity |
35.0 |
303109 |
303109 ± 3370.21 |
1.11 |
|
75% Linearity |
56.0 |
481026 |
481026± 2240.21 |
0.57 |
|
100% Linearity |
70.0 |
607529 |
607529± 2927.73 |
0.48 |
|
125% Linearity |
84.0 |
729227 |
729227± 4888.17 |
0.67 |
|
150% Linearity |
105.0 |
911747 |
911747± 6113.45 |
0.67 |
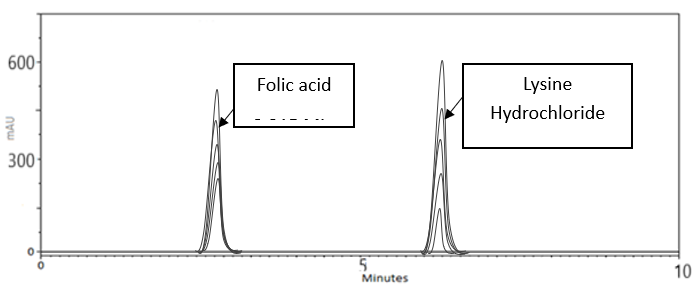
Fig 20.0: Overlain Linearity Spectra of Folic Acid and Lysine Hydrochloride
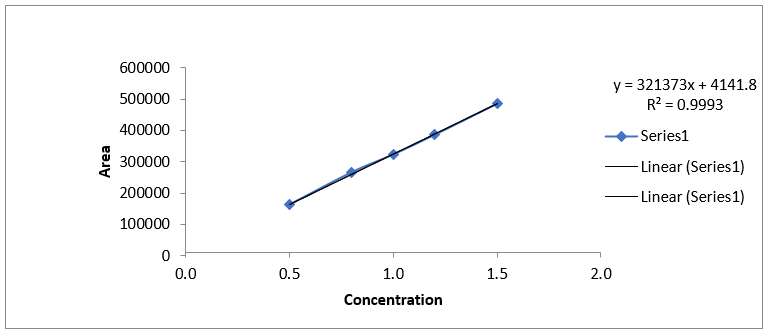
Fig 21.0: Calibration curve of Folic Acid

Fig 22.0: Calibration curve of Lysine Hydrochloride
Table 26.0 Linearity results for Folic Acid and Lysine Hydrochloride
|
Regression Analysis |
Folic acid |
Lysine Hydrochloride |
|
Concentration Range |
0.5-1.5μg/mL |
35-105 μg/mL |
|
Regression equation |
y = 321373x + 4141.8 |
y = 8718.2x - 3749.8 |
|
Correlation co-efficient |
0.9993 |
0.9999 |
Precision
Repeatability
The data for repeatability for Folic acid and Lysine Hydrochloride is shown in table 27.0. The % R.S.D For Repeatability data was found to be 0.64 % for Folic acid and 0.45 % for Lysine Hydrochloride.
Table 27.0 Repeatability data for Folic Acid and Lysine Hydrochloride
|
Drugs |
Conc. (µg/ml) |
Mean Peak Area ± SD |
%RSD |
|
Folic acid |
1 |
466878.4 ± 2989.2 |
0.64 |
|
Lysine Hydrochloride |
70 |
705279.61 ± 3208.55 |
0.45 |
Inter-day precision
The data for interday precision for Folic acid and Lysine Hydrochloride is shown in table 28.0 & 29.0 The % R.S.D for intraday precision was found to be 0.36-0.79% for Folic acid and 0.13 -0.41 % for Lysine Hydrochloride.
Inter-Day Precision for Folic Acid:
Table 28.0 Inter-day precision data for estimation Folic Acid
|
Level |
µg/mL |
Area |
Mean |
SD |
RSD |
|
50% |
0.5 |
164879 |
164579.3 |
608.6052 |
0.369794 |
|
163879 |
|||||
|
164980 |
|||||
|
100% |
1.0 |
324768 |
327088 |
2587.849 |
0.791178 |
|
326617 |
|||||
|
329879 |
|||||
|
150% |
1.5 |
482354 |
485136 |
2410.329 |
0.496836 |
|
486598 |
|||||
|
486456 |
|||||
|
|
Folic acid |
Lysine Hydrochloride |
|||
Inter-Day Precision for Lysine Lydrochloride:
Table 29.0 Inter-day precision data for estimation of Lysine Hydrochloride
|
Level |
µg/mL |
Area |
Mean |
SD |
RSD |
|
50% |
35 |
303462 |
304515 |
1042.174 |
0.342241 |
|
304537 |
|||||
|
305546 |
|||||
|
100% |
70 |
604378 |
604606.7 |
253.3384 |
0.041901 |
|
604563 |
|||||
|
604879 |
|||||
|
150% |
105 |
912365 |
913053.3 |
1211.331 |
0.132668 |
|
914452 |
|||||
|
912343 |
Intra-day precision:
The data for intra-day precision for Folic acid and Lysine Hydrochloride is shown in table 9.5. The % R.S.D for intraday precision was found to be 0.47-1.01 % for Folic acid and 0.11 – 0.24 % for Lysine Hydrochloride.
Table 30.0 Intra-day precision data for estimation of Folic Acid and Lysine Hydrochloride
|
Mcg/ml |
0.5 |
1.0 |
1.5 |
35 |
70 |
105 |
|
|
165490 |
325682 |
487690 |
303757 |
604768 |
912345 |
|
|
167860 |
327689 |
483452 |
304522 |
603562 |
916578 |
|
|
168790 |
328706 |
487690 |
303425 |
603568 |
913342 |
|
MEAN |
167380 |
327359 |
486277.3 |
303901.3 |
603966 |
914088.3 |
|
± SD |
1701.558 |
1538.772 |
2446.81 |
562.5623 |
694.5589 |
2212.992 |
|
RSD |
1.016584 |
0.470056 |
0.503172 |
0.185113 |
0.115 |
0.242098 |
Accuracy:
Accuracy of the method was confirmed by recovery study from synthetic mixture at three level standard additions. Percentage recovery for Folic acid & Lysine Hydrochloride was found to be 99.48- 99.78% and 99.33-100.59 % respectively. The results are shown in table31.0-32.0.
Recovery For Dapagliflozin:
Table 32.0 Recovery data for Dapagliflozin
|
Recovery Level |
mg added |
Mg recovered |
% Recovery |
Mean (%) |
|
50% |
5.02 |
5.00 |
99.60 |
99.87 |
|
5.02 |
4.99 |
99.40 |
||
|
5.02 |
5.05 |
100.60 |
||
|
100% |
10.05 |
9.99 |
99.40 |
99.60 |
|
10.05 |
10.06 |
100.10 |
||
|
10.05 |
9.98 |
99.30 |
||
|
150% |
15.20 |
15.45 |
101.64 |
101.23 |
|
15.20 |
15.31 |
100.72 |
||
|
15.20 |
15.40 |
101.32 |
Recovery For Bisoprolol:
Table 33.0 Recovery data for Bisoprolol
|
Recovery Level |
mg added |
Mg recovered |
% Recovery |
Mean (%) |
|
50% |
2.51 |
2.48 |
98.80 |
100.00 |
|
2.51 |
2.53 |
100.80 |
||
|
2.51 |
2.52 |
100.40 |
||
|
100% |
5.10 |
5.02 |
98.43 |
98.43 |
|
5.10 |
5.03 |
98.63 |
||
|
5.10 |
5.01 |
98.24 |
||
|
150% |
7.54 |
7.51 |
99.60 |
99.87 |
|
7.54 |
7.52 |
99.73 |
||
|
7.54 |
7.56 |
100.27 |
LOD and LOQ:
The limit of detection (LOD) and Limit of Quantification (LOQ) was found to be as per below:
Table 34.0 LOD and LOQ Limit for Lysine Hydrochloride & Folic Acid
|
Folic acid |
Lysine Hydrochloride |
||
|
LOD(μg/ml) |
LOQ(μg/ml) |
LOD(μg/ml) |
LOQ(μg/ml) |
|
2.40 |
3.15 |
1.30 |
2.55 |
Robustness:
The method is found to be robust as the results were not significantly affected by slight variation in Mobile Phase Composition and flow rate of mobile phase. The results are shown in table 35.0. Variation seen was within the acceptable range respect to peak asymmetry and theoretical plates, so the method was found to be robust.
Table 35.0 Robustness data for Folic Acid & Lysine Hydrochloride
|
Parameter |
Level of Change |
Effect on assay volume |
|||
|
Folic acid Lysine Hydrochloride |
|||||
|
Assay ± SD |
RSD |
Assay ± SD |
RSD |
||
|
Flow rate |
1.0 mL/min |
99.70 ±0.50 |
0.49 |
99.92±0.48 |
0.48 |
|
1.1 mL/min |
101.09 ±0.72 |
0.72 |
99.99±0.83 |
0.83 |
|
|
Mobile phase composition |
25:75 |
99.47 ±0.53 |
0.53 |
100.22±1.43 |
1.43 |
|
27:73 |
99.39 ±0.99 |
0.98 |
100.04 ±1.06 |
1.06 |
|
|
23:77 |
99.51 ±0.67 |
0.67 |
99.45±0.77 |
0.78 |
|
Analysis of marketed product:
The proposed method was successfully applied to analysis of the commercially available tablet formulation. The % drugs were found satisfactory, which is comparable with the corresponding label claim.
Table 36.0 Analysis of marketed formulations
Table 36.0 Analysis of Marketed Formulations
|
Drug |
Amount taken (µg/mL) |
Amount found (µg/mL) |
% Assy |
|
Folic acid |
1 |
9.93±0.04 |
99.80 ±1.20 |
|
Lysine Hydrochloride |
70 |
8.03 ±0.10 |
100.70±1.07 |
Summary Of Method Validation:
Summary of validation parameter are shown in below table. All the parameters for substance met the criteria of ICH guideline for the method validation and found to be suitable for routine quantitative analysis in pharmaceutical dosage forms. The result of linearity, accuracy, precision proved to be within limits with lower limits of detection and quantification. Robustness of method was confirmed as no significant in the were observed on analysis by subjecting the method to slight change in the method condition. Assay results obtained by proposed method are fair agreement.
Table 37.0 Summary of validation parameter of RP-HPLC method
|
Optimized chromatographic Condition |
|
|
Stationary Phase |
C-18 (id 4.6 x 250 mm, 5 µm) |
|
Mobile Phase |
Methanol: Acetonitrile: Phosphate buffer (50:20:30 v/v/v) |
|
Detection wave Length |
300 nm |
|
Flow rate |
1 ml/minute |
|
Run time |
10 minutes |
|
Retention Time |
Folic acid: 3.215 min, Lysine Hydrochloride:5.115 min. |
Table 38.0 Validation Parameters
|
Validation Parameters |
||||
|
Parameter |
Limit |
Result |
Conclusion |
|
|
Folic acid |
Lysine Hydrochloride |
|||
|
Linearity and Range |
R2> 0.995 |
0.9993 (0.5-1.5µg/mL) |
0.999 (35-105µg/mL) |
Method was linear |
|
Repeatability |
RSD<2 |
0.31-1.54 |
0.10-0.87 |
Method was repeatable |
|
LOD |
- |
2.40 |
3.40 |
- |
|
LOQ |
- |
1.30 |
2.55 |
- |
|
Intra-day Precision |
RSD<2 |
0.36-0.79% |
0.13 -0.41 % |
Method was precise |
|
Inter-Day Precision |
RSD<2 |
0.47-1.01 % |
0.11 – 0.24 % |
Method was precise |
|
%Recovery |
98-102% |
99.35 ±0.83– 100.01±0.03 % |
100.22±0.21 – 100.78±0.23% |
Method was accurate |
|
Robustness |
RSD<2 |
0.41– 0.63 |
0.40-0.91 |
Method was robust |
|
Assay% |
|
99.80 ±1.20 |
100.70±1.07 |
- |
CONCLUSION:
A simple, economic, specific, accurate and precise RP-HPLC method for simultaneous estimation of dapagliflozin propanediol monohydrate and bisoprolol fumarate in synthetic mixture All method validation parameters lie within its acceptance criteria as per ICH Q2(R1) guideline so we can conclude that methods are specific, linear, accurate and precise. In RP-HPLC method, Linearity was observed in the concentration rang of Dapagliflozin 5-15 µg/ml and Bisoprolol 2.5-7.5 µg/ml with correlation coefficient of Dapagliflozin & Bisoprolol 0.998 & 0.999. The proposed method was successfully applied for the simultaneous estimation of both drugs in combined dosage form. The Assay value of Dapagliflozin & Bisoprolol was found to be 99.30% & 100.60%. The Mean recovery was found to be in the range Dapagliflozin & Bisoprolol of 99.87 – 101.23% & 99.87 – 100.0%. LOD and LOQ were found to be Dapagliflozin & Bisoprolol of 2.40 μg/ml and 3.15 μg/ml & 1.30 μg/ml and 2.55 μg/ml. The % RSD of repeatability precision, intra-day precision & inter-day precision of Dapagliflozin & Bisoprolol was found to be 0.64% & 0.45%, 0.18-0.34% & 0.06-0.70%, 0.05-0.69% & 0.19-0.40%. it indicated that the method is precise. The % RSD of Robustness change in Flow rate Dapagliflozin & Bisoprolol was found to be 0.041%-0.63% & 0.40%-0.91. Hence, proposed method is well suited for simultaneous estimation in synthetic mixture. it can be easily and conveniently adopted for routine analysis of semi solid dosage form.
REFERENCES


Rajdeep Dodiya*, Dhirendra Kumar Tarai, Khyati Bhupta, Dr. Santosh Kirtane, Development and Validation of RP-HPLC Method For Simultaneous Estimation of Folic Acid and Lysine Hydrochloride in Their Combined Oral Liquid Formulation, Int. J. of Pharm. Sci., 2025, Vol 3, Issue 6, 3595-3617. https://doi.org/10.5281/zenodo.15722410
 10.5281/zenodo.15722410
