Department Of Pharmaceutics Shree Dev Bhoomi Institute Of Science And Technology Pondha Rd, Majhaun, Uttarakhand 248007
Gastroretentive dosage forms might be used as a controlled-release drug delivery system. Gastroretentive floating medicines extend the duration for a drug's presence in the stomach & allow for controlled dispensing of a range of drugs as their size is less than that in stomach juices. The aim of this study is to develop and evaluate floating microspheres that improve the patient's experience using nateglinide as a model drug for type-2 diabetes mellitus. Material & Method: By using ethyl cellulose and Eudragit S-100 as release-delaying polymers, float spheres were created by a solvent extraction method in saturated oil. The floating microspheres were evaluated for drug content, drug retention effectiveness, yield percentage (%), particle size, in vitro floating ability, and in vitro drug release studies. The surface structure of the created microspheres was evaluated using scanning electron microscopy. It was found that the microspheres were spherical in shape and permeable. Compatibility studies were done using the Fourier transform for infrared (FTIR) method. For a full day or more, the prepared microspheres either floated or kept releasing the medication. In-vitro releasing kinetics was studied using a variety of release kinetics models, such as these: zero order, first order, Higuchi, & Korsmeyer Peppas models. The Higuchi plot was found as the most suitable model, had a release factor n that is under 0.89. Based on the results, nateglinide floating microspheres provide a practical and suitable way to release a medication over an extended period of time, increasing oral bioavailability, efficacy, and patient adherence. Result: - The formulation exhibited desirable physicochemical properties, including a desirable small particle size, best percentage yield, better drug entrapment efficiency, and showed a good buoyancy percentage and excellent micromeritics properties. In vitro drug release studies exhibit a good release of NAT from the microspheres formulation over a 12 h period, indicating a controlled release of drug for prolonged period of time and moreover the release kinetics of drug release followed kosermeyer peppas model with the value of slope (n) was calculated and found to be (0.2194) which is less than 0.45 (n < 0.45) which indicates anomalous fickian diffusion.
Because of the oral route's simplicity of management, compliance by patients, and formulation flexibility, it is often regarded as a highly acceptable method for drug delivery.(1) The drug's ability to be better absorbed from the GI tract is crucial to the efficacy of the orally administration method. However, the primary issue with traditional delivery is to keep the medication concentration within the range of therapeutic effective concentration, which can only be reached by taking many times daily.(2)
Even though attempts have been made to create controlled release delivery methods for the oral route, many of issues such as divergent drug absorption or unregulated gastrointestinal delay have highlighted the need for more advanced delivery methods(3) for drugs that can improve the drug's transit time or offer efficient local concentration. When it comes to enhancing the oral sustained administration of medications with an absorption window in a specific GI tract region, the gastro retentive drug delivery system may help keep the medication in the stomach.(4) The gastric residence time (GRT) can be extended using a variety of techniques, such as floating drug dosage systems (FDDS), mucoadhesive systems, swellable or expanding systems, and high-density systems.(5) These systems offer the benefit of increasing the solubility of medications that are less soluble in high pH environments, decreasing drug waste, and increasing the bioavailability of medications with a limited absorption window.(6) It can also be used to administer medications locally to the stomach and the first few inches of the small intestine.(7) Using a non-effervescent method, floating microspheres are a gastroretentive medication delivery device. They are empty, spherical particles devoid of a center. These microspheres are made of synthetic polymers and proteins have a diameter ranging from 1 ?m to 1000 ?m. They are characterized by their free flow. Low density hydrodynamically controlled drug delivery systems,(8) also known as floating drug delivery systems, have enough buoyancy to float above the contents of the GI tract & keep high for a longer duration of time without decreasing the rate at which the stomach empties.(9) Drugs are better retained in the stomach and there are less variations in the concentration of drugs in the blood if they discharge regularly via floating systems(10). A variety of polymers, such as polycarbonate, HPMC, cellulose acetate, calcium alginate, Eudragit S, chitosan, etc. are frequently employed to create floating microspheres. Floating microspheres are therefore seen to be among the most promising buoyant systems(11). Benefits of having several unit systems as well as improved floating characteristics. Emulsion solvent evaporation and emulsion solvent diffusion are common procedures used in their production (12). The kind of polymer, plasticizer, and solvent used in the preparation all have a major impact on the drug release and improved floating qualities.(13)
The medication has a brief half-life of 1.5 hours. The medication has a 73?solute bioavailability. 60–120 mg three times a day is the standard dose schedule. The therapeutic impact must be maintained with regular dosage. Consequently, it would be advantageous to create a medication delivery system that stays in the gastrointestinal tract for a longer amount of time.(14) Anti-diabetic medication-encapsulated microspheres improve the drug's efficacy and controlled release from polymer membrane, preserving its concentration for an extended period of time. Nateglinide short half-life, rapid clearance, enzymatic stability, and absorption throughout the gastrointestinal tract make it a good candidate for a floating dosage form. The study's objectives were to make the medication more bioavailable and less likely to cause adverse effects.(15) The controlled distribution of the drug from the polymer matrix was achieved by using a range of polymers, including ethyl cellulose and soluble acrylic polymers like Eudragit S-100.(16) The oil in water emulsified solvent evaporation approach was used for application. Examined were the effects of several parameters, including % yield, particle size, drug entrapment effectiveness, floating qualities, and in-vitro release of the resultant microspheres.(17)
METHODS & MATERIAL:
Material:
Preformulation studies:
Drug Identification (NAT)
Drug sample was obtained from Cayman Chemicals Pvt Ltd.
Physical Appearance
Physical Appearance of drug like colour, odour was analysed by visual observation.
Melting Point
A capillary melting point apparatus was used to determine melting point of the drug. A small amount of drug was filled in the previously one-sided sealed capillary and melting point analysed in melting point apparatus to observe melting point range. Also, melting point was analysed by melting point apparatus at a heating from(18)
FTIR spectroscopy
IR study was performed by identification and structural analysis of the procured NAT using Fourier transformed infrared spectroscopy. The KBr disc technique was employed using 1 mg of NAT powder in 100 mg of spectroscopic grade dried KBr. Mixture was ground into a fine powder using an agate mortar/pestle and compressed into KBr disc under a hydraulic press at 10,000 psi. Each KBr disc was scanned 32 times at 4mm at a resolution of 2 cm over a wave number region of 4000-400 cm and characteristic bands were recorded. The characteristic Infrared spectrum and Peaks were observed and were compared with the spectrum and peaks of the reference spectrum of the drug.(19)
Absorption maximal
To obtain structural information regarding the chromophoric part of NAT, UV visible spectrophotometric method was used. Stock solution of 0.1 mg/mL of NAT was freshly prepared in methanol and it was further diluted to obtain concentration of 10 ug/ ml. Zero order spectra were recorded in the range of 200-400mm to determine absorption maxima of NAT.(20)
Standard curve of NAT in Methanol
Stock solution of 0.1 mg/mL of NAT was freshly prepared by dissolving 5 mg of pure drug in
50 mL methanol. Prepared solution was further diluted with methanol to obtain concentration of 100 ug/mL primary stock; 2mL, 6ml, 8mL, 10mL, 12mL was pipetted into a 10 mL volumetric flask and the volume was made up to the mark with methanol. Absorbance of these solutions was measured at 204 nm against blank using UV-visible spectrophotometer.(21)
Preformulation studies (Formulation and Development)
Solubility Studies
The solubilization range of NAT and different Polymers like Ethyl cellulose, HPMC, Eudragit S-100, Eudragit RSPO in different solvents like Chloroform, DMSO, Dichloromethane, Acetonitrile, Ethyl acetate was evaluated by dissolving each polymer and drug with the abovementioned solvents and the interference was selected on the basis of solubility(22)
Selection of Excipients useful for microspheres formulation
Screening of the excipients for the formulation of microspheres was done on the basis of hit and trial method. Ethyl cellulose, HPMC, Eudragit $100, Eudragit RSPO was screened on the basis of solubility in particular solvent as mentioned above. Moreover, these polymers were prepared for trial batches to get smooth surface particles. On the basis of solubility and trial formulation batches the optimized polymer was employed to develop final formulation batches for optimized microspheres of NAT. (23)
Drug Excipient Interactions
To access the interactions between the drug and excipients, FTIR spectroscopy technique was employed. For this purpose, FTIR spectra of ethyl cellulose, and ethyl cellulose mixture with drug were recorded on an FTIR spectrophotometer (Cary d630 FTIR, Agilent Technologies, US) equipped with attenuated total reflectance (ATR) accessory, in the frequency range of 4000-400 cm'. (24)
Experimental Design
Design of Experiments
Optimized formulation was prepared by the use of Design Expert 13, software a 32 factorial design was used in the current study to build the optimised formulation, incorporating interactive and polynomial terms to evaluate the response. Various variables were selected as follows: Independent variables: (a) Polymer Concentration (X1) (b) Stabilizer Concentration (X2) (c) Stirring Speed (X3) Dependent variables: Particle Size (Y1) (b) Percentage yield (Y2)
(c) Entrapment Efficiency (Y3). (25)
Method of Preparation of NAT loaded Floating Microspheres
Dissolving or dispersing the drug and polymer mixture in chloroform (10 mL). Add the resulting emulsion dropwise to a larger volume of a continuous phase (usually an aqueous phase) containing a stabilizer hot Poly vinyl alcohol (PVA). The mixture was stirred in a mechanical stirrer at 1200 rpm for 2 hrs until the solvent evaporates completely. The resulting formed floating microspheres were filtered and washed with distilled water then dried at hot air oven in a room temperature (26).
Characterization of NAT Loaded Floating Microspheres
Particle Size (Y1)
To analyse the shape and size of the floating microspheres under an optical microscope, random scans of the microspheres were performed under an optical microscope and their size is measured by comparing them to a calibrated scale (27).
Micromeritic Properties
The prepared microspheres were characterized by their micrometric properties, i.e angle of repose, Bulk density, Tapped density.
A) Angle of repose
The maximum angle formed between the surface of a pile of powder and horizontal surface is called the angle of repose.
Tan ? = h/r
Where
T =angle of repose
h = height of the circle formed by the pile of powder
r = radius of pile
Bulk density and Tapped density
Bulk and tapped densities were measured by using a graduated cylinder. Weighed amount of of powder were passed through a glass funnel. The powder poured in cylinder was tapped 100 times for calculating bulk volume (Vb) and tapped volume (Vt) respectively. Then tapped volume was noted down and bulk density and tapped density were calculated and was expressed in g/cm3 Mass of microsphere.
Bulkdensity=Mass of microsphereVolume of microsphere aftertapping
Tappeddensity=Mass of microsphereVolume of microsphere aftertapping
Entrapment Efficiency (Y2)
In 10 mL of Methanol 10 mg of floating microspheres was dissolved and then it was centrifuged for 30 mins and then 1 mL of supernatant fluid was taken after centrifugation and volume was made up to 10 mL using Methanol and then the absorbance of the solution was measured in UV spectrophotometric at 204 nm.
%EE=Amount of drug actually presentTheoretical drug loadexpectedX 100
Percentage yield (Y3)
The percentage % yield of floating microspheres, which was obtained by dividing the product's
actual weight by the sum of drug and polymer used in the formulation of floating microspheres
It is represented by the formula. (28)
%yield=Actual yieldTheorticalyieldX 100
Buoyancy Percentage
Weighed floating microspheres will be placed in a 250 mL beaker containing simulated gastric fluid. The mixture was stirred at 100 rpm/min in a mechanical stirrer. The layer of buoyant microparticles will be pipetted and separated by filtration after 1 hour, 2 hours, 4 hours, and 6 hours. Filtration separated the particles in the sinking particulate layer. Then particles of both types were dried in a desiccator until they dry. The weight ratio of floating particles to the sum of floating and sinking particles was used to calculate buoyancy microsphere particles.(12)
Optimization by Derringer Desirability Approach
The Derringer Desirability Approach, also known as the Derringer-Suich desirability function or simply desirability function, is a method used in multi-objective optimization to determine an overall desirability value for a set of response variables. It combines multiple response variables into a single value, allowing for the comparison and selection of optimal solutions. The basic idea behind the Derringer Desirability Approach is to transform individual response variables into desirability functions, which map the range of each variable onto a scale from 0 to 1. The desirability function represents the preference or desirability of a particular value within the variable 39; range. This transformation allows for the combination of multiple response variables into a single desirability value. After the formulation of polymeric micelles with the predicted values (given by the software after optimizating by Derringer Desirability Approach) of independent variables, the observed value of response variables was noted and thus % bias was calculated (29).
Surface morphology (SEM)
The surface morphology of floating microspheres was measured by using a scanning electron microscope (SEM). SEM was performed to investigate the morphological feature of optimize NAT loaded floating microspheres (OP-NAT-MPs). Sample of SEM were produced by scattering nanoparticle powder over a double adhesive tape which was adhered onto an aluminium stub. The samples were allowed to be vacuum coated with a gold sputter for 15 minutes. The samples were then placed in micrographic camera and images were taken at 10X magnifications (30).
DSC (Differential Scanning Calorimetry)
DSC (DSC-6000, PerkinElmer, USA) is a thermal analysis device that measures how the physical properties of a sample change with temperature over a period of time. Samples (Pure NAT and OP-NAT-MS) was placed in flat-bottomed aluminium pan and heated at a constant rate of 10°C/min, in an atmosphere of nitrogen in a temperature range of 20-400 °C (31).
FTIR analysis (Chemical Compatibility Analysis)
FTIR spectrographs of pure NAT and OP- NAT-MS were observed whether any chemical interactions were taking place or not.
X-Ray Diffraction (XRD)
X-Ray Diffraction was used to analyze the physical topology of the prepare formulation against the pure drug. The powder crystallinity and amorphization of NAT and OP-NAT-MPs was determined by x-ray diffractometer. The angle of diffraction was used to determine the difference between atomic planes using Bragg's law., sin ?=n ?/2 d where lambda (?) is the wavelength added, theta (?) is the angle of diffraction, and d is the distance between atomic planes. The samples was scanned at a scanning rate of 0-80 degree with a threshold rate of 4
degree/min (32).
In-vitro drug release study
The In-vitro drug release studies of formulations was carried out in PBS (pH 1.2) for 12 h. The drug release rate from floating microspheres was determined using paddle-type eight-station dissolution test apparatus. A weighed amount of floating microspheres equivalent to 100 mg of the drug was kept in PBS (pH 1.2) maintained at 37 0.5 °C at a rotation speed of 50 rpm/min. Sink conditions was maintained during the study. 5 mL sample was withdrawn at 15, 30, 45, 60, 120, 240, 480, 720 min time interval, the initial volume of the dissolution fluid was maintained by adding 5 mL of fresh dissolution fluid after each withdrawal, passed through a 5um membrane filter, and analyzed spectrophotometrically at 204 nm. (33)
Release Kinetics study
The drug release kinetics studied by various kinetic models such as Higuchi plot, first order plot and zero order, Kosermeyer peppas model plot. To study the release kinetics, data was obtained from In-vitro drug release studies were plotted in the above-mentioned kinetic models. First order as log cumulative percentage of drug remaining Vs time, zero order as cumulative amount of drug released Vs time, and Higuchi's model as cumulative percentage of drug released Vs square root of time.(34) The best fit model was confirmed by the value of correlation coefficient (R?) near to the data was presented for the most appropriate model. If n ? 0.45 or less, the release mechanism follows "Fickian diffusion" and if n ? 0.45 ? 0.89 follow a non-fickian model (anomalous transport). The drug release follows Kosermeyer peppas model of drug release and fickian diffusion as the n value was 0.213.(35)
RESULT:
Pre-formulation Studies
Preformulation is a developmental stage that involves characterizing the physiochemical features of the medicinal ingredient. Finding the physiochemical characteristics of the active ingredient in pre-formulation research helps to produce a dosage form that is safe, effective, and stable.
Physical Appearance
NAT was visually observed to be white in colour and crystalline in nature.
Melting Point
Melting point is an important parameter used for drug identification. The observed melting points of NAT were found 128° C-130° C to be in the good agreement with the reported value i.e 129° C-130° C
Absorption maxima (Amax)
The absorption maxima of NAT was found to be 204 m and the reported value was given 207 m depicted in Figure 5.1
Standard curve of NAT in Methanol at ? max 204 mm
Estimation of NAT was done using UV spectrophotometric method and linearity was obtained at lambda max 204 nm with correlation coefficient r? =0.9937, represent linearity range and standard curve of NAT in Methanol respectively.

Figure 1 ? max of NAT using UV Spectrophotometry
Preparation of calibration curve by using UV spectroscopy


Figure 2 Standard Curve of NAT in methanol
FITR Analysis:
Fourier transform infrared spectrum (FTIR) was used for drug identification and excipient compatibility studies. The following locations of nateglinide characteristic bonds were noted in figure 3: 1662.60 cm-1 (-C=O), 1720.89 cm-1 (-COOH), 2971.35 cm-1 (-CH2-cycloalkane), 1282.35 cm-1 (C-O), and 3495.66 cm-1 (-NH). Nateglinide FTIR demonstrates accurate identification because the data match the reference values. Nateglinide FTIR spectrum, however, when compared to ethyl cellulose (fig. 4) revealed the characteristic bonds of the compound at 1647 cm-1 (-C=O), 1717 cm-1 (-COOH), 2858-3072 cm-1 (-CH2-cycloalkane), and 3304 cm-1 (-NH). The outcomes demonstrated that nateglinide and ethyl cellulose did not interact chemically. Analogously, the FTIR spectra if nateglinide together of OP-NAT-MS (fig. 5) revealed the typical peaks of nateglinide at 1645, 1715, 2860, 3063, and 3308 cm-1, hence demonstrating the absence of any interaction between nateglinide and OP-NAT-MS .
Table no 2. Observed peak of functional group


Figure 3 FTIR graph of NAT
Figure 4 FTIR graph of ethyl cellulose
Figure 5 FTIR graph of OP-NAT-MS
Characterization of microspheres:
Size of particle
For F1, F2, F3, F4, FS, F6, F7, and F8, the particle size range was 3.55 um, 2.45 um, 2.96 um, 2.65 um, 3.45 pm, 3.78 um, 4.96 pm, and 3.96 um, in that order. Table 3 presented the results. Particle size rises with increasing concentrations of polymers and stabilizer. This is result of the fact that when the concentration of polymers expands, friction increases, stir efficacy decreases, so the polymers solution's volatility increases as well, increasing the number of particles.
Percentage Yield and Entrapment Efficiency
The floated spheres' percentage yields were discovered to be between 61.31% and 387.71%. It was shown that product yield rose when the concentration of polymers of the mix raised (i.e., the medication to polymer ratios fell). The drug entrapment efficiencies of different formulations were in range of 73.6% - 76.1% w/w The drug entrapment efficiency was somehow decreasing as in microspheres the ethylcellulose content was raised. This resulted from the permeability properties of that during the manufacture of NAT microspheres could percentage yield and Entrapment efficiency is given in Table n
Table 3: Particle size, Percentage yield & Entrapment Efficiency

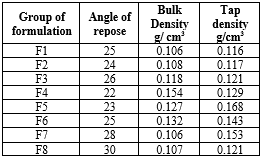
Micromeritic
The micromeritic characteristics were displayed in a table. For every formulation in Table 4, the tapping density values were determined to range in 0.116-0.168 gm/cm' & the values for bulk density were shown to be between 0.106-0.154 gm/cm. The produced formulations exhibited satisfactory flow properties at a degree of repose ranging from 25 to 30.
Table 4: Micromeritic characteristics
Buoyancy Percentage
To replicate stomach fluid, NAT-loaded microspheres were distributed in 0.1 HCl. It was discovered that the floating abilities of various formulations varied depending on the ethylcellulose polymer. The formulations with F1–F4 had the highest floating ability (51.20-39%) after six hours. Table 5 shows the formula F5-F8 formulations was less float ability (37.30-27.60%). Due to the microspheres' hollow spheres, it exhibits exceptional buoyancy, allowing for retention in the upper GIT and an increase in GRT.
Table 5: Buoyancy Percentage

SEM (Scanning Electronic Microscopy) OF OP-NAT-MS
Scanning electron microscopy was used to analyse the morphology of floating microspheres formulations. According to a SEM study, The OP-NAT-MS particles were spherical in nature showed in (Figure 6).


Figure 6 SEM images of A) NAT B) OP-NAT-MS
In vitro Drug Release of OP-NAT-MS
OP-NAT-MS exhibited a controlled release behavior with a drug release of about 70% over 720 minutes, determined via the USP type 2 dissolve device. Nonetheless, NAT. showed a 76 percent release rate over 240 minutes. Because the drug's release was considerably reduced as its concentration for polymers increased, this led to a rise in the amount of ethylcellulose. An extended diffusion route length was the outcome of the polymer's increased density at greater concentrations. This could lessen the total amount of drug released by a polymer matrix; it turned out as the velocity of drug release reduced as the concentration of polymers rose. PVA increases solubilization, which aids in the medication's release from microspheres. According to Figure 7, the curve was drawn between duration and the percent of medication release.

Figure 7 In-vitro drug release of Pure NAT and OP-NAT-MS
Drug Release Kinetics Study of OP-NAT-MS
A range of models, such as zero order, first order, higuchi plot, or Korsmeyer Peppas kinetic models, were applied to in-vitro releasing data (Table 5.11). The largest loss is seen for the Kosermeyer Peppas model (0.9723). Using the Korsmeyer-Peppas equation, the mechanism of drug release was explained. After computation, the mean of slope (n) was found as (0.2194), that is less than 0.45 (n < 0>


CONCLUSION
In order to increase the therapeutic properties, NAT-loaded floating microspheres were developed and assessed in the current study. A factor design worked to efficiently create the chemical evaporating process for the formulation of microspheres. Independent variables Polymer (X1), Stabilizer (X2), and Stirring speed (X3) may all be optimized thanks to the factorial design. Response factors such as particle size (Y1), percentage yield (Y2), entrapment efficiency (Y3), & buoyancy % were employed together to achieve a preparation of microspheres of superior physical characteristics, Micromeritic Properties like angle of repose, bulk density, tapped density and dissolution for drug release and release kinetics were performed. After optimization of formulation by Derringer Desirability Approach, the optimized batch containing polymer (150 mg), stabilizer (1%), stirring speed (1000 rpm) was performed. The formulation exhibited desirable physicochemical properties, including a desirable small particle size, best percentage yield, better drug entrapment efficiency, and showed a good buoyancy percentage and excellent micromeritics properties. In vitro drug release studies exhibit a good release of NAT from the microspheres formulation over a 12 h period, indicating a controlled release of drug for prolonged period of time and moreover the release kinetics of drug release followed kosermeyer peppas model with the value of slope (n) was calculated and found to be (0.2194) which is less than 0.45 (n < 0>
REFERENCES

Preety kumari , Arti kori , Shivanand Patil, Enhancing Biopharmaceutical Attributes Of Nateglinide Through Floating Microsphere Delivery: Development And Evaluation, Int. J. of Pharm. Sci., 2024, Vol 2, Issue 7, 639-654. https://doi.org/10.5281/zenodo.1270269
 10.5281/zenodo.1270269
