School of Pharmaceutical Science, MVN University, Palwal.
Herbal microsphere was prepared by solvent evaporation method using ethyl-cellulose, methylcellulose and dichloromethane. Microspheres were evaluated for SEM, FTIR, entrapment efficiency, swelling index, in vitro drug release. The microspheres of F1 formulation exhibited particle size was 45.35 ?m, entrapment efficiency 86%, and in vitro drug release was 86.30%. A three-factor, three-level Box-Behnken design was applied to the formulation for designing and selecting the optimum formulation. The F1 formulation was found to be the best formulation as it possesses high entrapment efficiency, prolonged drug release for 2 hours in an acidic buffer & 5 hours in an alkaline buffer and this formulation exhibits the sustained release of drug and also improves the bioavailability of drug.
Hyperlipidemia is considered one of the major risk factors causing cardiovascular diseases (CVDs). The world's biggest cause of mortality, cardiovascular disease, could be avoided by addressing behavioral risk factors like smoking, eating poorly, being overweight, and not exercising. Heart and blood vessel illnesses include coronary disease, peripheral arterial disease, and congenital heart disease are included in this group. Cardiac arrest and strokes are typically sudden, severe events that are generally brought on by blockages that stop the blood flow to the heart and brain. Drug therapy is required to lower excessive blood lipid levels, which lowers the risk of heart disease, in order to prevent these diseases. A range of genetic and acquired diseases known collectively as "hyperlipidemia" are defined by elevated lipid levels in the body. It contributes to a number of metabolic risk factors, including hypertension, type II diabetes, gastrointestinal disorders, and coronary artery disease [1]. Elevated cholesterol and triglyceride issues have an effect on the heart and can cause cardiovascular disease, cardiac arrest, and stroke. Changes in lifestyle choices, particularly a malnourished when saturated and cholesterol-rich fat intake surpasses 40% of entire calorie intake, are the primary causes of hyperlipidemia [2]. The risk factors for cardiovascular disease can also be divided into modifiable and non- modifiable. Statins, antihypertensives, and antiplatelet medicines are typical examples of crucial cardiovascular medications [3]. The Frederickson (World Health) classification of dyslipidemias comprised five categories when it was first introduced in the 1960s.
According to a report released in 2020, 4.5 million deaths worldwide were caused by low-density lipoprotein cholesterol [4]. In 2019, there were 4.40 million fatalities and 98.62% million disability-adjusted life years related to elevated plasma LDL cholesterol levels (DALYs). As stated by the survey, ischemic heart disease caused 8.54 million fatalities in 2019, of which 3.78 million were attributable to elevated plasma cholesterol levels, and the ischemic stroke caused 2.73 million deaths, of which 0.61 million were attributable to increased plasma cholesterol levels [5]. In order to overcome these obstacles, a fresh technique has been designed and developed, which can improve the treatment's efficacy. To overcome these difficulties with traditional medicinal molecules, nanotechnology has offered a number of novel techniques, including nanosuspension, nano emulsions, nanoparticles, polymeric nanoparticles, dendrimers, polymeric micelles, etc [6]. Nanosuspension, however, has caught the attention of formulation scientists due to a number of advantages, including improved aqueous solubility, enhanced bioavailability, fast onset of action, reduced dosing regimen, increased dosing frequency, improved drug loading, and ease of preparation to help improve patient compliance overall.
MATERIALS AND METHODS
Materials
Raspberry ketones purchased from Kshipra Biotech pvt. Ltd. (Indore, Madhya Pradesh, India), ethyl cellulose, methyl cellulose, Hydrochloric acid, Disodium hydrogen phosphate, methanol purchased from central drug house pvt. ltd. Dichloromethane purchased from Qualikems lifescience pvt. ltd. Potassium dihydrogen phosphate purchased from Avarice laboratories pvt. ltd. Sodium chloride purchased from Nice chemicals pvt. ltd.
Method
Preformulation studies
Solubility
Accurately weighed 25 mg drug, was dissolving in distilled water for 10 min on vortex shaker. in a volumetric flask of 10ml then filter this solution with filter paper. After that, pipetted out 1ml and dilute it with distilled water up to 10ml. The absorbance of the resultant sample was measured at 223nm [7]
Melting point
Melting point of Model drug was determined by capillary method. Fine powder of the raspberry ketones was filled in a clean and dry capillary of uniform diameter across the length by tapping. The packed column of 4 to 6 mm high capillary was tied in close proximity to tip of laboratory thermometer and the thermometer was kept in the tube of the apparatus then slowly increased temperature of the apparatus and recorded the temperature at which drug completely melted. The melting point was recorded [8].
Drug polymer compatibility studies
Infrared spectrophotometry is an effective analytical method for evaluating the chemical interactions between drugs and excipients in formulations. The sample was powdered and intimately mixed with 10mg of potassium bromide (KBr). The powdered mixture was gathered in a diffuse reflectance sampler and examined using a FTIR spectrophotometer in the 4000- 400/cm wavelength range. The Infrared spectra of the drug was compared to those of the physical combination to find potential drug-excipient interactions [9].
Calibration Curve of Raspberry Ketones
Determination of λ max in 0.1N HCl (pH 1.2)
Raspberry ketones crystal (10mg) was precisely weighed and transferred in a 10ml volumetric flask then dissolved in 1ml of methanol and diluted to 10ml with 0.1N HCl (pH 1.2) to obtain the final concentration of 1000µg/ml. From the 1000µg/ml solution 1ml was pipetted out and was diluted 100ml with 0.1N HCl to obtain the final concentration of 10µg/ml. The maximum wavelength was then found by scanning the λ max in the range of 200–400 nm.
Preparation of calibration curve in 0.1N HCl
Raspberry ketones 10mg precisely weighed and transferred in a volumetric flask of 10ml. It was dissolved in 1ml of methanol and made up the volume with 0.1N HCl (pH 1.2) to get 1000µg/ml solution and then 1ml was pipetted out from 1000µg/ml solution and poured to the volumetric flask of 100ml and diluted with 0.1N HCl to get 10µg/ml solution. To prepare the concentrations of 2, 4, 6, 8, 10ml was pipetted out from the 10µg/ml solution and made up 10ml with 0.1N HCl. The absorbance values of the prepared concentrations were measured at 200-400nm using UV spectrophotometer. The calibration curves were prepared to find out the concentration of Raspberry ketones in samples.
Determination of λ max in phosphate buffer (pH 7.4)
Raspberry ketones crystal (10mg) was correctly weighed and poured in a 10ml volumetric flask then dissolved in 1ml of methanol and diluted to 10ml with phosphate buffer (pH 7.4) to obtain the final concentration of 1000µg/ml. From the 1000µg/ml solution 1ml was pipetted out and was diluted 100ml with Phosphate buffer to obtain the final concentration of 10µg/ml. The maximum wavelength was then found by scanning the λ max in the range of 200–400 nm.
Preparation of calibration curve in phosphate buffer
Raspberry ketones 10mg accurately weighed and transferred in a volumetric flask of 10ml. It was dissolved in 1ml of methanol and made up the volume with Phosphate buffer (pH 7.4) to get 1000µg/ml solution and then 1ml was pipetted out from 1000µg/ml solution and transferred to the volumetric flask of 100ml and diluted with Phosphate buffer to get 10µg/ml solution. To prepare the concentrations of 2, 4, 6, 8, 10ml was pipetted out from the 10µg/ml solution and made up 10ml with phosphate buffer. The absorbance values of the prepared concentrations were measured at 200-400nm using UV spectrophotometer. The calibration curves were prepared to determine the concentration of Raspberry ketones in samples [10].
Preparation of Microspheres:
Solvent evaporation method is one of the most widely used technique for the formulation of microspheres. The film forming polymer Ethyl cellulose (2-6 gm) was taken with 20ml of dichloromethane (organic solvent) and Raspberry ketone added to this solution. The polymer phase was then added to (0.25- 1% w/v) methylcellulose aqueous solution (which was held overnight to make a transparent dispersion). Rotation speed of magnetic stirrer was maintained at rpm (200-400) which helps in complete elimination of dichloromethane. Microspheres were then collected, Filtered, rinsed with distilled water for three times to eliminate the traces of methylene chloride and dried at room temperature for 3-4 hours and then microspheres were placed overnight in a desiccator.
Evaluation Parameters
Percentage Yield
The prepared all formulations of microspheres were dried in a desiccator. The dried microspheres were weighed and their percentage yield was calculating by using the following equation. The actual weight of obtained microspheres was divided by the total quantity of drug and all the polymers that are used for the making of microspheres [11].
Particle Size Analysis
Particle size of 400 dried microspheres from each batch was calculated by microscopic technique to identify the average particle size using an optical microscope [12]. The ocular micro meter was before calibrated by a stage micro meter.
FT-IR Spectroscopy Study of Optimized Formulation
The powdered form of Raspberry ketones was combined to potassium bromide (KBr), mixed homogenously, poured in the sample holder and examined by FTIR spectrophotometer for distinctive peaks in the range of 400-4000cm-1 [13].
Surface Morphological Studies
SEM was used to visualized the surface morphology of microspheres. In SEM, Gold coating was applied to sample using double-sided adhesive tape on brass stub in an ion sputter under vacuum conditions. To prepare the microspheres electrically conductive, a thin coating of gold (3 - 5 nm) was coated for 75 s at 20 KV. A scanning electron microscope was used to examine the morphology of gold-coated microspheres [14].
Entrapment Efficiency
The microspheres containing 50mg of Raspberry ketone were precisely weighed and smashed with the help of using mortar and pestle. The crushed powder was put in a 10ml volumetric flask, and the volume was made up to 10ml by 0.1 N HCl. The drug amount in the filtrate was determined using a UV- spectrophotometer at 200-400nm against a blank [15].
Swelling Index
The swelling index was measured through observing the swelling of microspheres in 100ml phosphate buffer. To achieve equilibrium, 100mg of microspheres were precisely weighed and soaked in phosphate buffer at pH 7.4 for 24 hours. The swollen microspheres were weighed. The following equation below was used to calculate the degree of swelling [16].
In vitro drug release studies of microspheres
Accurately weighed microspheres containing Raspberry ketones equivalent to 200 mg were added in the hard gelatin capsule to avoid the escape of the microspheres from the basket. The formulations were taken for the in vitro drug release studies which was carried out with the help of dissolution apparatus (USP, Type 1 rotating basket type) using simulated conditions by using 900ml of 0.1 N HCl buffer for 2 hrs (gastric emptying time) followed by dissolution in alkaline phosphate buffer for next 5 hrs. The dissolution rates were measured at 37±10 C under 50 rpm speed. 200 mesh size muslin cloth was wrapped over the rotating basket to avoid the escape of raspberry ketone microspheres from the rotating basket. A volume of 5ml sample were collected at regular time intervals replacing with an equal amount of fresh dissolution medium such as acidic buffer and alkaline buffer. After removal of test samples in order to maintain the sink condition throughout the experiment. All samples were taken in a volumetric flask of 10 ml which was filtered. And theses samples were analysed by using a UV- spectrophotometer at 200-400nm against appropriate blank. The concentration of raspberry ketone in sample were calculated from the calibration curve obtained from pure sample of calibration curve obtained from pure sample of calibration curve obtained from pure sample of Raspberry ketone [17].
Stability studies
20 mg drug loaded microspheres (20mg) was transferred in clear glass vials, tightly sealed and stored at controlled temperature, refrigerated conditions. Different temperature conditions were taken, at room temperature (25±20C), Refrigerated conditions maintained up to (5-80C) for a period of 3 months. Following parameters were analysed such as drug release, entrapment efficiency and swelling index of optimized formulations [18].
RESULT AND DISCUSSION
Pre-formulation studies
The following studies were performed for model drug.
Solubility
It is soluble in water
Melting point
The melting point of obtained drug sample was found to be 83ºC.
FT-IR Spectroscopy
The FT-IR spectrum of the pure drug was found to be similar to the standard spectrum of raspberry ketone. The spectrum of Raspberry ketone showed the following functional groups at their frequencies.

Figure 1: FT-IR spectrum of Raspberry ketone
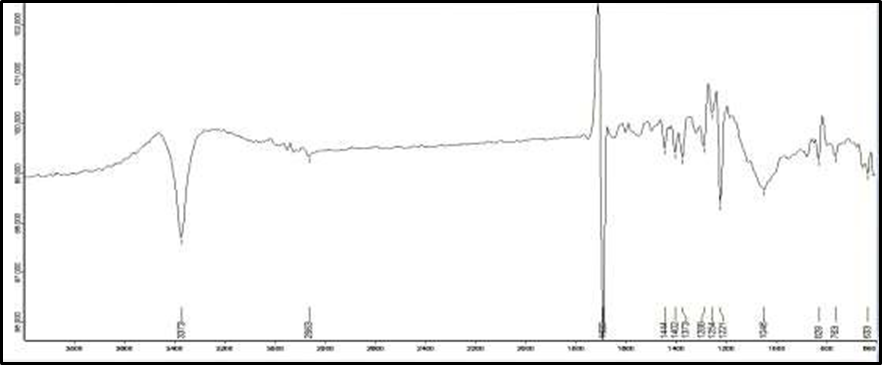
Figure 2: FTIR spectrum of drug physical mixture
Formulation of Microspheres
Table 1: Composition of different formulations
|
Formulation code |
Factor 1 |
Factor 2 |
Factor 3 |
Response 1 |
Response 2 |
Response 3 |
|
A: Ethyl cellulose gm |
B: Methylcellulose %w/v |
C: Stirring speed rpm |
Particle size μm |
Entrapment efficiency % |
Drug release % |
|
|
F1 |
6 |
0.625 |
400 |
45.35 |
86.54 |
86.30 |
|
F2 |
4 |
1 |
200 |
33.21 |
75.71 |
68.00 |
|
F3 |
6 |
0.625 |
200 |
43.16 |
80.21 |
80.31 |
|
F4 |
4 |
0.625 |
300 |
37.24 |
71.11 |
67.50 |
|
F5 |
4 |
1 |
400 |
34.12 |
68.23 |
57.36 |
|
F6 |
4 |
0.625 |
300 |
33.82 |
76.31 |
72.99 |
|
F7 |
4 |
0.625 |
300 |
36.19 |
70.21 |
70.83 |
|
F8 |
2 |
0.25 |
300 |
30.19 |
59.45 |
52.86 |
|
F9 |
4 |
0.625 |
300 |
38.32 |
77.65 |
73.33 |
|
F10 |
4 |
0.25 |
400 |
33.67 |
69.57 |
70.17 |
|
F11 |
2 |
0.625 |
200 |
35.69 |
61.78 |
57.36 |
|
F12 |
4 |
0.625 |
300 |
42.38 |
72.78 |
60.18 |
|
F13 |
6 |
1 |
300 |
44.19 |
82.67 |
81.81 |
|
F14 |
2 |
1 |
300 |
31.42 |
65.21 |
65.34 |
|
F15 |
6 |
0.25 |
300 |
40.23 |
84.34 |
80.65 |
|
F16 |
2 |
0.625 |
400 |
34.24 |
62.11 |
54.03 |
|
F17 |
4 |
0.25 |
200 |
38.47 |
78.89 |
77.32 |
Spectroscopic Studies
The size of microspheres was determined using microscope fitted with an ocular micrometer and stage micrometer. The SEM was used to visualised the surface morphology of the optimised raspberry ketone microspheres. The SEM images indicate the free flowing, identical and circular microsphere [19]. The surface of the microspheres smooth, it existed on the microsphere surface. It is attributed that with increase the polymer concentration that increase the particle size with smooth surface of microspheres was noticed.

Figure 3: SEM images of microspheres of F1 formulation
Percentage yield (%)
The microspheres were weighed and evaluating their percentage yield and it was discovered that the percentage yield rises with increase in concentration of polymers. The % yield was found (16.12- 31.34%). It was shown that as the concentration of polymers rises, the percentage yield of microspheres automatically increased. The percentage yield of F1 formulation increases due to greater concentration of polymers whereas the % yield of F8 formulation decreases due to lesser concentration of polymers.
Table 2: Percentage yield of different formulations
|
Formulation Code |
Percentage Yield |
|
F1 |
31.34 |
|
F2 |
28.41 |
|
F3 |
30.06 |
|
F4 |
22.36 |
|
F5 |
25.21 |
|
F6 |
22.57 |
|
F7 |
20.87 |
|
F8 |
18.45 |
|
F9 |
19.67 |
|
F10 |
26.43 |
|
F11 |
16.12 |
|
F12 |
22.05 |
|
F13 |
25.32 |
|
F14 |
17.44 |
|
F15 |
29.69 |
|
F16 |
18.38 |
|
F17 |
27.21 |
Entrapment efficiency
The quantity of drug entrapped in formulations was determined at 217nm. The entrapment study indicates that, with increase in polymer concentration the drug loading capacity of microspheres was raised. The microspheres formulation F1 are with higher concentration of polymer Ethyl cellulose produced the greater concentration of drug entrapment efficiency and was found to be 86.54 whereas the entrapment efficiency of formulation F8 with low concentration of polymers was found to be 59.45. The amount drug loaded into polymeric network depends upon following parameters such as drug solubility in initial solution and cross linking between polymers and solution [20].
Swelling Index
microspheres were introduced to alkaline buffer up to 7 hrs. Many other causes that can influence the drug release from the microspheres involve the size of the Swelling studies indicates that the quantity of polymers plays a major role in solvent transfer. It was also noticed that increase in polymer concentration, the swelling index was also increased. The swelling index of optimized microspheres was found to be 2255 ± 1.6% in swelling media, 0.1N HCl (pH- 1.2).
In-vitro drug release studies
Using a Type II dissolving apparatus, the in vitro drug release tests were conducted for two hours in an acidic buffer and 5 hours in an alkaline buffer. Observed information from the study indicates both phases drug release of microspheres. At initial stage drug release was noticed in the first 2 hours in acidic buffer, after this a period of sustained release was detect when microsphere, type of polymer, physical state of drug in the polymer and its morphology [21].
Table 3: In vitro drug release studies of optimized formulation
|
Cumulative drug release (%) ± SD (n=3) |
||
|
Time (min) |
Optimized formulation (F1) |
Pure drug (RK) |
|
0 |
0 |
0 |
|
15 |
19.27±1.57 |
12.82±0.38 |
|
30 |
21.79±1.65 |
15.91±0.47 |
|
60 |
23.76±1.71 |
19.83±0.59 |
|
90 |
26.84±1.79 |
27.96±0.83 |
|
120 |
36.37±1.81 |
32.73±0.98 |
|
180 |
55.69±1.67 |
|
|
240 |
63.01±1.89 |
|
|
300 |
71.50±2.14 |
|
|
360 |
76.65±2.29 |
|
|
420 |
86.30±2.58 |
|

Figure 4: In vitro Drug Release studies of optimized formulation
Stability studies
20 mg drug loaded microspheres (20mg) was transferred in clear glass vials, tightly sealed and stored at controlled temperature, refrigerated conditions. Different temperature conditions were taken, at room temperature (25±20C), Refrigerated conditions maintained up to (5±80C) for a period of 3 months. Following parameters were analysed such as drug release, entrapment efficiency and swelling index of optimized formulations.
Table 4: Stability studies
|
Parameters |
At room temperature (25±20C) |
At refrigerated conditions (5±80C) |
||||
|
1 month |
2 months |
3 months |
1 month |
2 months |
3 months |
|
|
Drug release (%) |
73.80±1.6 |
73.76± 2.1 |
73.74±1.2 |
79.68±1.6 |
81.58±1.64 |
83.09±1.66 |
|
Entrapment efficiency (EE %) |
71.71±1.2 |
71.68±1.4 |
71.65±1.6 |
62.53±1.22 |
59.86±1.20 |
57.41±1.17 |
|
Swelling index |
2255±119.4 |
2248±117.5 |
2241±115.6 |
1657±87.6 |
1645±85.8 |
1545±81.4 |
CONCLUSION
Microspheres prepared by solvent evaporation technique using anti- hyperlipidemic agent i.e. raspberry ketone shows controlled release behaviour. The percentage yields were observed to be 16.12-31.34%. It was discovered that the percentage yield of the microspheres increased because the higher concentration of polymers. The particle size of F1 formulation was observed to be 45.35 μm and the microspheres were spherical in shape. It is also observed that the particle size of microspheres increased with increased in concentration of polymers. Surface morphological studies also optimized microspheres F1 was visualized by Scanning electron microscopy (SEM). Scanning electron microscopy reveals that microspheres are spherical in shape. Ethyl cellulose acts as a matrix material it is utilized because of its film forming abilities. The entrapment efficiency also done of microspheres which is discovered to be 86.54% (F1). The swelling index of optimized microspheres was observed to be 2255±1.6% in swelling media, 0.1N HCl. The in vitro studies indicates that there was a slow and extended release of drug in formulations was depend upon lower and higher concentration of polymers. Stability studies of optimized formulation (F1) were done for 3 months, at room temperature (25±20C) and refrigerated conditions maintained up to (5±80C). It was observed that there is no effect on formulation at room temp. for 3 months. Whereas at refrigerated conditions entrapment efficiency decreases, drug was too slow and swelling index also decreases. It was determined that formulation was stable at room temperature. It was discovered that formulation F1 is the best formulation.
REFERENCE

Manju Vashisth, Geeta Mahlawat, Ashutosh Upadhayay, Yogendra Singh, Yogesh Vashsith, Formulation and Evaluation of Herbal Microspheres for Antihyperlipidemic Activity, Int. J. of Pharm. Sci., 2025, Vol 3, Issue 11, 4298-3308. https://doi.org/10.5281/zenodo.17731301
 10.5281/zenodo.17731301
