Abstract
In the present paper, simple physicochemical parameter such as Density measurement, Moisture content, Boiling point determination, saponification number, Peroxide value, acid value, Iodine value of different edible oils have been reported for determine the quality and help to describe the present condition of edible oils. Also reported laboratory or chemical test such as Sodium azide test, Modified nitric acid test, Azo dye test, Modified baudouin test, Hexabromide test, Halphens colour test and Molybdate test are performed for detection of adulterant in edible oils. These tests are performed for detection of Artificial mustard oil, Argemone oil, Ricebran oil, Sesame oil, Linseed oil, Cottonseed oil & Castor oil as adulterant in edible oils. This review is aimed to provide an overview of edible oil detection techniques and overview of physicochemical parameter for detection of quality of edible oils. Adulteration of edible oils is increased day by day throughout the world at greater extent. Hence these review to identify different suitable rapid detection techniques for ensuring food quality and safety. Lipid oxidation has harmful effects on both food quality and human health. Then efforts must be made to minimize oxidation and improve oxidative stability of lipid products. The study was designed on the basis of literature review for collecting relevant scientific evidence from various sources. Various techniques have been utilized to assess the purity of edible oils but yet they are costly and time-consuming.
Keywords
Halphens test, Molybdate method, Argemone, Sodium azide test, Cyclopropenic acids, Diazotization, Sanguinarine.
Introduction
However, development of novel compounds with similar behaviour but with a better therapeutic action has posed a serious challenge to researchers. Therefore, discovering of new novel drugs is of great importance in combating health problems and improving the quality of human life. P-glycoprotein 1 (P-gp or MDR1) is a cell membrane protein that acts as an ATP-dependent efflux pump, expelling foreign substances from cells. It is found in animals, fungi, and bacteria, likely evolving as a defence mechanism. Discovered in 1971 by Victor Ling, P-gp is present not only in tumour cells but also in various normal tissues, particularly those with excretory functions and at blood–tissue barriers [1, 2]. P-gp is expressed in different regions of the body, including the brain, kidneys, liver, gastrointestinal tract, testis and placenta. P-gp is an essential component of the blood brain barrier (BBB) and is expressed on the apical surface of capillary endothelial cells, restricting the entry of foreign toxic substances into the brain [3]. P-glycoprotein (P-gp) inhibitors are drugs that enhance the concentration of P-gp substrate drugs in the serum by blocking their expulsion from tissues like the brain. These inhibitors improve brain-targeted drug delivery and boost chemotherapy by reversing multidrug resistance. Examples include itraconazole, Verapamil, and ketoconazole. Natural, low-cost P-gp inhibitors like piperine, curcumin, and quercetin act as bioenhancers, increasing drug permeability and bioavailability. Bioenhancers are substances that improve the bioavailability and efficacy of active drugs, vitamins, or nutrients without having pharmacological effects at their administered doses [4]. By enhancing bioavailability, they raise the levels of drugs in the bloodstream, making them more effective. Bioenhancers can improve the effectiveness of various substances, including allopathic drugs and nutraceuticals, by increasing their absorption or through other mechanisms. [4-8]. Bioenhancers are non-toxic, easy to formulate, effective at low doses, non-irritating, stable, accessible, and low-cost. They reduce drug costs, toxicity, and improve drug delivery, including across the blood-brain barrier. Bioenhancers can increase drug bioavailability by altering P-glycoprotein (P-gp) activity, preventing drug expulsion from cells. They work by enhancing blood supply, inhibiting drug metabolism, reducing reabsorption, and improving membrane permeability. Bioenhancers are classified by origin (e.g., Ginger, Turmeric) and mechanism (e.g., Quercetin, Liquorice) [4, 5, 9].
MATERIALS AND METHODS:
Materials:
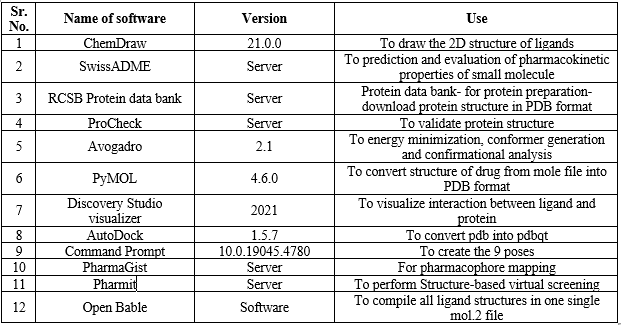
The softwares which are used in the molecular docking, pharmacophore mapping and virtual screening are as follows:
Table 1: Softwares used
Methods:
In the quest of new potent human p-glycoprotein modulators, a series of compounds were screened through the process of molecular docking followed by pharmacophore mapping and virtual screening as a computational tool. Docking of natural (Piperine, Curcumin, Quercetin) as well as synthetic (Verapamil) P-gp inhibitors and P-gp substrate (Berberine chloride) against human P-gp (PDB code: 6C0V) was performed and binding energies were determined. This was followed by pharmacophore mapping and virtual screening.
Steps involved in current study are as follows:
A. Steps involved in docking studies:
1. Preparation of ligand:
a. 2D structure of ligand:
ChemDraw 21.0.0 software was used to draw the 2D structure of ligand and saved in the folder as MDL Molfile (*.mol). The structure of ligand can be downloaded from the PubChem server https://pubchem.ncbi.nlm.nih.gov
b. 3D structure of ligand:
Chem 3D ultra 8.0 software was used to convert 2D structures of ligand into its 3D structures.
c. Energy minimization of ligand & conformational analysis:
The energy minimization of ligand is carried out by using Avogadro 2.1 software for the conformer generation and confirmational analysis. Open the ligand in the folder and select the extensions in tool bar and select the optimize geometry until to stop the movement of ligand and then it saved as a ligand and replace the previous ligand.
d. Conversion of ligand mol format into pdb format:
PyMOL 4.6.0 software was used for conversion of mol format to pdb format. The ligand molecule was open into the software and go to File option > Choose Export molecule > Change enable option to particular ligand name > Save the file in PDB (.*pdb. *pdb. gz).
2. Preparation of protein:
a. Identification and selection of target protein:
Protein receptors (PDF) downloaded from the server Protein Data Bank (https://www.rcsb.org/). The protein obtained was downloaded and stored in the .pdb format. RCSB Protein data bank was used for identification and selection of target protein.
- Disease causing protein was identified through literature.
- Firstly, downloaded the particular protein from RCSB (Research Collaboratory for Structural Bioinformatics) server i.e., protein data bank from google chrome.
- Desired protein code obtained from literature study was searched.
Conditions for selection of protein were as follows:
- Protein must be from the source of organism is Homo sapiens.
- Experimental Method must be X-ray diffraction.
- Refinement Resolution (Å) must be less than 2.5Aº.
Protein molecule structure was retrieved in .pdb format.
b. Validation of selected protein:
ProCheck Server was used for the validation of protein. Protein was validated using Ramchandran plot obtained from ProCheck server. Downloaded protein from RCSB PDB was selected for validation. Obtained Ramchandran plot was analyzed for allowed and disallowed regions. The protein was finalized only if disallowed region was zero. The Ramchandran plot was downloaded.
c. Preparation of protein for docking (Biovia Discovery Studio visualizer 2021):
The overall protein molecule preparations were rendered through Biovia Discovery Studio Visualizer. Discovery Studio visualizer 2021. Open the file and select the protein i.e. in the pdb format and press the ctrl+h and delete the heteroatom and water. Add the polar hydrogen in the showing chemistry on tool bar. Right click on the protein and copy the attributes of x, y, z and paste in config which is present in the folder and then it is save in the file. Then go to display style and select the 6th no. picture two times and save as protein in type protein data bank file.
3. Conversion of both protein and ligand pdb format into pdbqt format:
AutoDock 1.5.7 software was used for the conversion of both protein and ligand pdb format into pdbqt format. File > Read molecule > select the protein pdb format > Ok > Grid > Macromolecule > Choose > select protein > Save as pdbqt in the folder. Ligand > Input > Open > select the ligand pdb format > Ok > Ligand > Output > Save as pdbqt in the folder.
- Generation of 9 poses:
Command Prompt 10.0.19045.4780 was used for the generation of 9 poses. The command files are copy and paste one by one and then create the 9 poses and also showing the docking score.
- Visualization of 2D structure of receptor-ligand interaction:
Drag and drop the protein pdbqt and 9 poses generated in the command Prompt. Click on the option ‘Receptor-ligand interaction’ on the ribbon. Click on the ligand which is selected from protein window and click on undefined which is in ‘Receptor-ligand interaction tree view’ and ligand is defined. From ‘Receptor-ligand interaction tree view’ various ligand interactions, hydrogen bond, ionizability charge, surface area etc. are visualized.
To generate data table: -
- Click on the view button and select data table option.
- The data table is generated below the protein window.
- Select option of non-bond and reading are display on the screen.
To visualized 2D structure: -
Select option ‘Show 2D diagrams’ and 2D diagram was visualized.
To save data and image file: -
For particular data and taken a screenshot of image and saved it [11,12].
B. Pharmacophore mapping:
Mapping of pharmacophoric features and development of pharmacophore:
A key objective in rational drug design is predicting molecular interactions. One important approach to achieving this is the pharmacophore model, which represents the spatial arrangement of features critical for a molecule's interaction with a specific target receptor. We used PharmaGist, a free web server designed for pharmacophore detection. This method is ligand-based, meaning it does not require the target receptor's structure. Instead, it uses the structures of drug-like molecules known to bind to the receptor as input. The output is a set of candidate pharmacophores, generated through multiple flexible alignments of the input ligands. Pharmacophore models can be used to identify novel ligands that will bind to the same receptor through de-novo design or virtual screening. A chemical framework that has the structural characteristics of a known active molecule is called a pharmacophore. A pharmacophore model is created using an active compound's structural characteristics, and it is subsequently used to filter, assess, and screen molecular databases. Hydrophobic centroids, aromatic rings, hydrogen bond donor or acceptor, cations and anions are examples of pharmacophore features of a drug. For pharmacophore mapping webserver PharmaGist has been used Using the publicly available web server PharmaGist (http://bioinfo3d.cs.tau.ac.il/PharmaGist/php.php), pharmacophore models for the five structures berberine chloride (P-gp substrate), verapamil (synthetic bioenhancer), curcumin, quercetin, and piperine (natural bioenhancers) were generated. These structures share common pharmacophoric characteristics In this process, input set of structures into single mol.2 file format using Open Bable software. Open Babel software was used to compile all ligand structures in one single mol.2 file. In this we merge all ligands together and save as mol.2 format file on desktop.
Open PharmaGist webserver http://bioinfo3d.cs.tau.ac.il/PharmaGist. …….. Click on the capta for I am not robot……. Go to server…..PharmaGist……Choose file from desktop in mol.2 format (merged file)….Select no. of output pharmacophore 2-20…..Provide email id ……Submit ….We will get result by mail…..Open pharmacophore results …..Click on the link received on mail….Got result….Sort by score…..Choose and save molecule on highest score…View best pairwise alignment…..Save result file. Open PyMOL…. Drag and drop saved result file…… it will give pharmacophore triangle…..Right click on all 3 points of triangle…..Lable….. Atom name….. ACC….Click wizard tab….measurement….it gives distances….Click on all points…. Superimpose all 4 structures of ligands on triangle by clicking on right side bottom tab…. Save the data virtual screening, four essential ligand properties are hydrophobicity, aromaticity, hydrogen bond donors, and acceptors were selected. The hit screening parameters were established by taking into account the following criteria: a logP (octanol-water partition coefficient) value of ? 5, molecular weight ? 500, hydrogen bond donors ? 5, hydrogen bond acceptors ? 10, and Veber's filter, which includes rotatable bonds ? 10, aromatics ? 2, and total polar surface area (TPSA) ? 140 Å [13].
C. Pharmacophore based virtual screening:
Using the Pharmit server, the optimal pharmacophore model was used. A set of many molecules are included in the query results; the best 10 molecules with the lowest RMSD value were then used for structure-based virtual screening. The procedure of superimposition of molecules against the pharmacophore to reduce the RMSD between the hit compounds and the requested properties produced the molecules that were ultimately obtained [14]. Go to Pharmit webserver….Click enter Pharmit search….Click load features….Upload saved file from PharmaGist results having highest score……Click on search molport……Molport window opens…..Pharmacophore results opens…Click on molecule having lowest value of RMSD (0.01)….Selected 10 molecules…..It gives structures and other properties of molecule…. Save it.
D. Prediction of druglike property and molecular docking:
The best 10 molecules (screened compounds) having lowest RMSD values were selected and studied the drug likeness properties by using Swiss ADME server and docking of these molecules were carried out as per procedure. Analysis of the properties of drug likeliness was done via online server i.e. SwissADME. The ligands screened were analyzed for their property on drugs. The ligand molecule was uploaded on Swiss ADME server > Click on double arrow which is in red > Click on run > Information is displayed. Drugs for the five-fold Lipinski law were analyzed. Lipinski rule of five states the following points: -
-
- Hydrogen bond donors should be less than 5.
- Hydrogen bond acceptors should be less than 10.
- The molecular weight should be less than 500 Dalton.
- Partition coefficient LogP should be less than 5.
- Not more than 1 rule can be violated.
The ligands which followed the above Lipinski rule of five were selected for final docking through AutoDock and Biovia Discovery Studio visualizer 2021 [10].
RESULTS AND DISCUSSION:
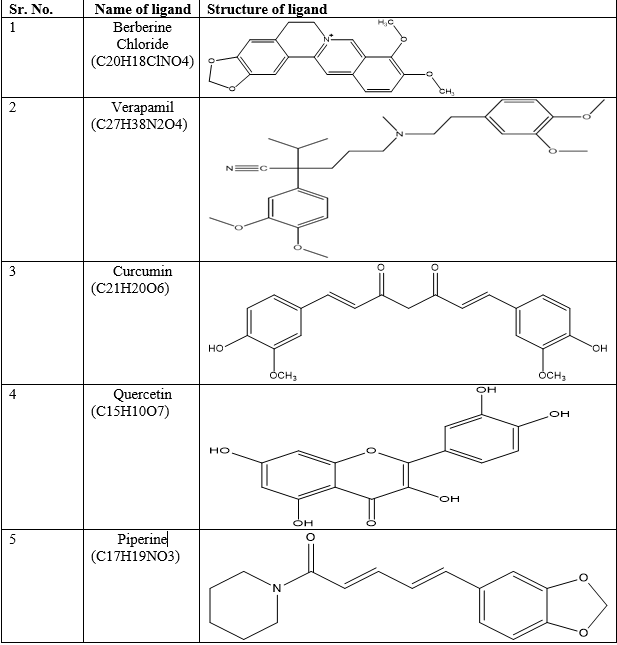
The structures along with molecular formula of P-gp substrate (Berberine chloride), synthetic (Verapamil), as well as natural (Piperine, Curcumin, Quercetin) P-gp inhibitors are shown in Table 2.
Table 2: Structure and its molecular formula of ligands
The 3D structure of 6C0V in pdb format was retrieved from Protein Data Bank as shown in Figure 1. The resolution of protein was 3.40 A0. The stability of protein was analyzed through Ramchandran plot as shown in Figure 2
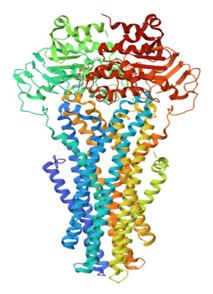
Figure 1: 3D Structure of 6C0V

Figure 2: Ramachandran Plot of Protein Molecule (6C0V)
Table 3: Ramachandran Plot statistic
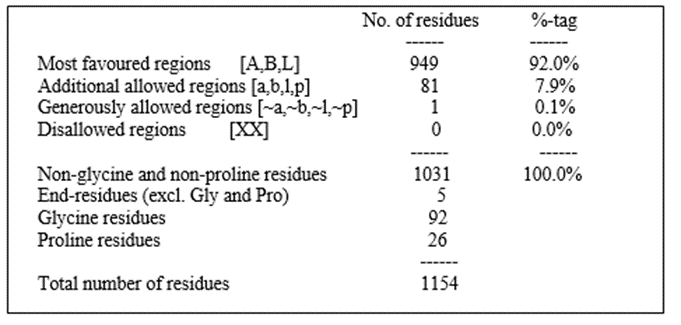
In the Ramachandran Plot Statistics, the no. of residues and its percentage are more in most favoured region and zero in the disallowed region. Hence, selected protein has been validated. After molecular docking of P-Gp substrate, natural and ynthetic bioenhancers the 2D and 3D structures of docking interactions of ligand molecules with protein 6C0V along with docking score were shown in the table 4.
Table 4: Binding energy of ligands with 2D and 3D structures
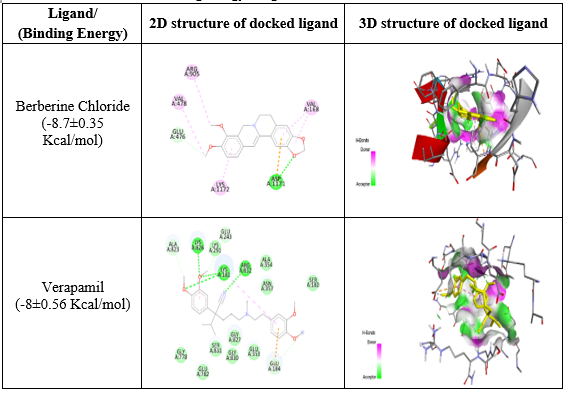
The binding energy of P-gp substrate (Berberine chloride) was found to be -8.7 ± 0.35 Kcal/mol, for synthetic P-gp inhibitor (Verapamil) -8.0 ± 0.56 Kcal/mol, and for natural P-gp inhibitors (Piperine, Curcumin, Quercetin) -8.3 ± 0.33 Kcal/mol, -9.1 ± 0.26 Kcal/mol, -8.5 ± 0.05 Kcal/mol respectively.
Pharmacophore Mapping and virtual screening:
In the Pharmacophore mapping, the pharmacophore plot was generated by using PharmaGist webserver and it having the common Pharmacophoric features. The pharmacophore plot was shown in Figure 3.

Figure 3: Pharmacophore plot
In the Pharmacophore plot, the triangle was shown along with their distances between active functional groups having 10.8 A0, 2.3 A0 and 11.2 A0. The following Figure 4 shows the overlapping of P-gp inhibitors on Pharmacophore plot.
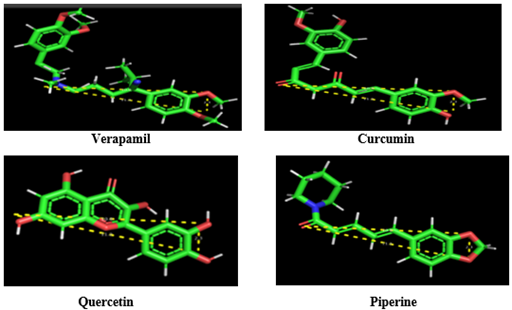
Figure 4: Overlapping of P-gp inhibitors on Pharmacophore plot
The results of pharmacophore plot obtained from the Pharmit server. In that, the best 10 molecules with the lowest RMSD value were used for structure-based virtual screening. The Pharmacophore plot result was shown in Figure 5.
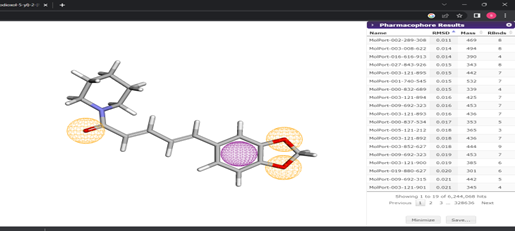
Figure 5: Pharmacophore plot results
Based on the computational analysis, a total of 10 new potent p-gp inhibitor molecules were selected and tested further for their inhibitory potential against human P-gp by molecular docking. The results of molecular docking of 10 selected screened molecules after pharmacophore mapping along with docking score were shown in the table 5.
Table 5: Binding energy of virtually screened compounds with 2D and 3D structures
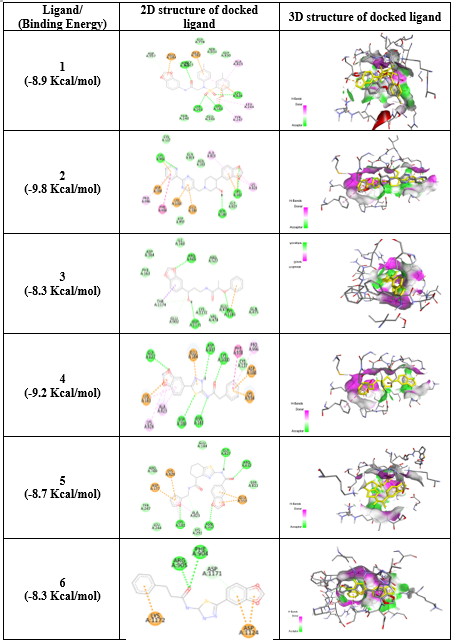
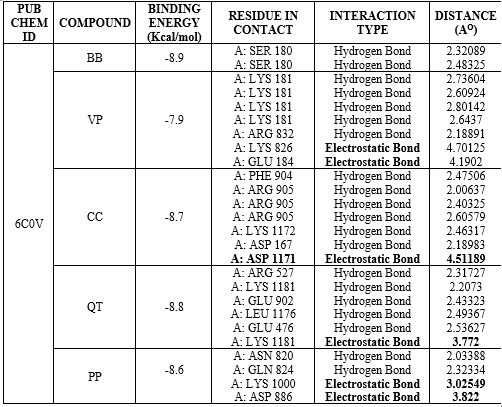
The binding energy of screened compounds ranging from -7.5 Kcal/mol to -9.8 Kcal/mol and the maximum binding energy was found to be -10.3 Kcal/mol. So, it was observed that, all these screened molecules showed good docking score with the target protein. Virtually screened molecules exhibit better binding interactions with human P-gp (docking score -10.3) compared to already reported P-gp inhibitors (docking score -8.0). Hydrogen bonding is one of key interactions that can contribute significantly to binding interactions. Electrostatic bonds were also observed in few interactions. Table 6 shows binding energy, residue in contact, type of bonding interactions along with distance for all docked molecules.
Table 6: Data Table of docking Interactions
Drug Likeliness Properties:
The screened molecules were analysed for drug likeliness properties by using SwissADME online web server. Further the ligands were screened on the basis of qualifying Lipinski Rule of five. The ligands were analysed for its Molecular weight, Hydrogen bond donor, Hydrogen bond acceptor, Partition coefficient and Lipinski rule, violation, etc. as shown in Table 7.
CONCLUSION:
Use of bioenhancer is an immediate medical need to enhance permeability as well as bioavailability for many drug molecules. This can be achieved with the use of newer potent bioenhancers having p-gp inhibitory activity. Overall, study proposed, 10 molecules have strong binding efficiency against human P-gp in comparison to most commonly used bioenhancers, thus may be used as putative bioenhancer in therapy. The present study needs further experimental validation to be used as a bioenhancers.
ACKNOWLEDGEMENTS:
Authors are thankful to Principal, Dr. Shivajirao Kadam College of Pharmacy, Kasabe Digraj, Sangli, Maharashtra, India for providing laboratory facilities and constant encouragement.
CONFLICT OF INTEREST
The author(s) declare(s) that they have no declaration of interests to disclose.
REFERENCE
- Ueda K, Clark DP, Chen CJ, Roninson IB, Gottesman MM, Pastan I. The human multidrug resistance (mdr1) gene. cDNA cloning and transcription initiation. Journal of Biological Chemistry. 1987 Jan 15;262(2):505-8.
- Fromm MF. Importance of P-glycoprotein at blood–tissue barriers. Trends in pharmacological sciences. 2004 Aug 1;25(8):423-9.
- Juvale II, Hamid AA, Abd Halim KB, Has AT. P-glycoprotein: New insights into structure, physiological function, regulation and alterations in disease. Heliyon. 2022 Jun 1;8(6). Randhawa GK, Kullar JS. Bioenhancers from mother nature and their applicability in modern medicine. International journal of applied and basic medical research. 2011 Jan 1;1(1):5-10.
- Narade SB, Pore YV, Optimization of ex vivo permeability characteristics of berberine in presence of quercetin using 32 full factorial design. Journal of Applied Pharmaceutical Science 2019; 9 (1):073-082.
- Narade SB, Pore YV, Effect of co-administration of quercetin on goat intestinal permeability of berberine chloride. Int J Pharma Sci Res. 2019; 10 (8):3915-3919.
- Narade SB, Pore YV, Assessment of permeability behavior of berberine chloride across goat intestinal membrane in presence of natural biopotentiator curcumin. Indian Drugs 2021; 58 (4): 23-27.
- Narade SB, Pore YV. Optimization of goat intestinal permeability of berberine chloride in presence of natural bioenhancer piperine using 32 full factorial design. International Journal of Biology, Pharmacy and Allied Sciences. 2022, 11(10): 4758-4778.
- Narade SB, Pore YV. Pharmacokinetic assessment of Natural Anticancer Berberine Chloride in presence and absence of some Herbal Bioenhancers in rabbit model. Research J. Pharm. and Tech. 2023; 16(11):5121-5129.
- Chivte VK, Tiwari SV, Nikalge AP. Bioenhancers: A brief review. Adv J Pharm Life Sci Res. 2017;2: 1-8.
- Parween A, Singh PK, Anamika Y, Khare N, Rai NP, Bajpai M, Jha AK. Molecular docking of quinolone against INHA to treat tuberculosis. Int J Res Appl Sci Eng Technol. 2020;8(6):2421-7.
- Priyanka P, Preeti K, Chandrakant M. Structure based virtual screening, molecular docking and brine shrimp bioassay of 1,3,4 oxadiazole derivatives as potent inhibitors of VEGFR. Adv. Biores. Vol 14 [1] January 2023. 208-220.
- Priyanka A. Patil, Preeti Khulbe, Ashwini C. Utage, Gayatri S. Jagtap. Pyridine containing 1,2,4 triazole derivatives as a potent inhibitor of JNK pathway for prevention of tumorigenesis in breast and hepatocellular. European Chemical Bulletin.2022,11. (Issue 10), 243-252.
- Oduselu GO, Afolabi R, Ademuwagun I, Vaughan A, Adebiyi E. Structure-based pharmacophore modeling, virtual screening, and molecular dynamics simulation studies for identification of Plasmodium falciparum 5-aminolevulinate synthase inhibitors. Front Med (Lausanne). 2023 Jan 12; 9:1022429. doi: 10.3389/fmed.2022.1022429. PMID: 36714108; PMCID: PMC9877529
- Devi, B., Vasishta, S.S., Das, B. et al. Integrated use of ligand and structure-based virtual screening, molecular dynamics, free energy calculation and ADME prediction for the identification of potential PTP1B inhibitors. Mol Divers 28, 649–669 (2024). https://doi.org/10.1007/s11030-023-10608-8.


 Sarika Pranam Patil*
 Sanskruti Rajesh More
 Monali Sanjay Thorat
 Anuja Atul Masule


 10.5281/zenodo.13895988