
We use cookies to ensure our website works properly and to personalise your experience. Cookies policy
1Department of Chemistry, Government Degree College Banaganapalli, Nandyal-AP.
2Department of Chemistry, Silver Jubilee Government College, Kurnool-AP.
3Department of Chemistry, KVR Government College for Women, Kurnool-AP.
A simple and sensitive visible spectrophotometric method has been developed for the estimation of lamivudine in pharmaceutical preparations. The method is based on the reaction of lamivudine with 2, 3-dichloro-5, 6-dicyano-1, 4-benzquinone to form an red colour charge–transfer complex. The red coloured solution was measured at 450 nm against reagent blank. Lamivudine obeys Beer’s law in the concentration range of 20-100 ?g/ml.
Lamivudine (2’-deoxy-3’-thiacytidine: 3TC) is a pyrimidine analog reverse transcriptase inhibitor that is active against HIV-1, HIV-2, and HBV. The molecule has two chiral centers and is manufactured as the pure 2R, cis (-)-enantiomer. The racemic mixture from which lamivudine originates has antiretroviral activity but it has less potency and is substantially more toxic than the pure (-)-enantiomer. Compared with the (+)-enantiomer, the phosphorylated (-)-enantiomer is more resistant to cleavage from nascent RNA/DNA duplexes by cellular 3'-5' exonucleases, which may contribute to its greater potency. Lamivudine has been used for treatment of chronic hepatitis B at a lower dose than for treatment of HIV. It also used with other medications to help control your HIV infection. Various Spectrophotometric1-11 methods, Titrimetric and Spectrophotometric methods12, 13, Simultaneous Spectrophotometric estimation of Lamivudine14-20, RP-HPLC and ultraviolet spectrophotometric method21, RP-HPLC method21,22, HPLC method22-27 and HPTL method28 has been reported in the literature for the estimation of lamivudine pharmaceutical formulations. In the present work lamivudine react with 2, 3-dichloro-5, 6-dicyano-1, 4-benzquinone to form an red colour charge–transfer complex. The reaction sequence of lamivudine is shown in scheme.1.
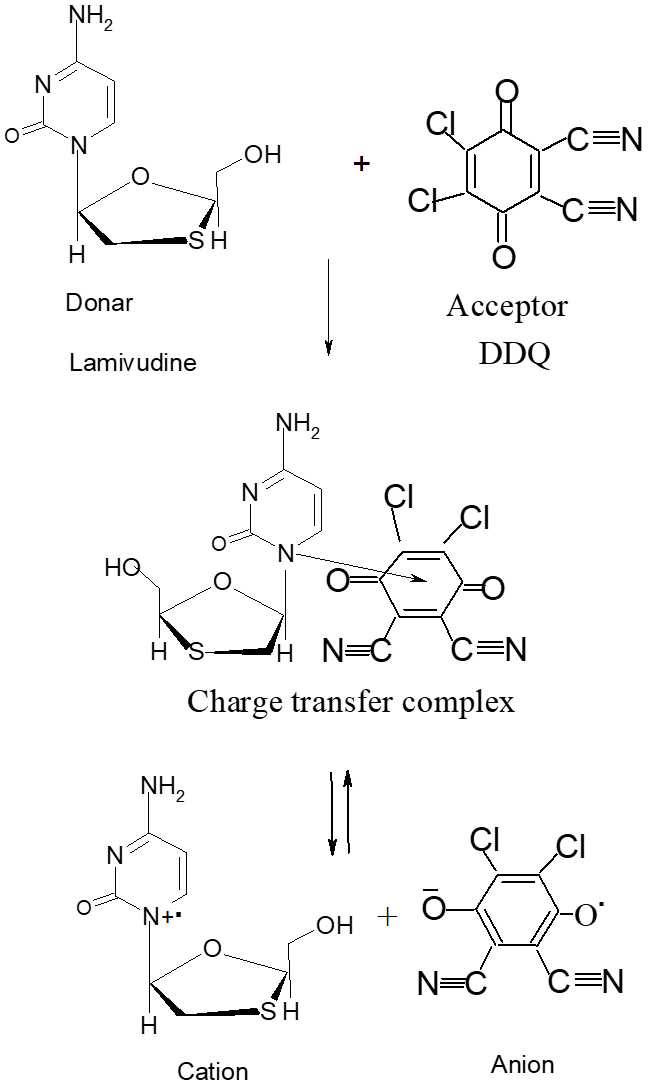
Scheme:1 Reaction Sequence of Charge Transfer Complex of Lamivudine
MATERIALS AND METHODS
Instrumentation
Spectronic 1000 plus UV Visible Spectrophotometer with 1 cm matched quartz cells was used for all spectral and absorbance measurements. AR grade chemicals are used for preparation of reagents and solutions in the present investigations
2,3-dichloro 5,6-dicyano-p-benzoquinone(0.1%w/v): 2,3-dichloro 5,6-dicyano-p-benzoquinone (Loba Chem., India) solution is prepared by dissolving 100 mg in 100 ml of methanol.
Standard lamivudine solution: 50 mg of lamivudine is dissolved in 50 ml methanol. 1.0 ml of the above stock solution is further diluted to 10 ml with methanol to get working concentration of 100 mg/mL.
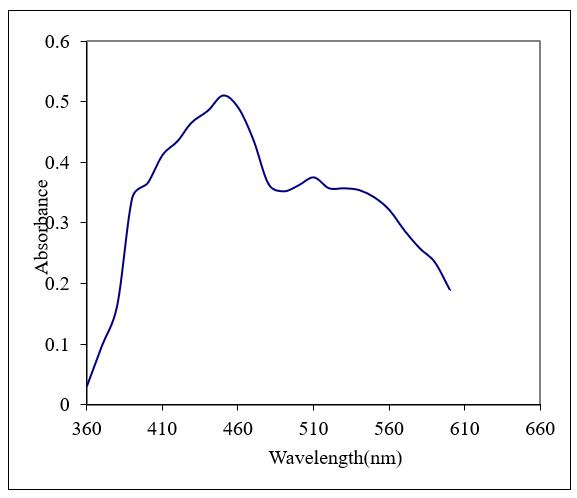
Spectrum of lamivudine for Fixation of wavelength
Procedure:1.0 ml of lamivudine solution (100 µg/ml) was transferred into a clean standard flask. To this solution 1.0 ml of 2,3-dichloro 5,6-dicyano-p-benzoquinone reagent was added to form red colour solution and the final volume was brought to 10 ml with methanol. The resultant red colour solution was allowed to stand for 5 min for complete the reaction. The absorbance of the red colour solution was measured in the wavelength range of 360 to 600 nm, against the reagent blank. The spectrum of lamivudine is given in fig.1. The spectrum shows the maximum absorbance of lamivudine at 450 nm.
Assay Procedure:
Various aliquots of the standard lamivudine solution ranging from 0.2-1.0 ml are transferred into a series of standard flasks. To each flask, 1.0 ml of 2,3-dichloro 5,6-dicyano-p-benzoquinone solution is added to form red colour solution. The final volume is brought to 10 ml with methanol. The reaction mixture in each flask is allowed to stand for 5 min to complete the reaction. The absorbance of the red colour solution is measured at 450 nm, against the reagent blank. Calibration graph is contructed by plotting absorbance values against the concentration of lamivudine solution. The calibration curve is found to be linear over a concentration range of 20 to 100 mg/ml of lamivudine. The amount of lamivudine present in the sample is read from the calibration graph. The results are presented in Table.2.
Assay of lamivudine in pharmaceutical formulations:
Tablets are weighed and contents are powdered and well mixed. The powder equivalent to 50 mg of lamivudine is dissolved in methanol, filtered, residue is washed with distilled water and the volume is made upto 50 ml with methanol. Further dilution is made as described in the preparation of standard solution of lamivudine. Further analysis is carried out as per procedure described above and results are summarized in the Table.2. The amount of drug present in the sample is computed from calibration graph.
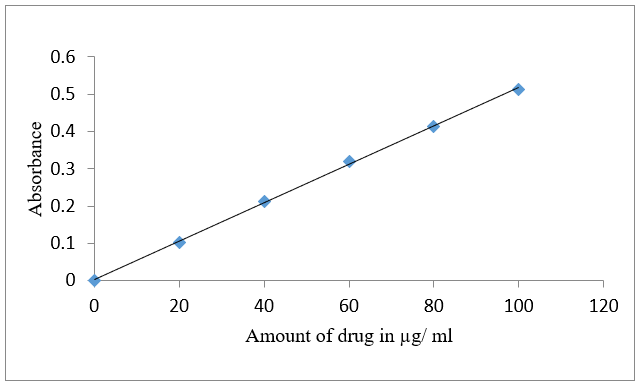
Fig.2: Calibration Curve of Lamivudine
Table.1. Optical Characteristics and Precision of The Proposed Methods
|
Parameters |
Proposed method |
|
λmax (nm) |
450 |
|
Beer’s law limit (µg/ml) |
20-100 |
|
Molar absorptivity (l mole-1 cm-1) |
1.4x10³ |
|
Sandell’s sensitivity (µg cm-2 / 0.001 absorbance unit) |
0.1849 |
|
Regression equation (Y = a + bC) |
Y=0.005X+0.021 |
|
Slope (b) |
0.005 |
|
Intercept (a) |
0.021 |
|
Correlation coefficient (r) |
0.9999 |
*Y = a+bX, where Y is the absorbance and X concentration in μg/ml a= Intercept b= Slope
Table No: 2 Assay and recovery of lamivudine in tablet formulations
|
Tablets |
Labeled amount (mg/tab) |
*Amount found (mg)±S. D* |
% label claim
|
%RSD* |
*t value |
|
Tablet 1 |
300 |
299.96±0.27 |
99.98 |
0.09 |
0.9852 |
|
Tablet 2 |
300 |
299.98±31 |
99.99 |
0.1038 |
0.1436 |
*Average of five determination based on label claim
RESULTS AND DISCUSSION:
In the proposed method the lamivudine react with 2,3-dichloro 5,6-dicyano-p-benzoquinone solution to form red charge complex. The red coloured charge complex solution formed is measured at 450 nm against reagent blank. The amount of lamivudine read from calibration curve. The calibration curve is linear over the range of 20-100 μg/ml of lamivudine. The optical characteristics of the proposed method such as absorption maxima, Beer´s law limits, molar absorptivity and Sandell´s sensitivity are presented in Table.1. The molar absorptivity and Sandell´s sensitivity values show sensitivity of the method. The regression analysis using method of least squares was made for the slope (b), intercept (a) and correlation (r) obtained from different concentrations and results are summarized in the Table.1. The value of correlation coefficient (r) was 0.999, which indicated the good linearity of calibration lines. The percent relative standard deviation calculated from the five measurements of lamivudine shown in Table.1. The % RSD is less than 2, which indicates that the method has good reproducibility. The values of standard deviation values are low, indicates high accuracy and reproducibility of the method. The‘t’ calculated values are compares well with the theoretical value of 2.78 there by indicating that the precision of the method. There is no effect of additives and excipients such starch, calcium lactose and glucose in the concentrations those present in general pharmaceutical preparations. The proposed method is found to be simple, precise, accurate and time saving, reproducible and can be conveniently adopted for routine analysis of estimation of lamivudine in bulk drugs samples and pharmaceutical formulations.
REFERENCES

J. Sudhakar Reddy, M. Balaraju*, Sravanthi Chittela, Spectrophotometric method for the determination of lamivudine in Pharmaceutical Preparations, Int. J. of Pharm. Sci., 2025, Vol 3, Issue 4, 9349-9355 https://doi.org/10.5281/zenodo.15229839
 10.5281/zenodo.15229839