M N College of Pharmacy, B D Rao College Campus, Khambhat, Gujarat, India.
Objective: The present study was aimed to develop a validated analytical method for the routine analysis of Azelnidipine in API and its dosage form. Method: The presented stability indicating HPLC method was developed with RP-HPLC, Column used was 250 x 4.6 mm C18, Phenomenex Luna at ambient temp. with mobile phase containing 10mM Potassium Dihydrogen Phosphate PH 3.0: Acetonitrile (45:55%v/v). The flow rate was1.0 mL/min, peak detection at wavelength 257 nm. Result and Discussion: The retention time for Azelnidipine was found to be 5.524 ± 0.01 min. Linearity was found to be in range of 40-120 µg /mL. The limit of detection and limit of quantitation were found to be 0.68907 µg/ml and 2.08809 µg/ml. Precision was found to be < 2%. Percentage recovery was found to be 99.5-100.7%. The change in flow rate, Column temperature and mobile phase ratio did not show any significant variance. Calculated information acquired for both the preliminaries roughly coordinates with the information given by design expert programming which shows the genuineness of the chromatographic condition. Forced degradation study was also performed to get 2 – 20 ?gradation. Degraded product didn’t show any interfere with Azelnidipine peak. Conclusion: The results of analysis have been validated statistically and recovery studies confirmed the accuracy of proposed method. The method was successively used for determination of pharmaceutical formulation.
Hypertension is a disorder characterized by elevated blood pressure (BP) levels. According to guidelines from the European Society of Cardiology and European Society of Hypertension, hypertension is defined as a systolic BP (SBP) level of at least 140 mmHg and/or a diastolic BP (DBP) level of at least 90 mmHg1. Hypertension is an established risk factor in the prognosis of cardiovascular diseases and organ damage. Recent research suggests that home-measured blood pressure (BP) has a higher predictive power for onset of cardiovascular events than readings made in the office setting2, 3, 4, 5. Hypertension is the most common condition seen in primary care and leads to myocardial infarction, stroke, renal failure, and death if not detected early and treated appropriately. Patients want to be assured that blood pressure (BP) treatment will reduce their disease burden, while clinicians want guidance on hypertension management using the best scientific evidence6. Today, a remarkable number of antihypertensive drug classes with robust scientific evidence of long-term efficacy and safety are available on the market. The therapeutic arsenal includes many different compounds, such as diuretics, beta-adrenergic receptor blockers, alpha-adrenergic receptor blockers, angiotensinogen-converting enzyme inhibitors, angiotensin receptor blockers and calcium antagonists7, 8. Calcium channel blockers (CCBs) are widely used for the treatment of hypertension and ischemic heart disease. In addition to their antihypertensive and cardio protective effects, many trials showed that CCBs decreased the incidence of stroke9. Azelnidipine is a dihydropyridine calcium channel antagonist that is selective for L-type calcium channels10. Azelnidipine (Fig 1) is chemically 3-(1-Benzhydrylazetidin-3-yl) 5-isopropyl 2-amino-1,4-dihydro-6-methyl-4-(3-nitrophenyl) pyridine-3,5-dicarboxylate11.

Fig 1: Azelnidipine
A detailed literature survey, it was revealed that numbers of method have been reported in literature for the analysis of Azelnidipine in combination11, 12, 13, 14, 15, 16. The objective of this study is therefore to develop and validate a simple and fast RP-HPLC method using RP-HPL with UV detector to quantify Azelnidipine in API and medicinal formulation. Forced degradation experiments are used to relieve the development of analytical methodology, to achieve better insightful of the stability of the active pharmaceutical ingredient (API) and the drug product, and to provide information about degradation pathways and degradation products17. The developed method is a validated stability-indicating method, which provides a high degree of analytical confidence that it can be used for the assay test of Azelnidipine as active ingredients in a single run and can specifically detect any potential degradants that may produce during stability testing or during product shelf life. This method was validated in accordance with the requirements of ICH18, 19, 20.
Aim Of Work: The objective of this study was to develop a validated analytical method for the routine analysis of Azelnidipine in API and Tablet dosage form.
MATERIALS AND METHODS:
Instrumentation: HPLC Model LC-2010C HT equipped with UV-Visible PDA detector, Column Make: Phenomenex Luna C18 250 X 4.6 mm, 5?, PH Meter Make: Wadegeti Labequip Pvt Ltd, Micro Balance Make: Mettler Toledo, Sonicator Make: Enertech, Vacuum Filtration Assembly Make: Acmevac Pumps Pvt Ltd, were employed for the Chromatographic analysis. LC Solution (Version 1.0.0.3) software was used to acquire and process the data.
Chemicals and Reagents: Azelnidipine was supplied as a gift sample by J B Chemicals and Pharmaceuticals Ltd, Vadodara. Acetonitrile, Methanol used was of HPLC grade (MERCK Chem. Ltd., Mumbai). Orthophosphoric acid, KH2PO4, K2HPO4, HCl, NaOH, H2O2 used was of Analytical grade (MERCK Chem. Ltd., Mumbai). Double distilled R.O. water was used for mobile phase preparation. Solvents and solutions were filtered through a membrane filter (0.45 ?m pore size) and degassed by sonication before use. Azelnidipine tablet was purchased form market.
Wavelength detection: 8mg of Azelnidipine was dissolved in 50 ml of methanol with 15 minutes sonication. Further 5mL of this solution Was diluted to 10 ml with methanol. This standard solution was scrutinized in the wavelength range of 200-400 nm using methanol as a blank in UV Spectrophotometer.
Chromatographic Conditions: Mobile phase was prepared as follow.
Preparation of 10mM KH2PO4 Buffer (pH 6.5): 1.74 gm of KH2PO4 was dissolved in 1000 mL of water and its pH was adjusted to 6.5 using Ortho Phosphoric Acid. Methanol:Water (80:20%v/v) as Diluent. 10mM potassium dihydrogen phosphate (pH 3.0):Acetonitrile (45:55%v/v).
Preparation of Standard Solutions: 8mg of Azelnidipine API was taken into 50mL Volumetric Flask and it was dissolved in 5ml of DMSO and volume was made up to 50 mL with Diluent. Further 5mL of stock solution was diluted to 10mL with diluent to achieve 80?g/mL of Azelnidipine.
Preparation of Sample Solution: Transferred 5 crushed tablets in to 100mL volumetric flask, added about 10mL of DMSO, sonicated for 30 minutes with intermittent shaking, cooled to attain room temperature and made up to volume with diluent and mixed well. It was filtered through 0.45? syringe filter. 5mLof this filtrate was further diluted to 25mL with diluent to attain the final concentration as 80 ppm of Azelnidipine.
Assay of Marketed Formulation
Azelnidipine 80ppm solution was injected into HPLC system. Peak areas were recorded for all the peaks. The amount Azelnidipine present in the tablets were Calculated using single point analysis by following equation.
C1/C2 = R1/R2
Where, C1, C2 = Concentration of Sample and Standard Solution
R1, R2 = Peak Area of Sample and Standard Solution
Method Validation:
The method was validated as per ICH and FDA guidelines for specificity, linearity and range, accuracy, precision, LOQ, LOD, and robustness.
The linearity of analytical procedure is its ability to elicit test results that are directly proportional to the concentration of analyte in sample. The range of analytical method is the interval between the upper and lower concentration of the analyte for which it has been demonstrated that the analytical procedure has a suitable precision, accuracy and linearity. The linearity and range were determined at five levels over the range of 40-120?g/ml for Azelnidipine. Peak area of above linearity solution preparations was taken at each concentration five times. Mean Peak Area at each concentration was calculated and Graph of Mean was plotted.
Accuracy is the closeness of the test results obtained by the method to the true value. To study the accuracy 5 tablet powder were weighed and analysis was carried out as per assay. Recovery studies were carried out by addition of standard drug to the sample at 3 different concentration levels (80%, 100% and 120%) taking into consideration percentage purity of added bulk drug samples. These solutions were subjected to re-analysis by the proposed method and Results are calculated
The precision of an analytical method is the degree of agreement between a series of measurement obtained from multiple sampling of the same homogeneous sample. It provides an indication of random error in results and was expressed as %RSD.
3a) Repeatability Study
Six replicates of 80?g/ml concentration of Azelnidipine were prepared and chromatograms were recorded at the optimized condition. SD and RSD were calculated.
3b) Intraday precision
Variations of results within the same day called intraday. Intra-day precision was determined
by analysing Both standard solutions for three times in the same day. %RSD was calculated.
3c) Inter day precision Variation of results between days called inter day. Inter-day precision was determined by analysing the drugs daily for three days. %RSD was calculated.
The ability to assess unequivocally the analyte in the presence of component that may be expected to be present. Impurities, degradants, excipients.
Standard drugs and placebo were used to determine the specificity of the Developed method and chromatogram were recorded to check interference of Placebo with drugs.
5a) Limit of Detection (LOD) From the linearity curve equation, the standard deviation (SD) of the intercepts (Response) was calculated. The limit of detection (LOD) of the drug was Calculated by using the following equation designated by International Conference on Harmonization guideline:
LOD = 3.3 ? / S
Where, ? = the standard deviation of the response, S = slope of the calibration curve
Limit of Quantitation (LOQ):
5b) The limit of quantitation (LOQ) of the drug was calculated by using the following equation designated by International Council on Harmonization (ICH) guideline:
LOQ = 10 ? / S
Where, ? = the standard deviation of the response, S = slope of the calibration curve
The robustness of the method was established by making deliberate changing the experimental conditions like
a) Flow rate: ±0.3 ml/min
b) Change in the ratio of component in the mobile phase: ± 4%
c) Column temperature:25 ±2
The effects of changes observed were recorded.
System suitability tests are an integral part of liquid chromatography. They are used to verify that resolution and reproducibility of chromatography system are adequate for the analysis to be done. System Suitability was performed on standard solution and system suitability parameters were calculated at the start of study for each parameter. The test includes Parameters like Number of Theoretical Plates, Resolution, Retention time and tailing factor.
Forced Degradation
Blank Preparation for Acidic Degradation Transferred 5mL diluent in 25mL volumetric flask and added 5 mL 0.1N HCl into it and it was kept at room temperature for 4 hours. Then added 5 mL of 0.1N NaOH to neutralize it and volume was made up to mark with diluent and mixed well and injected. Sample Stock Preparation for Formulation Transferred 5 crushed tablets in to 100mL volumetric flask, added about 10mL of DMSO in to it, sonicated for 30 minutes with intermittent shaking, cooled to attain room temperature and made up to volume with diluent and mixed well. It was filtered through 0.45? syringe filter. Sample Preparation for Acidic Degradation 5 mL filtrate of above stock solution was taken into 25mL of volumetric flask, added 5 mL of 0.1NHCl to it and it was kept for 4 hours at room temperature. Then added 5 mL of 0.1N NaOH to neutralize it and volume was made up to mark with diluent and mixed well and injected.
Blank Preparation for Basic Degradation Transferred 5mL diluent in 25mL volumetric flask and added 5 mL 0.1N NaOH into it and it was kept at room temperature for 4 hours. Then added 5 mL of 0.1N HCl to neutralize it and volume was made up to mark with diluent and mixed well and injected. Sample Stock Preparation for Formulation Transferred 5 crushed tablets in to 100mL volumetric flask, added about 10mL of DMSO in to it, sonicated for 30 minutes with intermittent shaking, cooled to attain room temperature and made up to volume with diluent and mixed well. It was filtered through 0.45? syringe filter. Sample Preparation for Basic Degradation 5 mL filtrate of above stock solution was taken into 25mL of volumetric flask, added 5 mL of 0.1N NaOH to it and it was kept for 4 hours at room temperature. Then added 5 mL of 0.1N HCl to neutralize it and volume was made up to mark with diluent and mixed well and injected.
Blank Preparation for Peroxide Degradation Transferred 5mL diluent in 25mL volumetric flask and added 5 mL 3% H2O2 into it and it was kept at room temperature for 4 hours. Then volume was made up to mark with diluent and mixed well and injected. Sample Stock Preparation for Formulation Transferred 5 crushed tablets in to 100mL volumetric flask, added about 10mL of DMSO in to it, sonicated for 30 minutes with intermittent shaking, cooled to attain room temperature and made up to volume with diluent and mixed well. It was filtered through 0.45? syringe filter. Sample Preparation for Peroxide Degradation 5 mL filtrate of above stock solution was taken into 25mL of volumetric flask, added 5 mL of 3% H2O2 to it and it was kept for 4 hours at room temperature. Then volume was made up to mark with diluent and mixed well and injected.
Blank Preparation for Thermal Degradation
Transferred 5mL diluent in 25mL volumetric flask and it was kept for 4 hours at 80°C temperature. Then volume was made up to mark with diluent and mixed well and injected. Sample Stock Preparation for Formulation Transferred 5 crushed tablets in to 100mL volumetric flask, added about 10mL of DMSO in to it, sonicated for 30 minutes with intermittent shaking, cooled to attain room temperature and made up to volume with diluent and mixed well. It was filtered through 0.45? syringe filter. Sample Preparation for Thermal Degradation 5 mL filtrate of above stock solution was taken into 25mL of volumetric flask, it was kept for 4 hours at 80°C temperature. Then volume was made up to mark with diluent and mixed well and injected.
Blank Preparation for Sunlight Degradation Transferred 5mL diluent in 25mL volumetric flask and it was kept for 8 hours in sun light. Then volume was made up to mark with diluent and mixed well and injected. Sample Stock Preparation for Formulation Transferred 5 crushed tablets in to 100mL volumetric flask, added about 10mL of DMSO in to it, sonicated for 30 minutes with intermittent shaking, cooled to attain room temperature and made up to volume with diluent and mixed well. It was filtered through 0.45? syringe filter. Sample Preparation for Sunlight Degradation 5 mL filtrate of above stock solution was taken into 25mL of volumetric flask, it was kept for 8 hours in sunlight. Then volume was made up to mark with diluent and mixed well and injected.
RESULT AND DISCUSSION:
Selection of wavelength was carried out using UV spectrophotometer:
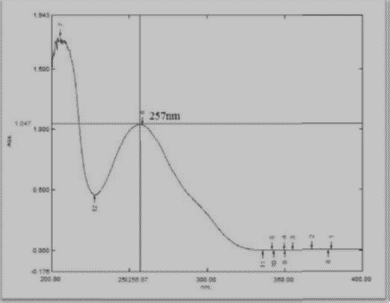
Fig 2: UV Sepctra of Azelnidipine
Based on above UV spectrum Fig 2, we observed that Azelnidipine gives ideal maximum response at wavelength 257nm, so wavelength 257nm was selected for HPLC detection. Mobile phase selection: To develop a HPLC method for estimating the Azelnidipine, the chromatographic conditions were optimized to produce the chromatogram with lesser analysis time (<6>
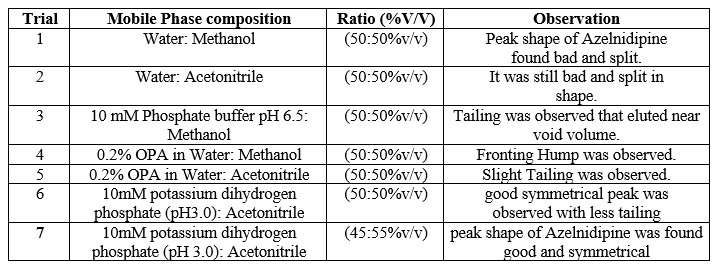
Table 1: Various mobile phases used to develop and optimise the mobile phase for method.
Finally, the separation was carried out using Phenomax Luna C18 column (150 mm × 4.6 mm × 5 µ) with the mobile phase containing 10mM potassium dihydrogen phosphate (pH 3.0): Acetonitrile (45:55 v/v) with a flow rate of 1.0 ml/minute. 20 µl was the injection volume and the effluents from the column were detected at 257nm (Fig. 2) using PDA detector. Azelnidipine was eluted at a retention time of 5.524 minutes. The optimized conditions and chromatograms for blank, standard, and sample of Azelnidipine are given in Table 2 and Figures 3–5.
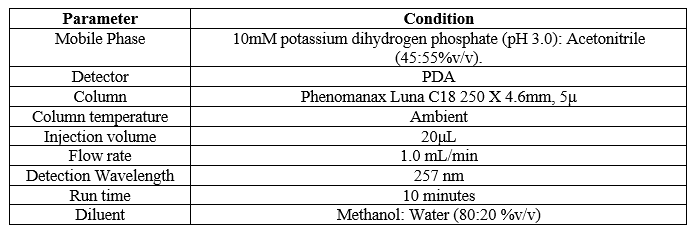
Table 2: The optimised chromatographic conditions
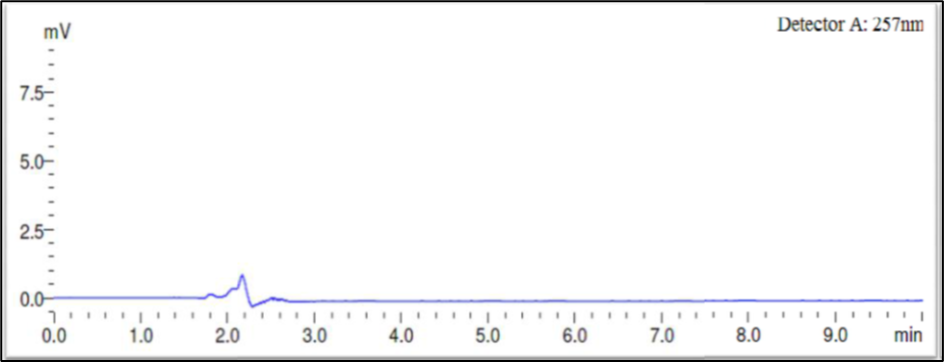
Fig 3: Chromatogram for blank
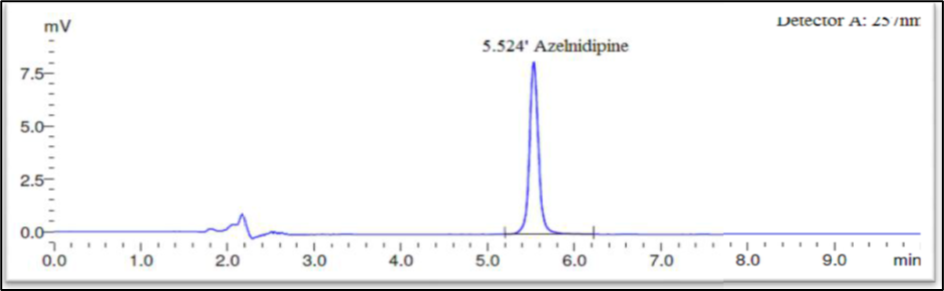
Fig 4: Optimised chromatogram for standard
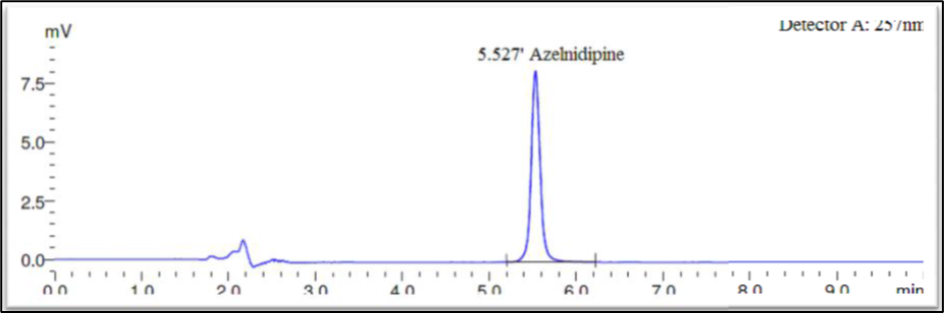
Fig 5: Chromatogram for sample
Method Validation
The drug had a 5.524-minute retention time, it was discovered. At the drug’s retention time using this technique, there were no detectable interfering peaks in the blank or sample. Hence the present approach was claimed to be specific. The chromatogram for blank and sample were given in Figures 3 and 5 respectively.
Linearity and Range:
The standard curve for Azelnidipine was linear over the investigated concentration range 40–120 ?g/mL with a percent relative standard deviation (% RSD) of not more than 2 based on five successive readings. The linearity equation was obtained with a slope of 91590, intercept of 41115.7 and a correlation coefficient (r2) of 1.0. For the calibration curve over the concentration range, the data have shown a good correlation. Thus, it was discovered that the current method was linear
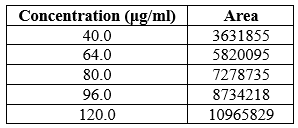
Table 3: Linearity data of Azelnidine
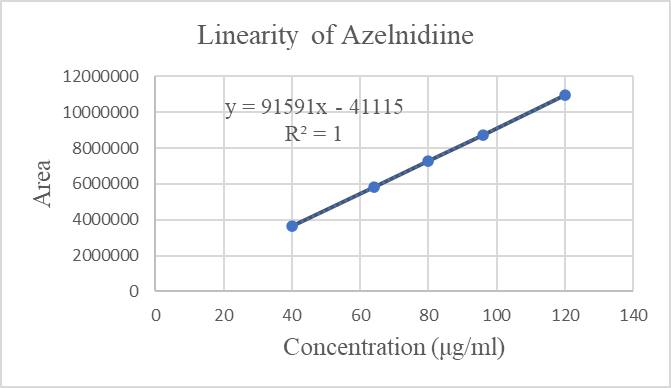
Figure 6: Linearity curve of Azelnidine
Accuracy of the method was confirmed by recovery study from marketed formulation at
three level of standard addition. Percentage recovery for Azelnidipine was found to be
99.5%– 100.7%. The results are shown in Table 4. Recovery greater than 98 % with
low SD justifies the accuracy of the method.
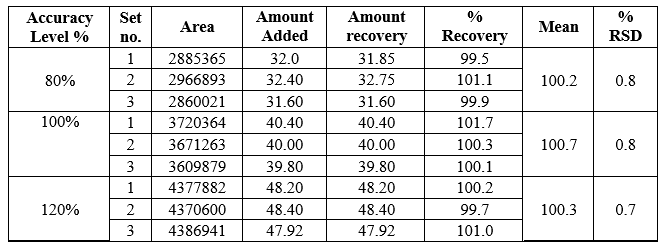
Table 4: Recovery data of Azeldipine
3a) Repeatability (Method precision, n=6):
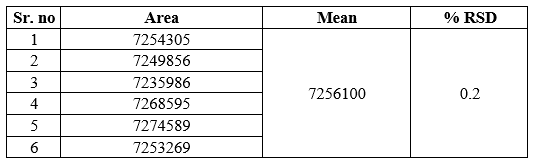
Table 5 Repeatability Study of Azelnidipine (n=6)
The data for repeatability of Azelnidipine is shown in Table 5. The % RSD for Repeatability data was found to be 0.2%.
3b) Intraday precision
The data for intraday precision for Azelnidipine is shown in Table 6. The % RSD for intraday precision for Azelnidipine was found to be between 0.21 — 0.26%.
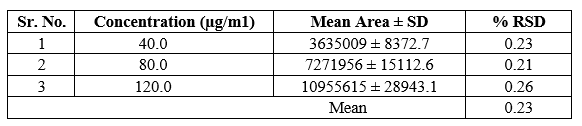
Table 6: Intraday Precision Study of Azelnidipine (n=3)
3c) Interday precision
The data for Interday precision for Azelnidipine is shown in Table 7. The % RSD for interday precision for Azelnidipine was found to be between 0.72— 0.93%
Table 7: Interday Precision Study of Azelnidipine (n=3)
The Limit of detection (LOD) were found to be 0.689 for Azelnidipine and Limit of quantification (LOQ) were found to be 2.088 for Azelnidipine.
The method is found to be Robust as the results were not significantly affected by Slight variation in composition of mobile phase (Table 8), flow rate of the mobile phase (Table 9), and pH of mobile phase (Table 10).

Table 8: Change the ratio of mobile phase
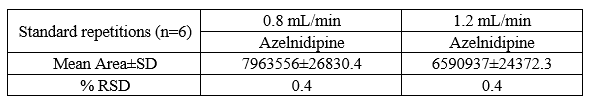
Table 9: Change the flowrate of mobile phase
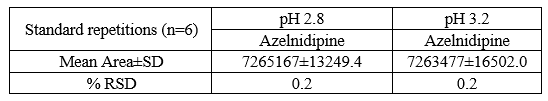
Table 10: Change the pH of mobile phase
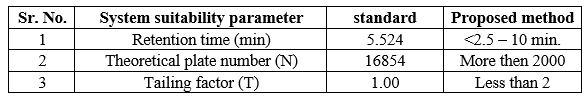
Table 11: System Suitability test

Table 12: Analysis of market formulation.
Forced degradation
Forced degradation performed on blank solution (mobile phase) and test sample solution of Azelnidipine finished product. Blank and sample solutions of test concentration injected in a single, recorded peak purity factor from each tested stressed condition and calculate percentage assay of Azelnidipine peak. The strategy used for forced degradation to produce desire amount of degradation i.e. 2-20 % and satisfactory degradation observed. Chromatograms generated from all forced degradation experiments and the ?gradation at each specific condition is shown in Figure 7–12 and Table-13 respectively.
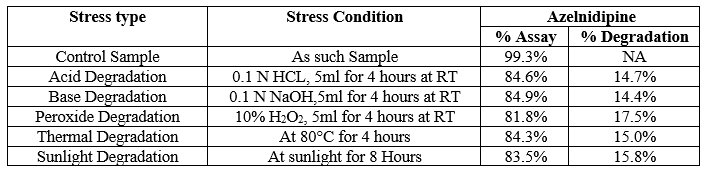
Table 13: Degradation at different stress condition.
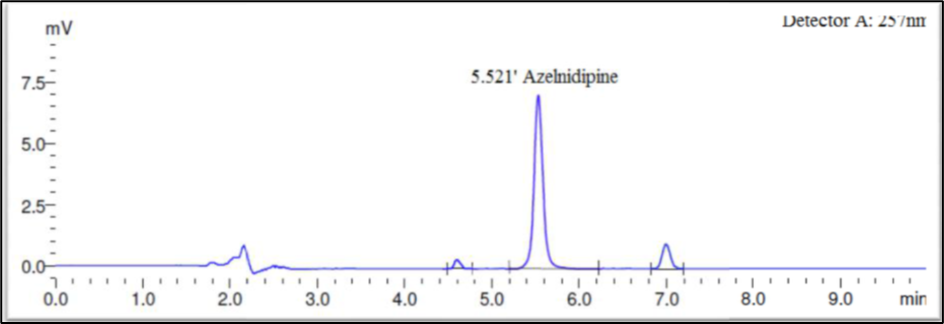
Fig 7: Acid Degradation
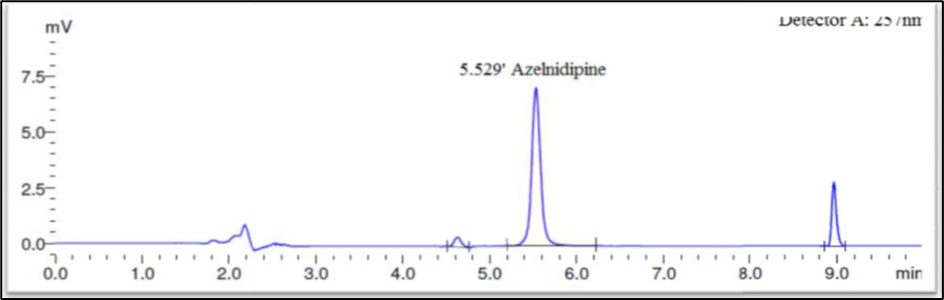
Fig 8: Base Degradation
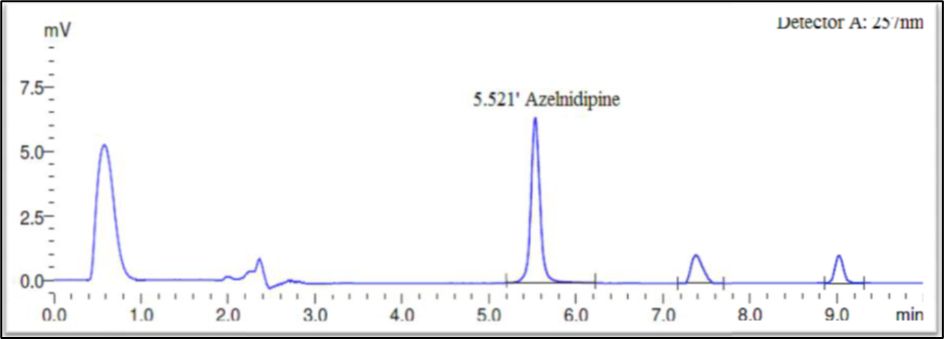
Fig 9: Oxidative Degradation
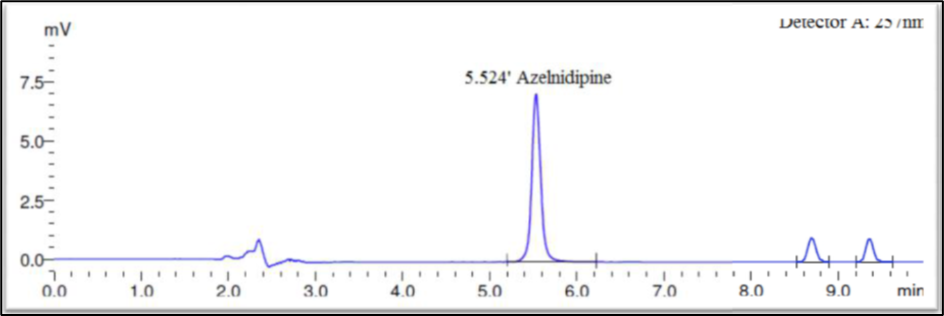
Fig10: Thermal Degradation
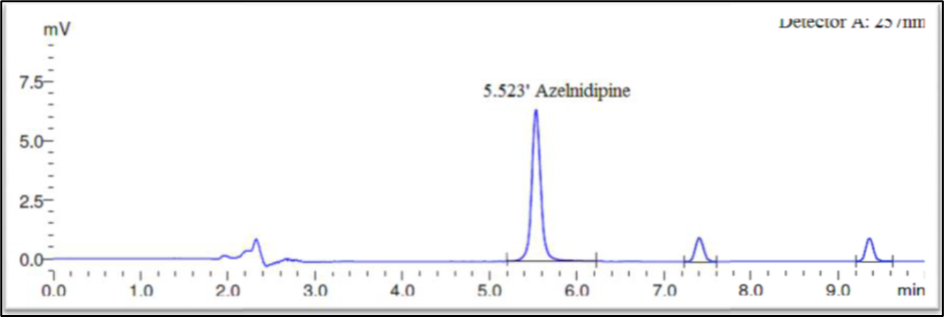
Fig 11: Sunlight Degradation
CONCLUSION:
A simple, accurate and precise Stability indicating RP-HPLC method for the estimation of Azelnidipine in Pharmaceutical Dosage form has been developed and validated. 10mM potessium dihydrogen phosphate (pH3.0):Acetonitrile (45:55%v/v) Separation of drugs was carried out using mobile phase at 10 min. run time and 257 nm. The Rt value for Azelnidipin were found to be 5.524 ± 0.01 min. The drug response with respect to peak area was linear over the concentration range 40-120 ?g/ml for Azelnidipine. The percentage recovery of was found to be 99.5-100.7%. The %RSD values for intra-day precision study and inter-day study were ? 2.0%, confirming that the method was sufficiently precise. The limit of detection and limit of quantitation were found to be 0.689?g/ml and 2.088 ?g/ml for Azelnidipine The %RSD values of Robustness study were ? 2.0%, confirming that the proposed method was found to be robust enough to withstand such deliberate changes and allow routine analysis of the sample. Interference studies reveals that the common excipients and other additives usually present in the dosage form did not interfere in the proposed method. The system stability test parameters were also performed and were found to be within acceptable criteria. So it is concluded that the developed method is specific.
The method can be successfully employed for the determination of Azelnidipine in pharmaceutical dosage form.
REFERENCE


Vishal Chudasma*, Megha Patel, Kiran Suthar, Bharat Rajpurohit, Stability Indicating Rp-Hplc Method Development and Validation for Estimation of Azelnidipine in its Bulk and Tablet Dosage Form, Int. J. of Pharm. Sci., 2024, Vol 2, Issue 7, 2206-2219. https://doi.org/10.5281/zenodo.13134380
 10.5281/zenodo.13134380
