1PG Scholar, Department of Pharmacology, College of Pharmacy, Madras Medical College, Chennai, Tamil Nadu, India.
2Assistant Professor, Department of Pharmacology, College of Pharmacy, Madras Medical College, Chennai, Tamil Nadu, India.
3PG Scholar, Department of Pharmacology, College of Pharmacy, Madras Medical College, Chennai, Tamil Nadu, India.
Background- Pun Purai Ennai, a traditional Siddha medicine, is notable for its potential healing properties. This study aimed to standardize and quantify its phytochemical constituents, focusing on its medicinal properties. Objectives- The primary objective was to assess the medicinal properties of Pun Purai Ennai by evaluating its phytochemical constituents, physical and chemical parameters, and potential therapeutic benefits. Methodology- The formulation, primarily composed of Indian Tulip Tree, was obtained from the Government Siddha Medical College in Chennai and includes several other components. The study evaluated the organoleptic characters, physical and chemical parameters, performed phytochemical screening, and quantified phytochemical constituents, minerals, and metals. Results- The evaluation revealed promising organoleptic characters and physical and chemical properties, indicating the formulation's purity. The phytochemical analysis revealed the presence of beneficial compounds like alkaloids, phenolics, flavonoids, and fatty acids, which are recognized for their antioxidant, anti-inflammatory, and antimicrobial effects. Quantification highlighted the therapeutic value of tannins and alkaloids. However, the presence of cyanogenic glycosides necessitates caution. The formulation also met safety standards for heavy metals and exhibited elements relevant to wound healing processes. Conclusion- These findings support the suitability of Pun Purai Ennai for wound healing, emphasizing the need for further research to explore its mechanisms of action and therapeutic efficacy.
Over the past few years, there has been a significant resurgence in the popularity of herbal medicine on a global scale, as more and more people are turning to natural remedies for their health concerns. One of the ancient Indian medical systems known as the Siddha system, predominantly practiced in the southern regions of India, has garnered considerable interest. This growing fascination is evident as numerous Siddha formulations are being manufactured and made available in the market. However, despite the immense potential that these traditional herbal remedies hold, a major obstacle to their widespread acceptance is the absence of standardized quality control measures.
Although numerous herbal formulations are available in the market, many of them do not have well-defined quality control standards. This underscores the urgent necessity to create fast, sensitive, and precise quality control methods specifically designed for Siddha formulations, utilizing modern technological innovations. It is crucial to ensure that herbal medicines meet stringent quality standards, as the effectiveness and safety of these remedies directly depend on their composition and quality.[1]
Given these circumstances, the primary focus of this study is to establish the standardization and quantification of phytochemical constituents in "Pun Purai Ennai," a polyherbal Siddha formulation renowned for its potential wound-healing properties. Through meticulous analytical methods and advanced technology, our objective is to gain a comprehensive understanding of the composition and quality of this ancient formulation, thereby enhancing its credibility and trustworthiness as a therapeutic option in contemporary medicine. The valuable insights gained from this research endeavor promise to promote wider acceptance and utilization of Siddha formulations, ensuring consistent and safe medicinal effects.
MATERIALS AND METHODS
Procurement of formulation
In this study, Pun Purai Ennai was sourced from the Government Siddha Medical College in Chennai.
Preparation of pun purai ennai
Pun purai ennai is a Siddha medicine, prepared using ingredients given in Table 1. Heat the oil and powdered ingredients except kungiliyam, in a sand gritty consistency. Unmount the stove add the kungiliyam finally and dissolve.
Table 1: Ingredients Of Pun Purai Ennai
|
S.no |
Common name and Tamil name |
Botanical name |
Amount |
|
1 |
Indian tulip tree(povarasampattai) |
Thespesia populnea |
1kg |
|
2 |
Sulphur(gandhagam) |
Sulphur |
50gm |
|
3 |
Black cumin seeds(karunjeeragam) |
Nigella sativa |
50gm |
|
4 |
Indian madder (manjitti) |
Rubia cordifolia |
50gm |
|
5 |
Chebulic myrobalan (kadhukkai thol) |
Terminalia chebula |
50gm |
|
6 |
Black cutch (kaaichukatti) |
Acacia catechu |
50gm |
|
7 |
Aleppo oak (masikkai) |
Quercus infectoria |
50gm |
|
8 |
Sal tree (ven kungiliyam) |
Shorea robusta |
50gm |
|
9 |
Coconut oil (thengaai ennai) |
Cocos nucifera |
5litres |
Organoleptic characters [2]
Organoleptic characters of the pun purai ennai were noted. Organoleptic parameters are varna (colour), gandha (odour), ruchi (taste), and texture were analyzed.
Physiochemical analysis [3,4]
Physical parameters
Specific Density
The specific gravity of the oil was measured using the pycnometer method, and the specific density was calculated from these measurements.
pH
The pH of the oils was assessed using a pH meter.
Refractive Index
The refractive index was measured at room temperature with an Abbe refractometer.
Viscosity
The viscosity of the oil sample was evaluated using an Ostwald viscometer.
Boiling Point
The boiling point of the oil sample was determined using a thermometer with a precision of ±1 degree Celsius. It was observed that the boiling points were affected by the degree of unsaturation in the fatty acids present in the oils.
Spreadability
The spreadability of the oil was determined by utilizing glass plates coated with a 1% aqueous gelatin solution and was allowed to solidify on a tray floating on an ice bath for 1 h. The film was then dried at room temperature for two days using a dust-free cabin. Then plates were placed on graph paper on a flat surface and 10 µl of the oil was placed using a microliter pipette. After 5 min, the diameter of the circular spreading area was read.
Chemical Parameters
Determination of Free Fatty Acid
The free fatty acid (FFA) content in the oil sample was evaluated by titration using phenolphthalein as an indicator until a pink hue was observed. A precise amount of 0.002 kg of the oil sample was accurately weighed and placed into a volumetric flask.
Determination of Saponification Value
The saponification value was calculated by combining 2 g of the oil sample with 25 ml of 1.0% alcoholic KOH in a volumetric flask. The mixture was boiled for 45 minutes, ensuring complete saponification, aided by a condenser. After cooling, 1 ml of phenolphthalein was added, and the solution was titrated with 0.5N HCl until the pink color disappeared. A blank determination was performed simultaneously. The saponification value was calculated using the following formula:
Saponification value = 56.1 × N × (V2 - V1) / W
Where N is the normality of the HCl solution used.
V1 is the volume of HCl used in the analysis (ml).
V2 is the volume of HCl used in the blank (ml).
W is the weight of the sample (g).
Determination of Iodine Value
To determine the iodine value, 1 g of oil was mixed with 15 ml of carbon tetrachloride and 25 ml of Hanus reagent in a 500 ml volumetric flask. After allowing the mixture to stand in the dark for 30 minutes, 20 ml of 10% KI and 150 ml of distilled water were added. The solution was then titrated with 0.1 N thiosulphate until a faint yellow color faded. Then, 1.5 ml of starch indicator was added, and titration was continued until the blue color disappeared. A blank determination was conducted alongside the test. The iodine value was calculated using the formula:
Iodine value = 12.69 × (V2 - V1) × N / W,
Where, W is the weight of the sample (g),
V1 is the volume of HCl used in the test (ml),
V2 is the volume of HCl used in the blank (ml), and N is the normality of HCl.
Determination of Peroxide Value
The peroxide value, which measures the peroxide content in the oil, was determined by assessing the iodine released from potassium iodide. A known quantity of the oil sample was dissolved in acetic acid and chloroform, followed by the addition of saturated KI. The iodine liberated from KI due to the oxidative action of peroxides in the oil was measured by titration with standard sodium thiosulphate, using starch solution as an indicator. A blank titration was also performed. The peroxide value was calculated as follows:
PV (meq/kg oil) = (S - B) × W × N
Here, B is the volume of sodium thiosulphate utilized for the blank solution,
W is the weight of the oil sample,
S is the volume of sodium thiosulphate consumed by the oil sample, and
N is the normality of the standard sodium thiosulphate solution.
Determination of Acid Value
To determine the acid value, 3 g of oil samples were placed in 250 ml conical flasks. Freshly neutralized ethyl alcohol (30 ml) was added to ensure the complete dissolution of the samples. The solution was then boiled, cooled, and treated with 1 ml of phenolphthalein indicator. It was subsequently titrated with 1 N sodium hydroxide solution until a persistent light pink color appeared. The acid value was calculated using the equation:
Acid value = 2.82 × V × 100 / W × 1000 × 4
where V is the titre value of 1 N NaOH, and
2.82 is the equivalent weight of oleic acid.
Determination of Total Alkali
The total alkali content was determined by titrating the excess acid in the aqueous phase with a standard volumetric NaOH solution. The sample was mixed with ethanol and 1 N H2SO4 solution, heated until dissolved, and then titrated with 1 N NaOH using phenolphthalein as an indicator.
Foamability Test
For the foamability test, approximately 0.5 g of the sample was added to a 100 ml standard flask containing 100 ml of double-distilled water. The mixture was vigorously shaken for two minutes to generate foam and then allowed to stand for 10 minutes. The height of the foam was measured carefully.
Phytochemical screening [5]
The preliminary phytochemical evaluation was conducted for the pun purai ennai formulation following standard procedures. The evaluation involved a series of tests aimed at detecting the presence of various compounds in the sample, including carbohydrates, alkaloids, triterpenoids, glycosides, steroids, phenolic compounds, tannins, saponins, flavonoids, proteins, amino acids, and both fats and fixed oils.
Quantification of phytochemical constituents [6,7]
Quantification of Tannins
Tannins were quantified using the Folin-Ciocalteu method. A 10 ml volumetric flask was used to mix 0.1 ml of the sample with 7.5 ml of distilled water, 0.5 ml of Folin-Ciocalteu phenol reagent, and 1 ml of 35% sodium carbonate. The mixture was left to stand for 30 minutes. Reference standards, ranging from 0.07 to 1 mg/ml of tannic acid, were prepared in a similar manner. After incubation, the absorbance was read at 750 nm using a UV/Visible spectrophotometer. The tannin content was expressed as mg tannic acid equivalents per gram of the sample.
Quantification of Alkaloids
To quantify alkaloids in the sample, 0.63 g of the PPE sample was mixed with 200 ml of 10?etic acid in ethanol. The mixture was allowed to stand for 4 hours and then heated to reduce the volume to one-quarter of the original. The solution was filtered, and 15 drops of concentrated NaOH were added, followed by a 3-hour resting period. After incubation, the precipitate was collected, and the supernatant was discarded. The residue was washed with 20 ml of 0.1M ammonium hydroxide, filtered, and weighed to determine the alkaloid content.
Quantification of total phenol content [8,9]
The total phenolic content was determined using Folin Ciocalteu's method. Aliquots of 1 ml and gallic acid standards (ranging from 0.007 mg/ml to 1 mg/ml) were mixed with 5 ml of distilled water and 0.5 ml of Folin Ciocalteu's reagent. After 5 minutes, 1.5 ml of 20% sodium carbonate was added, and the volume was adjusted to 10 ml. The tubes were incubated for 2 hours, resulting in an intense blue color. Absorbance at 750 nm was measured using a UV-visible spectrophotometer. Triplicate experiments were conducted with a reagent blank, and the total phenolic content was expressed as mg gallic acid equivalent weight per 100 g of the sample.
Quantification of total flavonoid content [9,10,11]
The total phenolic content was determined using Folin Ciocalteu's method. Aliquots of 1 ml and gallic acid standards (ranging from 0.007 mg/ml to 1 mg/ml) were mixed with 5 ml of distilled water and 0.5 ml of Folin Ciocalteu's reagent. After 5 minutes, 1.5 ml of 20% sodium carbonate was added, and the volume was adjusted to 10 ml. The tubes were incubated for 2 hours, resulting in an intense blue color. Absorbance at 750 nm was measured using a UV-visible spectrophotometer. Triplicate experiments were conducted with a reagent blank, and the total phenolic content was expressed as mg gallic acid equivalent weight per 100 g of the sample.
Quantification of cyanogenic glycosides content [12]
The cyanogenic glycoside content in the sample (PPE) was determined through a distillation process after autolysis. The sample was mixed with 2.5% sodium hydroxide and an antifoaming agent (tannic acid). The resulting distillate was combined with ammonium hydroxide and potassium iodide. Titration with 0.02M silver nitrate was performed until continuous turbidity appeared, indicating the endpoint. The cyanogenic glycoside content in the PPE sample was then calculated using the following formula:
Cyanogenic Glycoside (mg/100g) = (Titre value (Cm3) ×1.08×Exact volume / Aliquot volume (Cm3) × sample weight (g)) × 100Mineral and metal analysis [13]
Qualitative test
• Silicate Test
A small portion of the sample was vigorously shaken with either concentrated hydrochloric acid (HCl) or sulfuric acid (H2SO4). The persistence of insoluble or slightly soluble residues after shaking indicates the presence of silicates in the sample.
• Phosphate Test
To test for phosphates, 2 ml of the sample was mixed with 2 ml of ammonium molybdate solution and 2 ml of concentrated nitric acid (Conc. HNO3). The appearance of a cloudy yellow solution confirms the presence of phosphate.
• Sulphate Test
2 ml of the sample was treated with 2 ml of diluted HCl until effervescence ceased, followed by the addition of 2 ml of barium chloride solution. A white precipitate that does not dissolve in concentrated HCl confirms the presence of sulphate.
• Chloride Test
2 ml of the sample was combined with 2 ml of dilute nitric acid (HNO3) until effervescence ceased. Then, 2 ml of silver nitrate was added. The formation of a curdy white precipitate indicates the presence of chloride.
• Sulphide Test
A foul-smelling gas, reminiscent of rotten eggs, was produced when 1 gm of the oil sample was combined with 2 ml of concentrated HCl, indicating the presence of sulphide compounds.
• Iodide Test
Upon mixing 2 ml of the sample with dilute nitric acid and 0.5 ml of silver nitrate solution, the formation of a pale-yellow, curdy precipitate indicates the presence of iodide.
• Iron Test
1 ml of the sample was treated with 1 ml of potassium ferrocyanide solution. The presence of an intense blue precipitate, which is insoluble in dilute hydrochloric acid, confirms the presence of iron.
• Calcium Test
The addition of 2 ml of 4% ammonium oxalate solution to 2 ml of the sample resulted in the formation of a white precipitate, indicating the presence of calcium.
• Sodium Test
2 ml of the sample was made into a paste using HCl and introduced into the blue flame of a Bunsen burner. The appearance of a yellow flame indicates the presence of sodium.
• Potassium Test
The sample was treated with 2 ml of sodium nitrite solution, followed by 2 ml of cobalt nitrate in 30% glacial acetic acid. The formation of a yellow precipitate indicates the presence of potassium.
• Zinc Test
5 ml of the sample was treated with 2 ml of potassium ferrocyanide solution, resulting in a white precipitate that is insoluble in dilute hydrochloric acid, confirming the presence of zinc.
• Magnesium Test
2 ml of the sample was treated with 1 ml of dilute ammonia solution. The appearance of a white precipitate suggests the presence of magnesium.
• Lead Test
2 ml of the sample was mixed with 2 ml of potassium iodide solution. The formation of a yellow precipitate indicates the presence of lead.
• Cobalt Test
Upon treatment with concentrated HCl, 2 ml of the sample developed a bluish-purple color, indicating the presence of cobalt.
• Nickel Test
2 ml of the sample was treated with aqueous ammonia, leading to the formation of a light green precipitate, which indicates the presence of nickel.
• Bismuth Test
2 ml of the sample was mixed with ammonium hydroxide, resulting in a white precipitate, indicating the presence of bismuth.
• Silver Test
When treated with aqueous ammonia, 2 ml of the sample formed a brown precipitate, which confirms the presence of silver.
• Sulphur Test
2 ml of the sample was combined with sodium nitroprusside, producing a violet color that indicates the presence of sulphur.
• Selenium Test
2 ml of the sample was treated with perchloric acid, followed by the addition of hydrazine to form selenium acid. The appearance of a red color indicates the presence of selenium.
• Chromium Test
Treatment of 2 ml of the sample with dilute HCl resulted in a blue color, indicating the presence of chromium.
• Manganese Test
2 ml of the sample was exposed to hydrogen sulphide gas or sodium hydroxide, leading to a pink or white precipitate, confirming the presence of manganese.
• Mercury Test
The addition of potassium iodide solution to 2 ml of the sample resulted in a red precipitate, indicating the presence of mercury.
• Cadmium Test
2 ml of the sample was treated with sodium hydroxide, leading to the formation of a white precipitate, which indicates the presence of cadmium.
Quantification test [14]
Samples of about 100mg PPE were digested in Teflon vessels with 1 ml ultrapure nitric acid using a microwave digestion unit for 45 mins. After digestion, samples were made up to 50ml in standard measuring flasks. Calibration standards were prepared in a range starting from 0.25 ?g/ml using ultrapure nitric acid, including a blank. The analysis was conducted using an Agilent ICPOES 5100 VDV instrument, operating at an RF power of 1.2 kW, with a plasma gas flow rate of 12 L/min and a nebulizer gas flow rate of 0.70 L/min, as the samples were introduced through a nebulizer and spray chamber.
RESULTS AND DISCUSSION
Organoleptic characters [2,15]
The organoleptic characters of pun purai ennai were illustrated in the following table 2.
Table 2: Organoleptic Characters Of Pun Purai Ennai
|
S.no |
Character |
Observation |
|
1. |
Texture |
Oily texture |
|
2. |
Colour |
Orange |
|
3. |
Odour |
Pleasant odour |
|
4. |
Taste |
Astringent taste |
Pun Purai Ennai, with its oily texture, offers a protective barrier for wounds. Its application forms a thin layer that shields the wound from contaminants and maintains a moist environment. The oil's moisture-retaining properties prevent excessive drying and support tissue proliferation.
Physicochemical analysis [16,17,18]
The physicochemical analysis of pun purai ennai was presented in Table 3 and Table 4.
Table 3: Physical Analysis Of Pun Purai Ennai
|
S.no |
Parameters |
Result |
|
1. |
Specific gravity |
1.074 kg m-3 |
|
2. |
Ph |
9.5 |
|
3. |
Refractive index |
1.46 |
|
4. |
Viscosity |
46.05mm2/s |
|
5. |
Boiling point |
Above 234oc |
|
6. |
Spreadability |
2 cm |
Pun Purai Ennai's physical analysis revealed key properties: specific gravity of 1.074 kg/m?3; indicated solute presence, pH of 9.5 showed an alkaline nature with potential antimicrobial effects. A refractive index of 1.46 suggested oil saturation, a viscosity of 46.05 mm?2;/s demonstrated moderate absorption, and a boiling point above 234°C indicated thermal stability. A spreadability of 2 cm denoted moderate skin spreadability, offering insights into solute content, nature, saturation, absorption, and spreadability.
Table 4: Chemical Analysis Of Pun Purai Ennai
|
S.no |
Parameters |
Result |
|
1. |
Free fatty acid value |
5.4% |
|
2. |
Saponification value |
252.04 mgKOH/g |
|
3. |
Iodine value |
7.95gl2/100g |
|
4. |
Peroxide value |
0.38mEq.O2/kg |
|
5. |
Acid value |
0.42mg KOH/g |
|
6. |
Total alkali |
0.32% |
|
7. |
Foam height |
1cm |
The analysis offers valuable insights into Pun Purai Ennai's composition and attributes. A low free fatty acid value signifies stability and reduced rancidity risk. The saponification value indicates the average molecular weight of the fatty acids present, whereas a low iodine value implies a lower degree of unsaturation and reduced susceptibility to oxidation. Low peroxide and acid values indicate stable storage and minimal spoilage. The total alkali value suggests low alkaline content. A foam height of 1 cm indicates moderate foaming ability. These findings collectively inform about the quality, stability, and potential wound healing applications of Pun Purai Ennai. The physicochemical parameters of the tested sample were compared against the standard ranges outlined in the Codex Alimentarius (Standard for Named Vegetable Oils) and the research conducted by M. O. Aremu et al. (2015). It was found that the values of the tested parameters fell within the acceptable range specified by both references.
Phytochemical screening [19]
The phytochemical constituent present in Pun Purai Ennai is given in Table 5.
Table 5: Phytochemical Screening Of Pun Purai Ennai
|
S.no |
Phytochemical constituents |
Test |
PPE |
|
1. |
Carbohydrates |
Molisch’s test Fehling’s test Barfoed’s test |
+ + + |
|
2. |
Glycosides |
Borntrager’s test Keller-Killani test |
+ + |
|
3. |
Alkaloids |
Dragendorff’s test Mayer’s test Wagner’s test Hager’s test |
+ + + + |
|
4. |
Phenolics |
Ferric chloride test Lead acetate test |
+ + |
|
5. |
Flavonoids |
Alkaline reagent test Shinoda’s test |
+ + |
|
6. |
Tannins |
Ferric chloride test Lead acetate test |
+ + |
|
7. |
Saponins |
Foam Test Froth test |
- - |
|
8. |
Steroids and terpenoids |
Salkowski Test Liebermann -Burchard Test |
+ + |
|
9. |
Proteins and amino acids |
Xanthoproteic test Ninhydrin test |
+ - |
|
10. |
Fats and fixed oil |
Stain test |
+ |
+ indicates the presence of active constituents
- indicates the absence of active constituents
The analysis of Pun Purai Ennai identified diverse phytochemicals including alkaloids, glycosides, carbohydrates, steroids & triterpenoids, phenolics, tannins, flavonoids, fats & fixed oils, and proteins. These compounds possess therapeutic potential contributing to wound-healing effects. While free amino acids were absent, tannins, phenolics, flavonoids, and fatty acids offer wound-healing benefits. Antioxidant properties of phenolics and flavonoids reduce oxidative stress, aiding tissue repair. Anti-inflammatory attributes mitigate inflammation, expediting healing. Though saponins weren't detected, other phytochemicals indicate valuable wound-healing potential in Pun Purai Ennai.
Quantification of phytochemical constituents
Quantification of tannins [20,21]
The quantification of tannins in Pun Purai Ennai and the results of the quantification are presented in Table 6 and Fig. 1.
Table 6: Estimation Of Total Tannin Content Of PPE
|
Sample |
Concentration (mg/ml) |
Absorbance |
|
Standard (Tannic acid) |
5 |
2.237 |
|
2.5 |
2.088 |
|
|
1.25 |
1.511 |
|
|
0.625 |
1.117 |
|
|
0.312 |
1.031 |
|
|
0.156 |
0.978 |
|
|
0.078 |
0.881 |
|
|
0.039 |
0.778 |
|
|
PPE |
0.1ml |
1.069 |
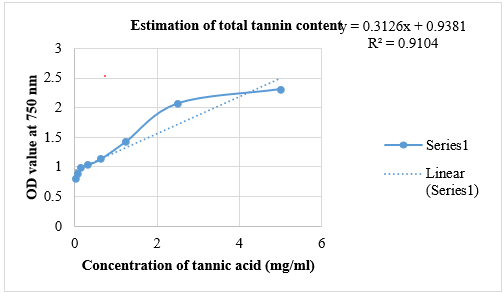
Fig.1: Estimation Of Total Tannin Content Of PPE
The total tannin content in the sample (PPE) was measured at 0.42 mg/g, suggesting the presence of tannins with potential therapeutic benefits. Tannins are recognized for their antioxidant, anti-inflammatory, and antimicrobial properties, which are advantageous for wound healing. These compounds may offer protection against oxidative stress, diminish inflammation, and help prevent infections, all of which are critical for effective wound recovery.
Quantification of alkaloids [22]
The quantification of alkaloids in Pun Purai Ennai is presented in Fig. 2.
% Alkaloid = Weight of alkaloid / Weight of sample × 100.
% Alkaloid = 0.49/ 0.63* 100 = 77.77%
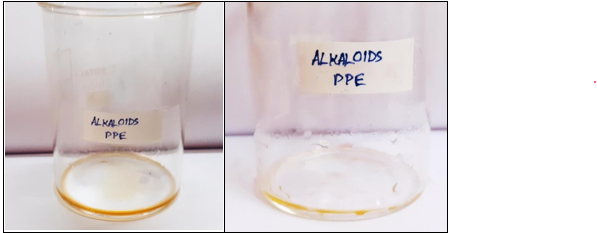
Fig. 2: Estimation of the alkaloid content of PPE
The analysis of the provided sample (PPE) revealed a significant alkaloid content of approximately 77.77%. Alkaloids can exhibit analgesic, anti-inflammatory, antimicrobial, and antiviral activities, which are crucial factors in promoting the healing process of wounds.
Quantification of total phenol content [23,24]
The quantification of total phenol content in Pun Purai Ennai was estimated and the results of the quantification are presented in Table 7 and Fig. 3.
Table No.7: Estimation Of Total Phenolic Content Of PPE
|
Sample |
Concentration(mg/ml) |
Absorbance |
|
Standard (Gallic acid) |
5 |
2.939 |
|
2.5 |
1.673 |
|
|
1.25 |
0.769 |
|
|
0.625 |
0.656 |
|
|
0.312 |
0.578 |
|
|
0.156 |
0.383 |
|
|
0.078 |
0.276 |
|
|
0.039 |
0.178 |
|
|
PPE |
1ml |
0.356 |
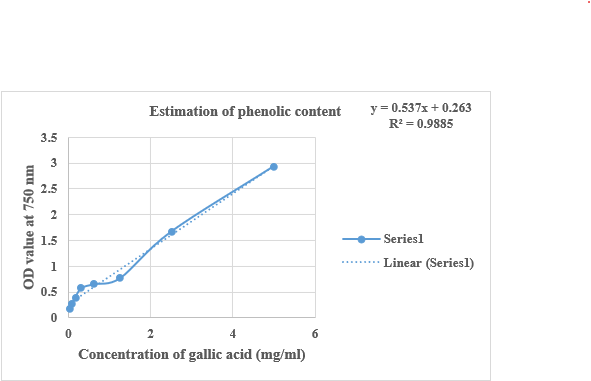
Figure no.3: Estimation of total phenolic content of PPE
The examination of the sample (PPE) showed a total phenol content of 1.7 mg/100g, indicating the presence of phenolic compounds with notable antioxidant effects. These phenolic compounds, known for their antioxidant and anti-inflammatory properties, can aid in protecting against oxidative damage and supporting tissue repair.
Quantification of total flavonoid content [25]
The quantification of total flavonoid content in Pun Purai Ennai was estimated and the results of the quantification are presented in Table 8, and Fig. 4.
Table 8: Estimation Of Total Flavonoid Content Of PPE
|
Sample |
Concentration (mg/ml) |
Absorbance |
|
Standard (Quercetin) |
5 |
2.86 |
|
2.5 |
1.752 |
|
|
1.25 |
0.824 |
|
|
0.625 |
0.775 |
|
|
0.312 |
0.674 |
|
|
0.156 |
0.44 |
|
|
0.078 |
0.294 |
|
|
0.039 |
0.136 |
|
|
PPE |
1ml |
0.513 |
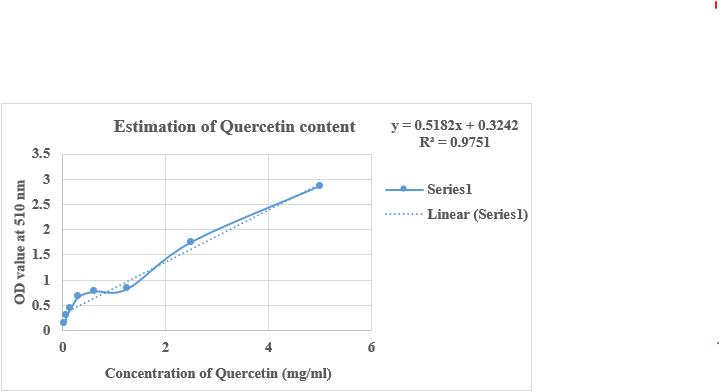
Fig. 4: Estimation of total flavonoid content of PPE
The analysis of the sample (PPE) revealed a total flavonoid content of 3.66 mg/100g. Flavonoids are recognized for their antioxidant and anti-inflammatory effects, which could be advantageous for promoting wound healing. These compounds can scavenge free radicals, protect against oxidative stress, and reduce inflammation, promoting tissue repair.
Quantification of cyanogenic glycosides content [26]
The quantification of cyanogenic glycoside content in Pun Purai Ennai were presented in Fig. 5.
Cyanogenic glycoside (mg/100g) = Titre value (cm3) ×1.08×Exact volume / Aliquot volume (cm3) × sample weight (g))
Cyanogenic glycoside (mg/100g) = 1.3×1.08×20 / 21.4×1 = 1.31mg/100g
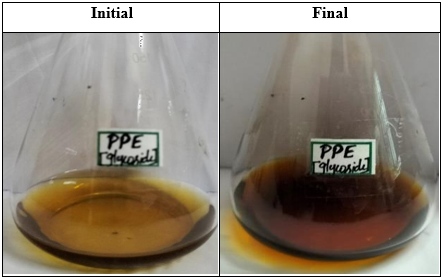
Fig. 5: Estimation of total glycoside content of PPE
The sample (PPE) analysis revealed a cyanogenic glycoside content of 1.31 mg/100g. While lower than fatal levels (up to 500 mg HCN/100g seeds) in other plants, even small cyanogenic glycoside amounts can release toxic HCN, posing risks to organisms. Detoxification varies; animals have rhodanese enzymes for metabolizing HCN. However, the sample's cyanogenic glycoside content remains below safety concerns, considering potential risks from HCN release.
Mineral and metal analysis
Qualitative test
Evaluation of the presence of various metals and minerals in pun purai ennai was illustrated in Table 9.
Table 9. Test for metals and minerals
|
S. No |
Experiment |
Observation |
Inference |
|
1. |
Test for Silicate |
Sparingly soluble |
Presence of Silicate |
|
2. |
Test for Phosphate |
Yellow Precipitation |
Presence of Phosphate |
|
3. |
Test for Sulphate |
No White Precipitation |
Absence of Sulphate |
|
4. |
Test for Chloride |
No White Precipitation |
Absence of Chloride |
|
5. |
Test for Sulphide |
No rotten egg smell |
Absence of Sulphide |
|
6. |
Test for Iodide |
Yellow Precipitation |
Presence of Iodide |
|
7. |
Test for Iron |
Blue precipitation |
Presence of Iron |
|
8. |
Test for Calcium |
No white precipitation |
Absence of Calcium |
|
9. |
Test for Sodium |
No yellow flame |
Absence of sodium |
|
10. |
Test for potassium |
No yellow precipitation |
Absence of potassium |
|
11. |
Test for zinc |
White precipitation |
Presence of zinc |
|
12. |
Test for magnesium |
White precipitation |
Presence of magnesium |
|
13. |
Test for lead |
Yellow precipitation |
Presence of lead |
|
14. |
Test for cobalt |
No bluish-purple colour |
Absence of cobalt |
|
15. |
Test for nickel |
No light green precipitation |
Absence of nickel |
|
16. |
Test for bismuth |
White precipitation |
Presence of bismuth |
|
17. |
Test for silver |
Brown precipitation |
Presence of silver |
|
18. |
Test for sulphur |
Violet colour appears |
Presence of sulphur |
|
19. |
Test for selenium |
No red colour |
Absence of selenium |
|
20. |
Test for chromium |
No blue colour |
Absence of chromium |
|
21. |
Test for manganese |
White precipitation |
Presence of manganese |
|
22. |
Test for mercury |
No red precipitation |
Absence of mercury |
|
23. |
Test for cadmium |
White precipitation |
Presence of cadmium |
The metal and mineral analysis of PPE shows the presence of silicate, phosphate, iodide, iron, zinc, magnesium, lead, bismuth, silver, sulphur, manganese, and cadmium. These elements are believed to play significant roles in wound healing, including tissue regeneration, collagen synthesis, antimicrobial effects, and immune system support. The absence of Sulphate, chloride, sulphide, calcium, sodium, potassium, cobalt, nickel, selenium, chromium, and mercury
Quantitative test [27]
The quantification of heavy metals in Pun Purai Ennai was evaluated and the results of this evaluation were determined and illustrated in Table 10.
Table No.10: Quantification Of Minerals And Heavy Metals In Pun Purai Ennai
|
S.no |
Element |
Pun purai ennai (ppm) |
|
1 |
Ag |
BDL |
|
2 |
As |
BDL |
|
3 |
Cd |
0.23 |
|
4 |
Cu |
5.18 |
|
5 |
Mg |
BDL |
|
6 |
Pb |
8.24 |
|
7 |
Zn |
8.84 |
|
8 |
Hg |
BDL |
|
9 |
Fe |
62.39 |
BDL – Below Detection Level; ppm – parts / million
The heavy metal analysis of PPE formulation showed concentrations (in ppm) as follows: Silver (Ag) 0.23, Arsenic (As) 5.18, Magnesium (Mg) 8.24, Mercury (Hg) 8.84, Cadmium (Cd) below detection level, Copper (Cu) 62.39, Lead (Pb) below detection level, Zinc (Zn) below detection level. Comparison with Ayurvedic Pharmacopoeia of India standards indicated arsenic, mercury, cadmium, and lead levels were within permissible limits, affirming PPE's compliance with safety standards and quality control measures. Monitoring heavy metal content is vital for herbal formulation safety and efficacy, and these results endorse PPE's alignment with established standards.
CONCLUSION
The study comprehensively explores Pun Purai Ennai's organoleptic, physicochemical, phytochemical, and mineral attributes for wound healing potential. Organoleptic analysis indicates its suitability for wound application due to its oily texture, orange color, pleasant odour, and astringent taste. Physicochemical parameters such as specific gravity, pH, refractive index, viscosity, boiling point, spreadability, free fatty acid content, saponification value, iodine value, peroxide value, acid value, alkali value, and foamability contribute to the stability and ease of application of the formulation. Phytochemical screening uncovers active constituents—alkaloids, glycosides, phenolics, flavonoids, steroids—with antioxidant, anti-inflammatory, and antimicrobial potential for wound healing. Quantification of tannins, alkaloids, phenols, and flavonoids supports tissue repair, inflammation reduction, and oxidative stress protection. Safety assessment confirms acceptable cyanogenic glycosides and adherence to heavy metal standards, ensuring human health safety. These insights endorse Pun Purai Ennai's wound healing application, encouraging further research and development in natural remedies for tissue repair and well-being enhancement.
REFERENCES


Logeswari S.*, Indumathy R., Arivunithi S., Standardization And Quantification of Phytochemical Constituents, Metals and Minerals in Pun Purai Ennai, A Polyherbal Siddha Formulation, Int. J. of Pharm. Sci., 2024, Vol 2, Issue 12, 1755-1769. https://doi.org/10.5281/zenodo.14439843
 10.5281/zenodo.14439843
