
We use cookies to ensure our website works properly and to personalise your experience. Cookies policy
Fabtech College Of Pharmacy, Sangola
Green tea (Camellia sinensis) is rich in bioactive compounds, including catechins, caffeine, flavonoids, and amino acids, which contribute to its antioxidant, anticancer, neuroprotective, and cardioprotective properties. However, variations in cultivation, processing, and extraction methods create challenges in ensuring consistent quality and therapeutic efficacy. For green tea extracts, researchers increasingly depend on HPLC because it offers consistent, detailed insight into the variability and quality of the phytochemicals present,enabling accurate separation, identification, and quantification of key bioactive constituents such as epicatechin, Epigallatocatechin Caffeine,catechin and gallic acid. The focus of this review is to explore the major phytochemicals found in green tea and to examine how standardization influences the quality and effectiveness of herbal drug products and discusses HPLC-based approaches for quality control. Method development and optimization, including mobile phase composition, column selection, gradient elution, and extraction protocols, are presented. The review also addresses challenges such as variability in extraction efficiency, availability of reference standards, and cost considerations. Overall, HPLC provides a robust and reproducible framework for the quality evaluation and standardization of green tea extracts.
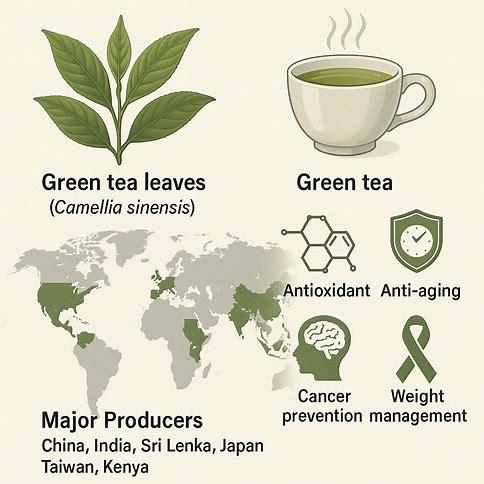
The leaves of Camellia sinensis are used to produce green tea, which remains a popular choice worldwide due to its mild processing and broad consumption and is well recognized for its health-promoting properties. Its origin evidence indicates that its use began in ancient Chinese civilization, around 3000 BC. where classic medical texts such as Shen Nong’s Herbal Classic highlighted its therapeutic and disease-preventive potential. Over time, awareness of these benefits spread globally, establishing green tea as one of the most extensively studied functional foods. Rich in bioactive compounds, particularly polyphenols and catechins, it demonstrates antioxidant, anti-aging, neuroprotective, and stress-resistance activities, thereby strengthening the link between natural products and human wellness [¹].
Currently, more than 30 countries are involved in tea farming and consumed by more than 3 billion people across 160 nations. The major producers among them are China, India, Sri Lanka, Japan, Taiwan, and Kenya contributing significantly to the global economy. Estimates show the global tea market, valued at around USD 200 billion in 2020, may rise above USD 318 billion by 2025 [²]. The popularity of green tea has grown rapidly, supported by its characteristic test and aromatic components and scientific evidence of its antioxidant, anti-inflammatory, and antimicrobial benefits, along with reported roles in cancer prevention, anti-aging, and weight regulation [³,?]. Its chemical profile is highly detailed and multifaceted.It comprises Proteins make up about 15–20% of the dry weight, while amino acids account for 1–4%. such as theanine, glutamic acid, and tryptophan, and carbohydrates make up approximately 5–7% of the total. Green tea isn’t just about its famous catechins its makeup is a mix of many everyday nutrients too. It has basic carbs like cellulose and pectins, along with natural sugars such as glucose and sucrose. Around five percent of its content comes from minerals and trace elements, including calcium, magnesium, iron, zinc, selenium, and fluorine.Beyond that, it also carries tiny amounts of fats (like linoleic and α-linolenic acids), a few sterols, vitamins B, C, and E, natural color-giving pigments, and some aroma-forming volatile compounds. The fresh leaves also supply 3–4% alkaloids, chiefly the methylxanthines caffeine, theobromine, and theophylline [?,?]. Additionally, green tea is rich in phenolic acids, particularly gallic acid, and a characteristic amino acid, theanine [?].Owing to this chemical complexity, accurate analytical methods are essential for the quantification of its functional components. The assessment of tea polyphenols often relies on spectrophotometry and HPLC, which are specified in international and national standards including ISO 14502-1:2005, ISO 14502-2:2005, and GB/T 8313-2018 standard methods, forming the basis of tea science. However, as research has advanced, the demand for more precise quantification of tea’s bioactive compounds has increased. Recent developments in analytical technologies, particularly tandem and High-resolution mass spectrometry (HRMS) offers markedly improved accuracy, sensitivity and resolution of compounds. These advancements enable rapid, high-throughput, and reliable quantification while overcoming the limitations of traditional spectrophotometric and chromatographic methods affected by complex matrices and structurally similar compounds [?]. Given the limitations of conventional techniques, the present study employs High-performance liquid chromatography that enables accurate quantification determination of key phytochemical groups such as catechins and caffeine that characterize green tea
Phytochemistry of Green Tea
Tea contains numerous health-promoting and pharmacologically active constituents. Over 500 compounds have been reported in tea since the early 19th century, made up of a highly complex mixture that includes hundreds of organic substances as well as over forty inorganic constituents [?]. As a non-fermented variety, Green tea maintains most of the inherent chemical constituents derived from the tea leaf. This section concentrates on the phytochemistry derived from green tea and categorizes its principal biologically active components.
Tea-derived polyphenols
The term “tea polyphenols” describes collectively to the various polyphenolic constituents present inside green tea. There are approximately 30 different types, primarily comprising anthocyanins, phenolic acids, catechins and flavonoids [?]. Green tea yields the highest levels of these polyphenols, ranging from 20–30%, making it a potent natural antioxidant.
Tea Catechins compounds
Tea contains several key catechin derivatives, with compounds such as C, EC, EGC, ECG, and EGCG forming the principal group of polyphenols. Extensive research indicates that these molecules EGCG in particular—contribute significantly to the beverage’s biological activity, including its strong antioxidant capacity and its reported antiviral and anticancer effects. [¹?].
Flavonoids compounds
Flavonol glycosides occur in green tea at relatively high levels., initially myricetin and quercetin glycosides as well as glycoside with benzyl group [¹¹,¹²]. These glycosides are composed of monosaccharides such as glucose, galactose, rhamnose, and arabinose, as well as disaccharides or trisaccharides [¹³]. Anthocyanins, which are water-soluble pigments and a subgroup of flavonoids, are present in tea in low amounts. However, their pronounced bitterness significantly influences the overall quality of tea [¹?].
Phenolic Acids
Currently, research focusing on phenolic acids found in green tea is limited. Although the levels in green tea are fairly low, these acids encompass a variety of components, including chlorogenic acid, quinic acid,p-coumaric acid,gallic acid, ellagic acid, caffeic acid, and tea gallate [¹?].
Alkaloids
Tea primarily contains purine alkaloids, with caffeine serving as the primary abundant, ranging from 2 to 5%. It also includes small amounts of theobromine as well as theophylline. These three alkaloids are chiefly responsible for the stimulating effects of tea [¹?].
Amino Acids
Amino acid type and concentration are key factors influencing tea quality. Tea contains around 1–4% amino acids. To date, 26 Amino acids are widely recognized and identified, Tea contains a mixture of amino acids, comprising both the twenty protein-forming types and several non-protein varieties. Among these, theanine, glutamic acid, arginine, serine, and aspartic acid are present in comparatively higher amounts [¹?]. Theanine and γ-aminobutyric acid (GABA) are particularly notable because they exhibit neuroprotective properties [¹?,¹?]. Theanine alone contributes to nearly half of the total amino acid content in tea., while GABA is present in lower amounts. Chen et al. analyzed free analysis of tea amino acids carried out with an amino acid analyzer and found there is no major variation in amino acid content between green and black tea [²?].
Carbohydrate
The mild sweetness of tea is attributed to trace amounts of simple sugars such as glucose, fructose, galactose, and sucrose. However, the majority of its carbohydrate content consists of polysaccharides mainly cellulose, starch, and pectin which remain largely insoluble in hot water [?].
Aromatic Ingredients
The compounds responsible for green tea’s aroma are primarily volatile aromatic substances. Although these aroma components constitute Just a small share of green tea, about 0.005% to 0.020%, their composition is highly complex [²¹]. Numerous studies have analyzed the green tea’s volatile fraction, and new components continue to be discovered and characterized.
naturally occurring acids
In green tea, the water-soluble organic acids play a major role in shaping both the taste and the aromatic character of the brew. Studies indicate that more than forty different organic acids have been identified from tea material, several of which appear freely in the infusion itself, while over thirty contribute specifically to the aromatic component. Among the volatile acids, compounds such as butyric acid, hexenoic acids, and acetic acid are recognized for their influence on the aroma profile.
Mineral Elements
Ash represents the inorganic component of tea and is primarily made up of mineral elements and their corresponding oxides. It is widely used as a benchmark for export-grade quality. Phosphorus and potassium occur in the highest concentrations, whereas calcium , magnesium , iron , manganese , aluminum , sulfur, and silicon appear in moderate Since these minerals participate in vital metabolic functions in the plant and contribute to various physiological mechanisms in humans, they have attracted significant attention from researchers.
Others
Besides the previously mentioned chemical constituents, green tea also contains various vitamins, including vit B, vit C, and vit E; glucosidases and lipoxidases enzymes [²²]; and chlorophyll, a bio-pigment naturally present in leaves and regarded as non-toxic [²?].
Table 1. Chemical profile of Leaves of the Camellia sinensis plant
|
Category |
% content in green tea |
Key components |
Functions |
|
Polyphenols |
20-30 |
Catechins (EGCG, EC, ECG, EGC), flavonoids, anthocyanins, phenolic acids |
Antioxidant, anti-cancer, bitter taste. |
|
Alkaloids |
2-5 |
Caffeine, theophylline, theobromine |
Stimulant, refreshing effect. |
|
Amino acids |
1-4 |
Theanine, glutamic acid, arginine, serine, aspartic acid Flavor, |
neuroprotective. |
|
Carbohydrates |
7 |
Glucose,fructose,sucrose,cellulose, starch, pectin |
Sweet taste, structural role |
|
Aromatic compounds |
0.005-0.020 |
Linalool,geraniol, benzyl alcohol, hexanal, |
Aroma, flavor quality. |
|
Organic compounds |
Variable |
Acetic acid, butyric acid, hexenoic acid. |
Taste & aroma. |
|
Minerals |
4-7 |
iron,magnesium,manganese, zinc,phosphorus,calcium,copper, and fluorine. |
Essential minerals. |
|
Vitamins & Others |
2-3 |
Vitamin B, C, E, enzymes, chlorophyll. |
Antioxidant, pigment, health benefits. |
Chemical ingredients reported in green tea showing specific pharmacological activities.
Green tea (Camellia sinensis) is rich in a variety of bioactive phytochemicals that contribute to its diverse pharmacological properties [²?,²³]. The major chemical constituents include polyphenols, alkaloids, amino acids, and other minor compounds such as phenolic acids and polysaccharides [²?,²?]. Among these, catechins are the most plentiful and biologically active polyphenols, mainly including EGCG, ECG, EGC, and EC [²?,²?]. These catechins demonstrate strong anti-inflammatory, antioxidant, benefits against cancer development and cardiac stress, primarily achieved by reducing the impact of harmful reactive molecules and regulation of cellular signaling mechanisms [²?,²³]. Other constituents like caffeine and theobromine act as central nervous system stimulants and contribute to enhanced alertness and metabolism [²?]. The amino acid L-theanine is known for its neuroprotective and stress-reducing properties [²?]. Meanwhile, gallic acid and tea polysaccharides possess notable antioxidant, anti-diabetic, and immunomodulatory activities [²³]. Together, these chemical ingredients act synergistically to produce the therapeutic potential associated with green tea consumption [²?,²³].
Table 2. Chemical ingredients reported in green tea showing their pharmacological activities.
|
Compounds |
Structure |
Class |
Pharmacological activity |
|
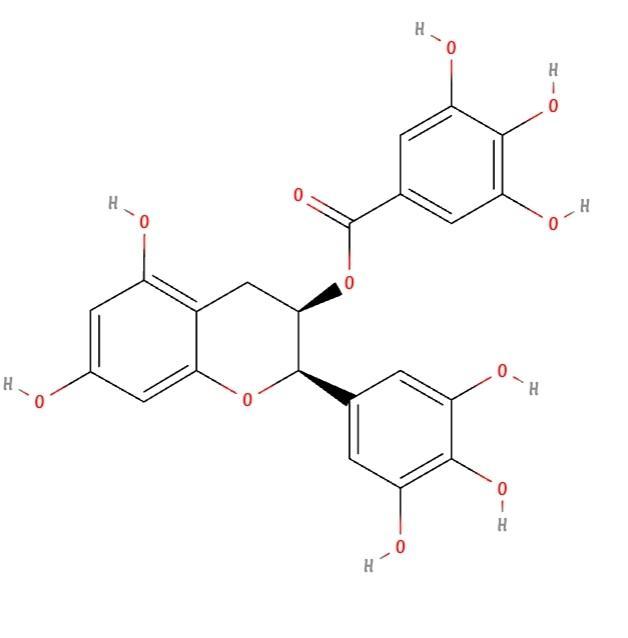
Epigallocatechin gallate (EGCG) |
|
Polyphenol / Catechin |
anti-inflammatory, anticancer, neuroprotective |
|
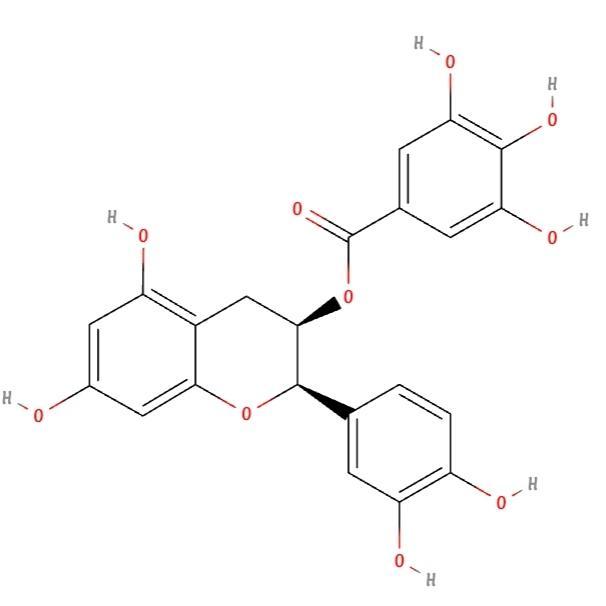
Epicatechin gallate (ECG) |
|
Polyphenol / Catechin |
Antioxidant, cardioprotective, anti-diabetic
|
|
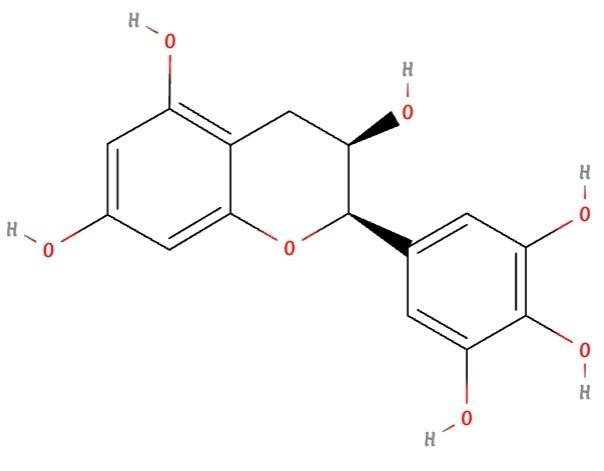
Epigallocatechin (EGC) |
|
Polyphenol / Catechin |
Antimicrobial, antioxidant |
|
Caffeine |
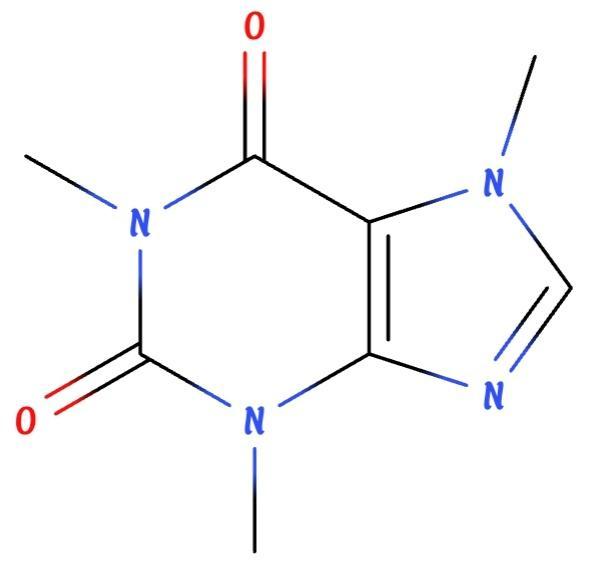
|
Alkaloid |
CNS stimulant, increases metabolism |
|
L-Theanine |
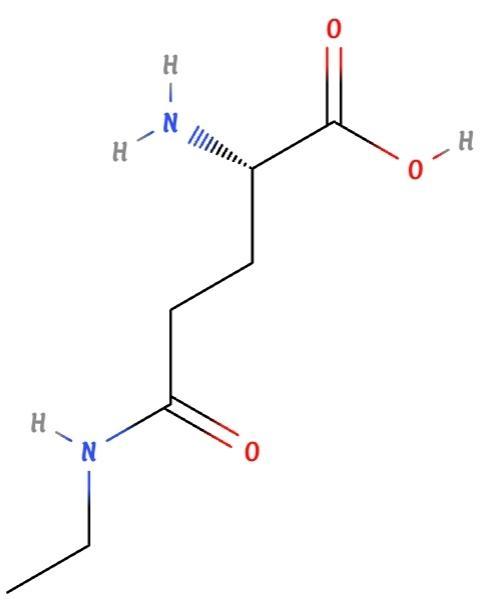
|
Amino acids |
Anti-stress, neuroprotective, relaxing |
|
Gallic acid |
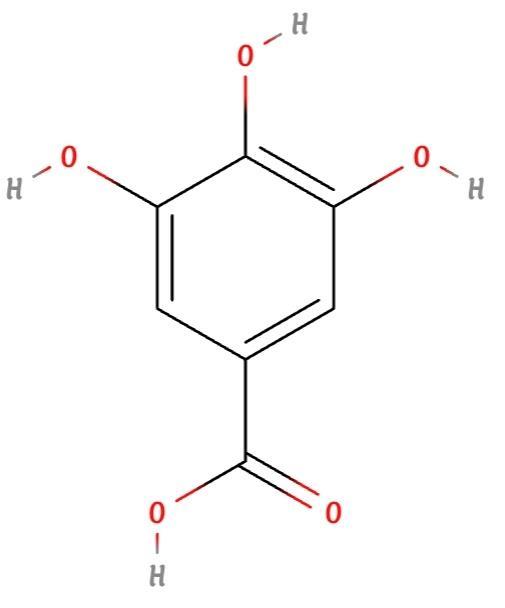
|
Phenolic acid |
Antioxidant, hepatoprotective |
|
Theobromine |
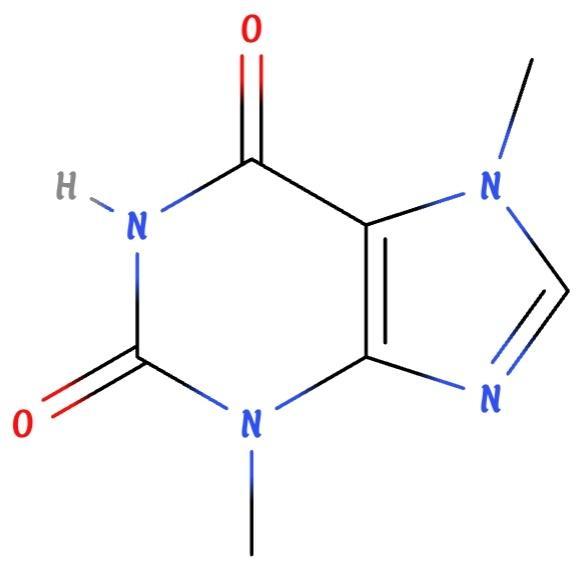
|
Alkaloid (Methylxanthine) |
Bronchodilator, mild diuretic |
|
Tea polysaccharides |
|
Carbohydrate |
Anti-diabetic, immunomodulatory |
Pharmacological activities of green tea.
Antioxidant Effects
Green tea polyphenols, theanine, and caffeine inhibit copper-catalyzed LDL peroxidation, with potency ranked as polyphenols > theanine > caffeine [30]. Antioxidant capacity has been confirmed using DPPH and TOSC assays, with EGCG and ECG showing the strongest effects [²²,³¹]. Tea polysaccharides (TLPS, TFPS, TSPS) also demonstrated dose-dependent superoxide scavenging [³²]. Animal studies reported that green tea extract enhanced antioxidant enzymes and protected against brain oxidative stress and hepatotoxicity [³³,³?].
Anticancer Effects
Green tea shows activity against multiple cancers . Mechanisms include:
(1) Inhibiting migration/invasion – EGCG suppressed HeLa proliferation and reduced metastasis in mice [?,³?].
(2) Promoting apoptosis – EGCG triggered cell death in colon and ovarian cells via caspase and MAPK pathways [²¹,³?].
(3) Anti-angiogenesis – EGCG reduced VEGF signaling and tumor growth [³?].
(4) Restricting proliferation – EGCG induced G0/G1 arrest in prostate and gastric cancer cells [¹,³?].
(5) Other mechanisms – Green tea polyphenols reduced tumor volume in oral cancer models and inhibited inflammatory pathways in lung cancer [³?].
Anti-Diabetic Effects
Green tea improves glucose regulation via:
(1) Enhancing insulin resistance – improving glucose uptake and gene regulation [??].
(2) Improving glucose metabolism – lowering blood sugar and increasing glycogen storage[?¹].
(3) Stimulating insulin secretion – polysaccharides promoted insulin release [?²].
(4) Preventing complications – protecting heart and neural tissues from diabetic damage [?³].
Antibacterial Effects
Green tea catechins, especially EGCG, inhibit pathogens like H. pylori, M. tuberculosis, foodborne bacteria, and skin/oral pathogens [??]. Activity is linked to bacterial adhesion prevention and gene regulation.
Antiviral Effects
EGCG disrupts viral entry, protease activity, and aggregation. It is active against HIV, influenza, HBV, NoV, HAV, ZIKV, and has been suggested as supportive therapy for COVID-19 [¹?,??-??].
Neuroprotective Effects
EGCG prevents aggregation of amyloid-β, polyglutamine, and α-synuclein proteins associated with Parkinson's and Alzheimer's Disease . It also enhances antioxidant defenses, promotes neurite outgrowth, and improves memory in animal models [??,²²].
Effects on the Immune System
EGCG suppresses conventional T-cell expansion while promoting the induction of regulatory T-cell population development [??,??]. Green tea extract reduced anaphylactic shock in mice and showed benefit in autoimmune models [?¹,?²].
Other Pharmacological Effects
Green tea polyphenols also exhibit additional activities such as antimutagenic, antithyroid, diuretic, bone-protective, and anti-protozoal effects. These actions are linked to their antioxidant potential, modulation of enzyme activity, and enhancement of renal and skeletal functions, as demonstrated in various experimental studies [?³].
Experimental Materials and methodology
Reagents and Chemicals. The study utilized authenticated standards representing the key tea polyphenols along with caffeine, all sourced from Sigma Chemicals (St. Louis, MO, USA). Analytical procedures were carried out using high-grade solvents such as acetonitrile, methanol, and purified water to ensure consistency in chromatographic performance. The tea samples analyzed in this work were obtained from two recognized sources: the research collections at IHBT (CSIR), India, and the Palampur Cooperative Tea Factory located in Himachal Pradesh. [??]
HPLC Setup and Experimental Parameters
For analytical profiling, a high-performance liquid chromatography system was employed as the main platform because of its reliability in separating and identifying complex phytochemical mixtures. The technique provides strong sensitivity and selectivity, allowing both qualitative interpretation and quantitative estimation of bioactive compounds present in botanical matrices. Its reproducible performance makes it well suited for characterizing and standardizing herbal preparations. [??]To maintain reliability in quantitative and qualitative measurements, the chromatographic method was evaluated for essential analytical characteristics, including precision, accuracy, sensitivity limits (LOD and LOQ), linear behavior across working ranges, and stability under different operating conditions. Earlier RP-HPLC–UV studies have demonstrated that these parameters can be achieved consistently using similar chromatographic strategies. [??]All analyses were performed using a Waters HPLC system configured with two solvent lines, a temperature-controlled chamber for the analytical column, and a Hypersil ODS column (150 × 4.6 mm). Sample loading was carried out through a Rheodyne injector fitted with a 20 µL loop, and detection relied on a photodiode array (PDA) setup. The column was maintained at a steady thermal setting of 35°C during the runs.The mobile-phase setup employed a diluted OPA solution as the initial solvent phase and methanol as the secondary phase. An intentional non-linear change in solvent composition (curve 8) was used: the run began with 15% of phase B, held briefly for two minutes, and then gradually increased to 45% over approximately fourteen minutes. The chromatographic system operated at 1.0 mL/min with an injection volume of 10 µL. Spectra were recorded in the range of 200–400 nm, while quantitative interpretation was based on the signal at 277.5 nm. All instrument control and data handling were managed through Empower 2 software. [??]
Preparation of Standard Mixtures and Calibration Solutions
Primary solutions of the analytes (1 mg/mL) were prepared in 80% acetonitrile. These concentrated preparations were subsequently diluted with water to produce the calibration solutions used for quantification across the study. [??]
Procedure for Preparation Of Sample
A stepwise extraction strategy was used for processing the tea samples. Finely powdered tea was tested with a range of solvents acetonitrile, aqueous ACN (60–90%), water, and methanol to identify the most efficient medium. Among these, 80% ACN yielded the strongest extraction efficiency and was selected for further work.For each sample, approximately 0.2 g of powdered tea was combined with 4 mL of 80% ACN and stirred at 500 rpm for around ten minutes, followed by centrifugation at 1400 rpm for two minutes. This extraction cycle was repeated twice using 3 mL of fresh solvent each time. All extracted portions were pooled and filtered through a 0.45 µm membrane prior to HPLC analysis. Every extraction was conducted in triplicate. The resulting filtrates were subjected to serial dilution with water (pentatonic series) before chromatographic evaluation according to the optimized protocol. [??]
RESULTS WITH DISCUSSION
Development of Method. Initial experiments using isocratic elution failed to adequately separate the compounds of interest, prompting the transition to gradient-based elution. Absorption maxima for the analytes fell between 270 and 280 nm, consistent with earlier reports. [??] Although wavelengths of 210 nm and 280 nm have often been used in previous studies, a monitoring wavelength of 280 nm was selected for evaluating mobile-phase performance. [??–??]Efficient resolution of catechin derivatives typically requires the combined use of an organic solvent and an acidic modifier. Several acid–solvent combinations were evaluated by pairing dilute acetic acid, formic acid, or OPA with methanol or acetonitrile. Acetic acid–methanol mixtures were unable to fully resolve the early-eluting compounds, and formic acid–methanol resulted in excessive system pressure. Similar limitations were observed with acid–ACN combinations, indicating that these solvent systems were not suitable for dependable separation.The OPA–methanol composition produced clearer peak resolution while maintaining acceptable system pressure, making it superior for separating closely eluting catechin components. In contrast, OPA–ACN mixtures shortened retention times but compromised resolution due to ACN’s stronger elution power. Therefore, OPA–methanol was selected as the optimized mobile-phase system.Lowering the concentration of OPA accelerated the elution of several constituents in the mixture, while others remained largely unaffected. Comparative chromatograms for 0.1% and 0.05% OPA mixtures are shown in Figure 2. Based on the enhanced separation performance and reduced operating time, the 0.05% OPA formulation was finalized as the primary solvent phase, consistent with earlier findings. [58] This adjustment also decreased the total runtime significantly compared with previous reports using related mobile-phase strategies. [??]
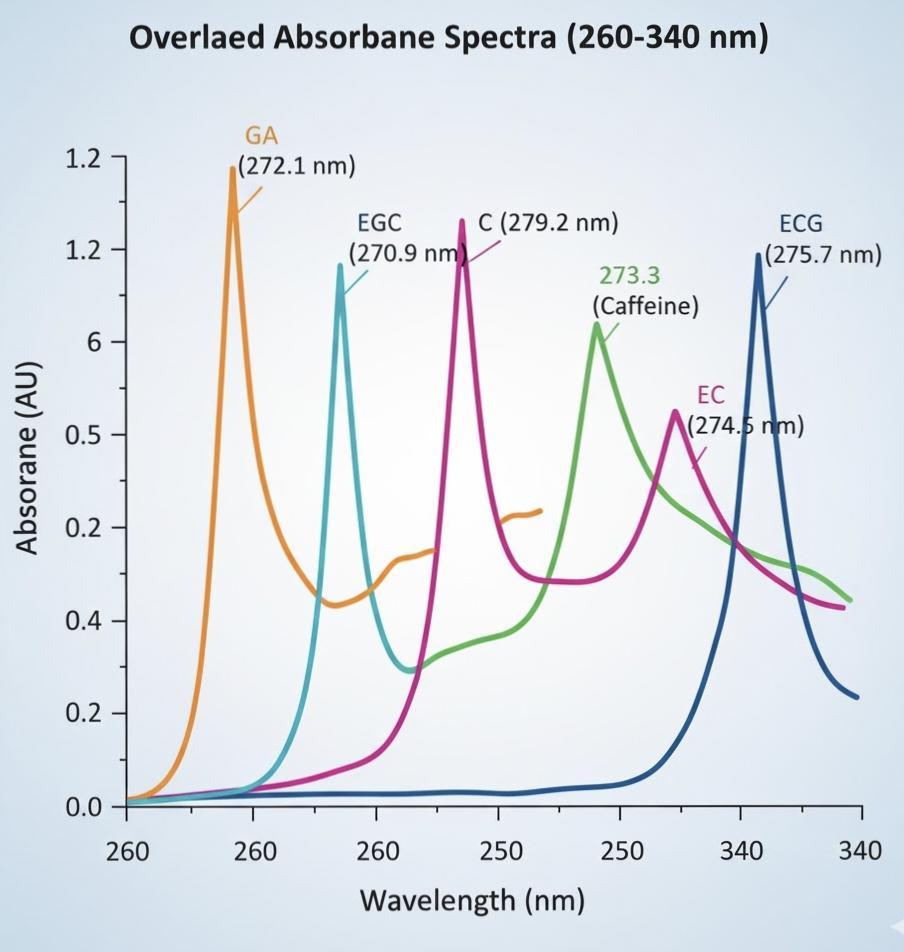
Figure 3- Overlaid absorbance spectra of the analytes present in the standard mixture, each displaying distinct absorption maxima within the 270–280 nm range, corresponding to their respective molecular characteristics.
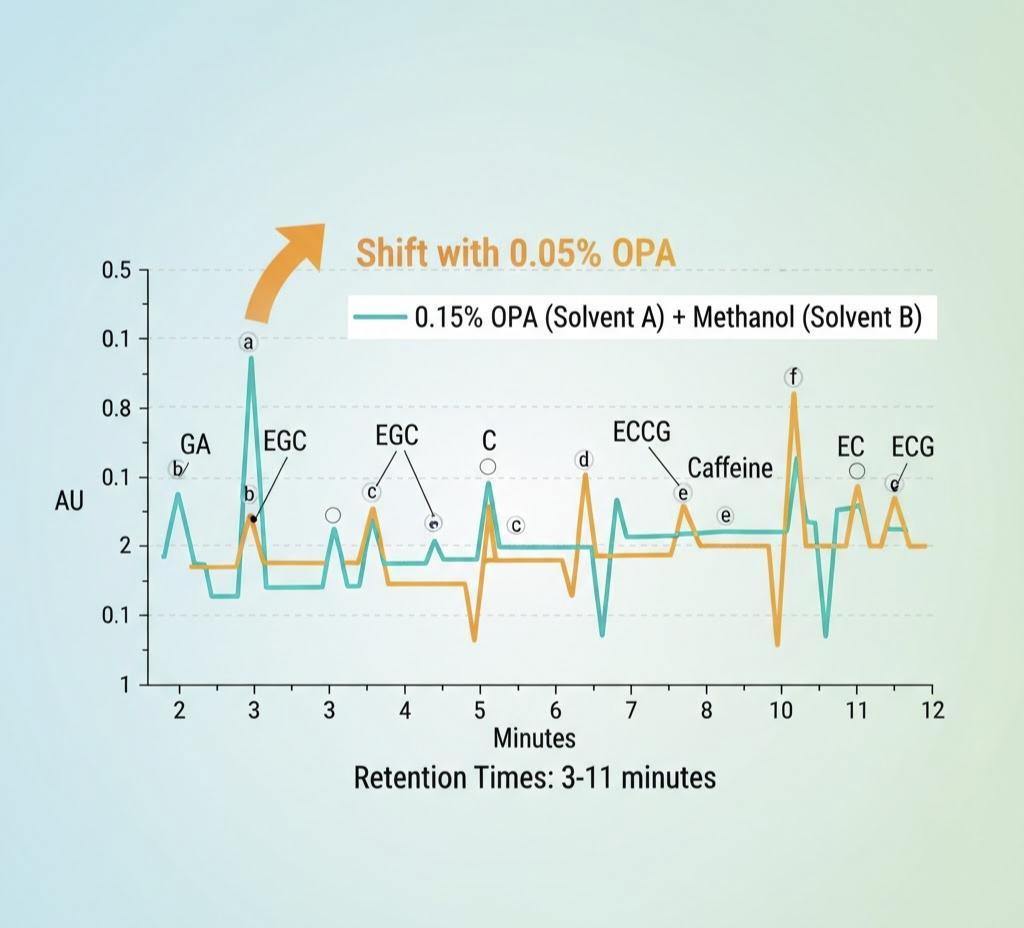
FIGURE 4. - Overlaid chromatographic profiles of the standard sample using 0.1% OPA and 0.05% OPA as solvent A,with methanol as solvent B. The peaks are marked according to their retention order for identification purposes.
Optimization Of Experimental Procedure
Solvent Used In Extraction
Noticeable differences in the recovery of caffeine, catechin derivatives, and gallic acid were observed when various extraction solvents were tested. The solvents evaluated included acetonitrile, water, aqueous mixtures of ACN (60–90%), and 80% methanol. Among all options, the 80% ACN mixture consistently produced the strongest extraction performance. Although earlier reports often highlight the usefulness of water-rich systems for isolating polyphenols from tea [??,??], the present work found that neither pure ACN nor aqueous methanol produced adequate recovery. In contrast to the findings of Fernández et al. [?¹] and Wang et al. [?¹], who reported good extraction efficiency using ACN–water combinations (1:1 and 60:40), the current experimental setup showed that 80% ACN was markedly more effective.
Sample Strength
Organic solvents are frequently used in HPLC to help dissolve sample components, but a diluent that is stronger than the mobile phase can distort peak shape, especially for compounds that elute early when the mobile phase is highly aqueous. Even small differences in diluent strength can influence peak width and symmetry [42].At the beginning of the study, the tea samples were dissolved directly in 80% ACN [64], which resulted in noticeable peak distortion, as seen in Figure 3a. When the samples were further diluted with water, the peak profile improved substantially and the first eluting signal (corresponding to GA) appeared sharper and more distinct (Figure 3b). This modified dilution strategy was therefore adopted for all subsequent analyses.
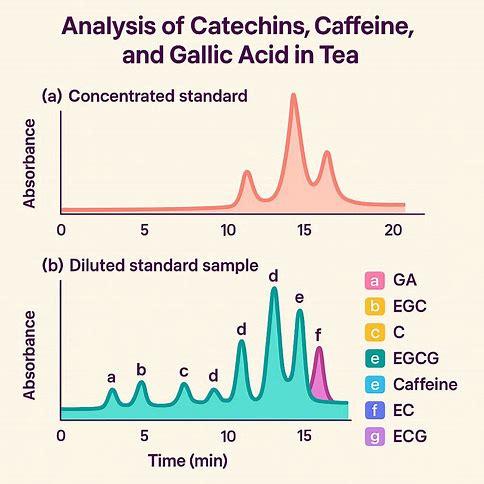
Figure 5: (a) Chromatographic profile of the concentrated standard solution and (b) the elution profile recorded after dilution. The labeled peaks represent the major tea-derived constituents detected in the analysis.
Thermal profile Of The Column
In reversed-phase LC, adjusting the operating temperature of the separation chamber can influence both the clarity of peak separation and the overall run time [?³,??]. Figure 4 compares the output profiles at two different heat settings—30 °C and 35 °C. Increasing the chamber temperature to 35 °C shortened the total run by about a minute (from roughly 11 min to 10 min) and also produced a more distinct split between the signals corresponding to EGCG and caffeine.To examine this trend more closely, a simplified mixture containing only these two compounds was analyzed at 30 °C, 35 °C, and 40 °C. The degree of separation improved progressively, with the mid-level setting (35 °C) showing a substantial jump in resolution compared to 30 °C, while the shift from 35 °C to 40 °C produced only a minor additional gain. Based on this pattern, the mid-range setting was considered the most practical and effective condition for routine work.
Elution Profile
Although linear gradients are usually preferred because they are easier to fine-tune, non-linear (curved) gradients can sometimes outperform them—especially when compounds elute too closely or when certain parts of the chromatogram appear sparsely populated. A steep rise at the beginning often compresses peaks and reduces separation, while a more gradual change in solvent strength later in the run tends to spread out the bands and improve clarity [55].
Therefore, multiple gradient shapes were tested to determine which profile allowed the cleanest separation for EGCG, caffeine, and EC.
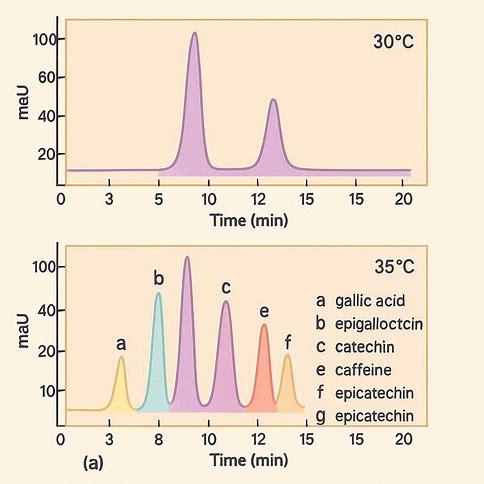
FIGURE 6- Chromatographic profiles of the standard solution obtained at two temperatures, 30°C (a) and 35°C (b). The marked peaks represent the analytes present in the mixture
Gradient Profile Optimization
As illustrated in Figure 5a, using a curved gradient (profile 8) where the proportion of solvent B increases gently after a brief initial hold produced noticeably cleaner separation. This approach also resulted in a stronger signal relative to background noise, nearly doubling the clarity of detection compared with earlier trials. An interesting effect observed under this setting was the shift in the order in which caffeine and EGCG appeared, a reversal that may be associated with subtle, time-dependent pH variations in the solvent mixture [??,??,??]. The other constituents retained their usual elution sequence, allowing the entire set to be resolved within a run time similar to that of a standard linear program but with substantially better peak definition.
Wavelength Selection. Consistent with previous literature [??], the major constituents showed their strongest absorption in the region between 270–280 nm, although many studies also use 210 nm for detection [??,??,??]. To determine the most reliable setting, calibration curves were constructed at six wavelengths: 210, 270, 272.5, 275, 277.5, and 280 nm. All curves demonstrated good linear behavior, with the corresponding correlation values summarized in Table 3.While lower wavelengths such as 210 nm offer higher sensitivity, they can introduce interference from other sample components. Among the tested wavelengths, 277.5 nm gave the highest average correlation (0.984), and was therefore chosen for the quantitative measurements and later validation work on the tea samples.
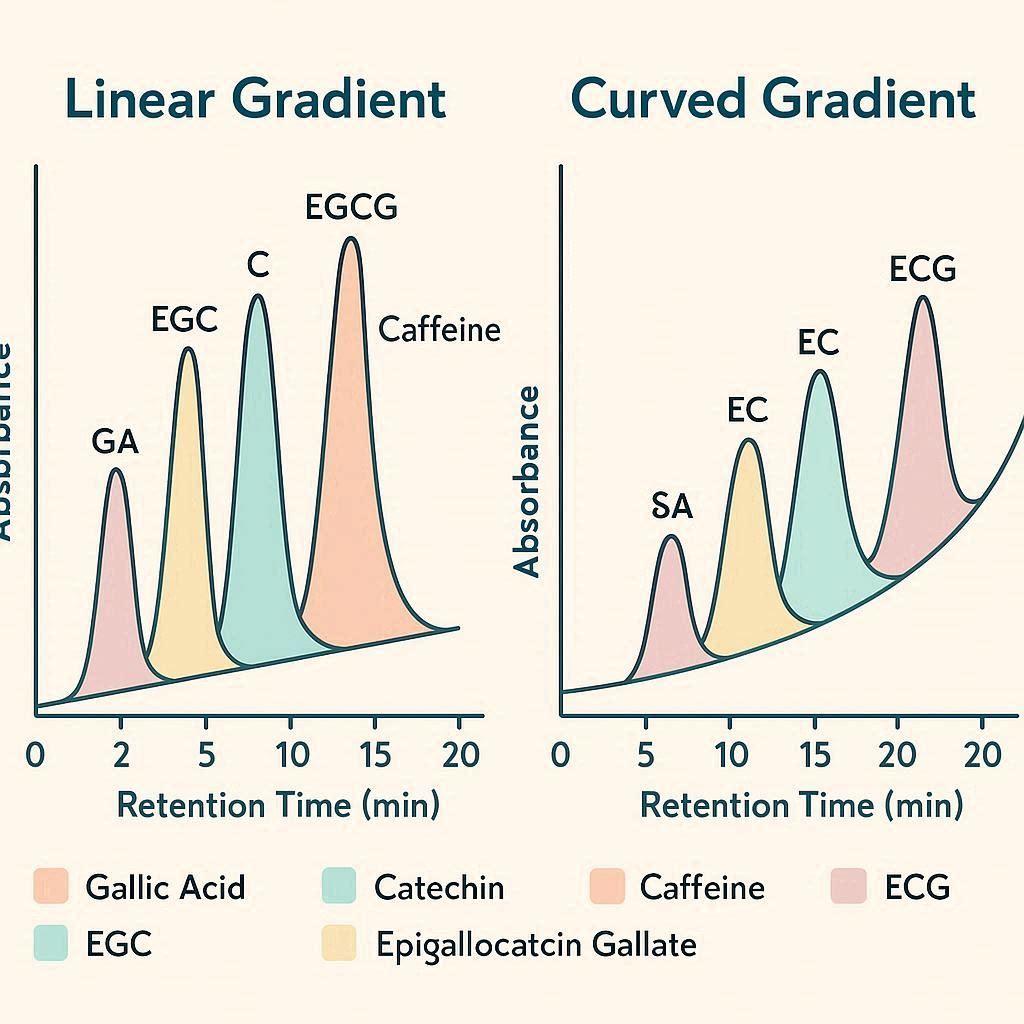
FIGURE 5 - Chromatographic profiles of the standard solution obtained using (a) a linear gradient and (b) a curved gradient. The peaks indicate the individual analytes present in the mixture.
TABLE 2 Values represent mean ± standard deviation of five injections. Linear gradient indicates conventional elution, whereas curved gradient refers to a concave gradient profile applied to improve resolution and signal-to-noise ratio.
|
Analyte |
Linear elution profile |
Curved elution profile |
|
Gallic acid |
9.98 ± 0.02 |
60.97 ± 0.23 |
|
Epigallocatechin |
1.15 ± 0.01 |
2.50 ± 0.04 |
|
Catechins |
3.04 ± 0.15 |
8.50 ± 0.01 |
|
Epigallocatechin gallate |
8.50 ± 0.31 |
29.44 ± 0.77 |
|
Caffeine |
18.80 ± 0.10 |
55.70 ± 0.21 |
|
Epicatechin |
2.80 ± 0.01 |
12.20 ± 0.07 |
|
Epicatechin gallate |
5.05 ± 0.01 |
28.97 ± 0.03 |
TABLE 3 Calibration correlation coefficients (R) for each analyte at six detection wavelengths. Values indicate strong linearity in standard curves across all wavelengths.
|
Compound |
210nm |
270nm |
272.5nm |
275nm |
277.5nm |
280nm |
|
Gallic acid |
0.980 |
0.983 |
0.973 |
0.972 |
0.972 |
0.979 |
|
Epigallo catechin |
0.980 |
0.980 |
0.958 |
0.970 |
0.980 |
0.976 |
|
Catechin |
0.990 |
0.984 |
0.987 |
0.992 |
0.992 |
0.994 |
|
Caffeine |
0.981 |
0.981 |
0.982 |
0.982 |
0.985 |
0.982 |
|
Epigallocatechin gallate |
0.976 |
0.975 |
0.982 |
0.981 |
0.989 |
0.979 |
|
Epicatechin |
0.978 |
0.957 |
0.978 |
0.985 |
0.991 |
0.985 |
|
Epicatechin gallate |
0.980 |
0.982 |
0.977 |
0.982 |
0.982 |
0.981 |
Validation Of Analytical Procedure
The proposed method was evaluated for repeatability, accuracy, and sensitivity, and the corresponding statistical data are summarized as below.
Gallic acid showed the earliest elution, appearing at around three minutes, with a high recovery close to 98%.
Epigallocatechin (EGC) and catechin (C) eluted in the mid-region (approximately 7–8 minutes) and both exhibited excellent recoveries, nearing 99–100%.
Caffeine appeared as a later peak, eluting at around 11.3–11.5 minutes, and demonstrated very high precision with slightly above 100% recovery, indicating strong method consistency.
The gallate derivatives — EGCG, EC, and ECG — eluted between 12 and 15 minutes, showing consistent recoveries in the 96–99% range.
Sensitivity parameters were within acceptable analytical limits, with LOD values generally between 1–7 µg/mL and LOQ values falling approximately between 3–20 µg/mL, confirming good detectability for all analytes
Repeatability: Introduction of standard solution for five times is done under described chromatographic setup. The maximum RSD was 0.82% for standards and 1.9% for tea extracts, reflecting excellent repeatability of the method.
Accuracy: The tea extract was spiked with three varying dilutions of the standard solution to carry out recovery experiments. The mean recovery rates ranged from 97.83%-100.54%, with RSD values between 0.16% and 5.80%, confirming the method’s accuracy.
Sensitivity: Based on the signal-to-noise (S/N) ratio and according to ICH guidelines, LOD and LOQ were determined. LOD ranged between 1.04 and 22.81 µg/mL, and LOQ ranged from 3.47 to 76.05 µg/mL (Table 4), confirming the method’s sensitivity for tea component analysis.
Limitations. Although HPLC is widely regarded for its precision and reproducibility, its performance with green tea extracts is not without constraints. Variations in how samples are extracted, the solvents chosen, the type of column used, and even small adjustments in operating conditions can influence the final quantification of individual components. Another drawback is the absence of a fully unified analytical framework for green tea, which makes it difficult to directly relate laboratory measurements to real therapeutic outcomes due to limited clinical standardization.
Future Scope.
Going forward, there is a clear need to establish consistent analytical protocols and verified marker compounds that can be used across studies and industries. Incorporating modern hybrid techniques such as LC–MS, UPLC, and HPTLC—may further improve sensitivity, structural identification, and overall reliability. Strengthening the connection between analytical profiling and clinical or pharmacodynamic evaluations will also be essential to ensure that standardized green tea preparations are both safe and therapeutically meaningful.
CONCLUSION:
Green tea (Camellia sinensis) contains a wide array of biologically active constituents, including polyphenols, alkaloids, and other secondary metabolites that contribute to its health-promoting properties. However, the composition of these compounds can shift significantly depending on agricultural practices, processing steps, and extraction methods, making systematic evaluation essential.
HPLC remains one of the most dependable tools for assessing the quality and consistency of green tea extracts, offering accurate measurement of key markers such as EGCG and caffeine. Its role in both research and industrial quality control is well established. Looking ahead, combining HPLC with complementary analytical platforms—particularly mass spectrometry—may further enhance the precision, comparability, and global standardization of green tea–based products.
REFERENCES

Sakshi Dhotre*, T. K Kedar, Sanjay K. Bais, Standardization of Green Tea Extract: An Overview of HPLC-Based Approaches, Int. J. of Pharm. Sci., 2025, Vol 3, Issue 12, 1335-1354 https://doi.org/10.5281/zenodo.17840256
 10.5281/zenodo.17840256