
We use cookies to ensure our website works properly and to personalise your experience. Cookies policy
QIS Group of Institutions, QIS College of Pharmacy, Prakasam (Dt.), Ongole
This research focused on the development and validation of innovative UV spectrophotometric techniques for the quantification of sitagliptinin pharmaceutical formulations, adhering to ICH Q2 (R1) guidelines. The zero-order derivative spectrophotometric approach proved to be cost-effective and reproducible for both active pharmaceutical ingredients. Key validation parameters, such as accuracy, precision, specificity, and linearity, were rigorously assessed and confirmed compliance with both ICH and USP standards. The methods demonstrated simplicity, reliability, and precision, making them well-suited for routine analytical procedures with high accuracy. The precision of the methods, assessed via repeatability, was validated by analyzing multiple aliquots from homogeneous samples, yielding satisfactory results. When applied to sitagliptin tablet formulations, the methods showed no interference from excipients, highlighting their practical utility in pharmaceutical analysis. Compared to existing techniques, these methods offer significant advantages in terms of sensitivity, simplicity, and cost-efficiency. Moreover, they require only basic instrumentation, which reduces the need for complex procedural steps, additional reagents, or lengthy analysis times. The developed methods' affordability and minimal maintenance requirements make them highly suitable for use in small-scale pharmaceutical industries, ensuring consistent therapeutic efficacy in drug formulations. The primary focus of this study was on optimizing the methods to improve their performance, ensuring that the final methods could be quickly validated and efficiently applied to the analysis of both preclinical and commercial samples. Through a review of the current literature on the analysis of sitagliptin, it was evident that there was a gap in the availability of validated methods for their analysis in bulk and pharmaceutical dosage forms. This study addresses that gap by offering refined UV spectrophotometric methods that meet the required standards for quantitative analysis, demonstrating
Sitagliptin is a DPP-4 (dipeptidyl peptidase-4) inhibitor recently approved for the treatment of type 2 diabetes. As with other DPP-4 inhibitors, its mechanism of action involves increasing the levels of incretin hormones, including glucagon-like peptide-1 (GLP-1) and gastric inhibitory polypeptide (GIP). Sitagliptin effectively lowers HbA1c, fasting glucose, and postprandial glucose, both when used as monotherapy and in combination with other oral antidiabetic drugs. It works by stimulating insulin secretion when blood glucose levels are elevated and suppressing glucagon release. Clinical studies have shown that sitagliptin is weight-neutral. This article explores the drug's mechanism, pharmacological profile, and its clinical efficacy and safety in managing type 2 diabetes.
Exploiting GLP-1’s Therapeutic Potential in Type 2 Diabetes
Although GLP-1 itself is not viable for use in treating type 2 diabetes due to its extremely short half-life, two primary approaches have been developed to harness its benefits. One method involves using GLP-1 analogs or incretin mimetics that are resistant to DPP-4 degradation. These peptides, such as exenatide (derived from the Gila monster’s saliva) and liraglutide (developed by Novo Nordisk), are injected to mimic the action of GLP-1. Exenatide, approved as Byetta® for patients with uncontrolled type 2 diabetes on metformin, sulfonylureas, or a combination, shares a high degree of similarity to GLP-1 and functions as a GLP-1 receptor agonist. Liraglutide, currently in phase III trials, is also being evaluated for its safety and efficacy. Another approach is the oral inhibition of DPP-4 to maintain elevated levels of active GLP-1. Sitagliptin, a highly selective DPP-4 inhibitor, is approved for type 2 diabetes treatment. Other DPP-4 inhibitors, such as vildagliptin, are also nearing approval.
Pharmacological Profile of Sitagliptin
Sitagliptin (chemical name: (2R)-4-Oxo-4-[3-(trifluoromethyl)-5,6-dihydro [1,2,4] triazolo[4,3-a] pyrazin-7(8H)-yl]-1-(2,4,5-trifluorophenyl) butan-2-amine) demonstrates a high degree of selectivity for DPP-4, with an IC50 of 18 nm, and no significant affinity for other DPP enzymes like DPP-8 and DPP-9. It has been approved for use in the US and Europe for managing type 2 diabetes. Studies show that sitagliptin is well-tolerated in both healthy volunteers and patients with type 2 diabetes, with no significant adverse events at doses taken once or twice daily. The drug's pharmacokinetic profile reveals that steady-state plasma concentrations are reached after about 3 days of daily administration, and its accumulation rate is modest. About 75% of an oral dose is excreted unchanged in the urine, while the remaining amount is metabolized by cytochrome enzymes CYP 3A4 and CYP 2C8. Sitagliptin's half-life is 12–14 hours, and no significant drug–drug interactions have been observed, particularly with other antihyperglycemic agents. The typical daily dosage ranges from 50 mg to 200 mg, with a ≥80% inhibition of DPP-4 for up to 24 hours, leading to a 2- to 3-fold increase in active GLP-1 levels postprandially.
Clinical Evidence of Sitagliptin’s Efficacy in Type 2 Diabetes
Sitagliptin has been shown to improve several key glycemic markers in clinical studies, including HbA1c, fasting glucose, and postprandial glucose. In a 24-week study, doses of 100 mg and 200 mg once daily reduced HbA1c by 0.79% and 0.94%, respectively, and significantly decreased fasting glucose by 17.1 mg/dL and 21.3 mg/dL. In a standardized meal-tolerance test, postprandial glucose was reduced by 46.7 mg/dL and 54.1 mg/dL for the 100 mg and 200 mg doses, respectively. Sitagliptin also improved beta-cell function, insulin and C-peptide responses, and the proinsulin/insulin ratio in patients with type 2 diabetes. Importantly, sitagliptin is weight-neutral, with the 200 mg dose leading to a modest weight reduction of 1.1 kg.
Analytical Method Validation for Pharmaceutical Use
Analytical method validation is essential for ensuring that new methods are reliable, accurate, and suitable for their intended purpose. Validating methods ensures that they support the identity, quality, purity, and potency of drug substances and products, which is critical for drug safety and efficacy throughout their shelf life. The validation process is part of the overall process validation and includes various key steps such as establishing proposed protocols, conducting experimental studies, evaluating analytical results, performing statistical analysis, and preparing a report documenting all findings.
Validation Parameters as Defined by ICH
The International Conference on Harmonization (ICH) has established a consensus document on analytical method validation, which outlines several critical parameters. These include:
These validation parameters help ensure that an analytical method is fit for its intended purpose, providing essential data for pharmaceutical product development and quality control.
MATERIALS & METHODS13,14:
Pure drug samples:
The drug sample of Sitagliptin was received as a gift sample from Aurobindo pharma, Hyderabad, Telangana, India.
Marketed product:
The formulation was purchased from local Apollo pharmacy, Hyderabad, Telangana, India.
Table 01: Chemicals and solvents used
|
S. No. |
Chemicals and solvents |
Manufacturer |
|
1 |
HPLC grade Methanol |
Merck |
|
2 |
HPLC grade Water |
Merck |
|
3 |
HPLC grade Acetonitrile |
Merck |
METHODOLOGY15,16
Selection of Solvent
Several trials were conducted to identify the ideal solvent for dissolving Sitagliptin. A variety of solvents including double distilled water, methanol, and acetonitrile were tested based on the solubility of the drug. Sitagliptin was found to be freely soluble in methanol and double distilled water but insoluble in acetonitrile. Methanol was therefore chosen as the optimal solvent for the spectrophotometric analysis.
Preparation of Standard Stock Solution
An accurate amount of 10 mg of Sitagliptin was weighed and transferred into a 50 ml volumetric flask. It was dissolved in 20 ml of methanol, and the final volume was adjusted to 50 ml with methanol, resulting in a stock solution of 1000 µg/ml. To prepare a secondary stock solution, 1 ml of this primary solution was transferred to a 10 ml volumetric flask, and the volume was adjusted with methanol to give a concentration of 100 µg/ml. These stock solutions were used to prepare further dilutions for the experimental procedure.
Selection of Wavelength (λmax)
A 1 ml aliquot of the standard stock solution was transferred into a 10 ml volumetric flask and diluted to the mark with methanol to achieve a concentration of 10 µg/ml. The resulting solution was scanned across the UV spectrum (200–400 nm) to determine the appropriate wavelength. The absorption maximum (λmax) was observed at 269 nm.
Analytical Method Validation
The primary goal of the validation was to ensure that the method developed was suitable for its intended purpose, as outlined by ICH guidelines. The validation process included evaluating the method for parameters such as linearity, precision, accuracy, repeatability, ruggedness, limit of detection (LOD), and limit of quantification (LOQ).
Linearity
Different concentrations of Sitagliptin solutions were prepared, ranging from 10% to 60% of the standard concentration (1 mg/ml). The absorbance of these solutions was measured, and the absorbance values for both the lowest (10%) and highest (60%) concentrations were recorded in six replicates. A calibration curve of concentration versus absorbance was then plotted.
Repeatability
Repeatability was assessed by preparing six replicates of 1 µg/ml Sitagliptin solution. The absorbance was measured at 280 nm, and the results were analyzed for consistency.
Precision
Precision studies were performed to evaluate the method's reproducibility. Intraday precision was assessed by preparing six different concentrations (10, 20, 30, 40, 50, 60 µg/ml) of Sitagliptin and measuring their absorbance five times in one day. For interday precision, the same six concentrations were analyzed over three different days to assess variability between days.
Accuracy
The accuracy of the method was determined through recovery studies. Various amounts (50%, 100%, and 150%) of pure Sitagliptin were added to pre-analyzed tablet formulations. Each solution was prepared in triplicate, and the percentage of recovery was calculated to assess the method's accuracy.
Limit of Detection (LOD) and Limit of Quantification (LOQ)
The LOD and LOQ were calculated based on the response and slope of the calibration curve. The signal-to-noise ratio was used to determine these limits, with a ratio of 3.3 for LOD and 10 for LOQ. The formulas used for these calculations are as follows, according to ICH guidelines:
LOD = 3.3 × σ/S
LOQ = 10 × σ/S
Where:
σ = Standard deviation of the response
S = Slope of the calibration curve
Ruggedness
Ruggedness studies were conducted by analyzing three replicates of 1 µg/ml Sitagliptin using two different analysts and two different instruments. The results were evaluated for reproducibility, and the percentage relative standard deviation (%RSD) was calculated.
Assay for Pharmaceutical Formulation
The pharmaceutical formulation was filtered through Whatman filter paper No. 41. A 0.5 ml aliquot of the filtered solution was transferred to a 10 ml volumetric flask, and the volume was made up to the mark with methanol, resulting in a 0.5 µg/ml solution. The solution was then scanned in the UV range (200–400 nm) at 269 nm. The concentration of Sitagliptin in the formulation was determined using the following formula:
% Assay = (WS × AT × Sample D.F. × Avg. Wt.) / (AS × Standard D.F. × WT × LC) × PS
Where:
WS = Weight of the standard
WT = Weight of the sample
AT = Absorbance of the test solution
AS = Absorbance of the standard solution
Standard D.F. = Standard dilution factor
Sample D.F. = Sample dilution factor
PS = Purity of the working standard (%)
LC = Label claim of Sitagliptin
RESULTS AND DISCUSSION
Zero-Order Derivative Method
Validated analytical methods are essential for the accurate estimation of Sitagliptin in both its active pharmaceutical ingredient (API) form and its pharmaceutical formulations. A simple, rapid, precise, and accurate UV-spectroscopic method has been developed and validated for the estimation of Sitagliptin in tablet dosage forms. The method was applied to a tablet formulation with a label claim of 250 mg of Sitagliptin. In UV-spectroscopic analysis, solubility is a critical factor, and the solubility of Sitagliptin was studied using various solvents. Methanol was selected as the solvent due to its ability to provide the maximum absorbance and a clear, reproducible spectral pattern when compared to other solvents. The marketed formulation was extracted and diluted to ensure the concentration fell within the linearity range. The resulting solution was then scanned and measured at 267 nm. The method demonstrated satisfactory recovery rates and stability, and its linearity was confirmed, making it suitable for routine analysis of Sitagliptin formulations. Solutions of Sitagliptin and its marketed tablet were prepared using methanol, and their UV spectra were recorded by scanning across the 200–400 nm range.
Selection of Solvent
To identify the ideal solvent for dissolving Sitagliptin and its marketed formulation, an overlain spectrum was prepared using various solvents. Among the solvents tested, methanol exhibited the best absorbance for both Sitagliptin and its formulation, providing a clearer and more reliable spectrum. Therefore, methanol was selected as the solvent for the study.
Absorbance Maxima (λmax)
The absorbance maximum (λmax) for Sitagliptin was determined to be 267 nm. The UV spectrum of Sitagliptin, as shown in the figure, clearly illustrates the absorbance at this wavelength, which is crucial for the accurate quantification of Sitagliptin using the developed UV-spectroscopic method.
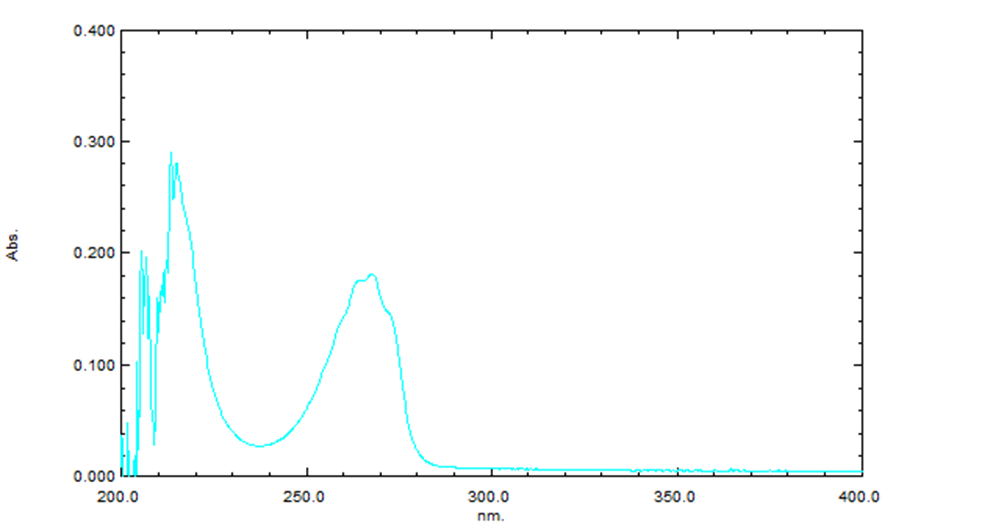
Figure-01: Absorption spectrum of Sitagliptin in methanol (zero order derivative)
Method Validation
The proposed analytical method for Sitagliptin estimation was validated according to the ICH guidelines to ensure its reliability and suitability for its intended use. The drug solutions were prepared following the procedure outlined in the experimental section.
Linearity
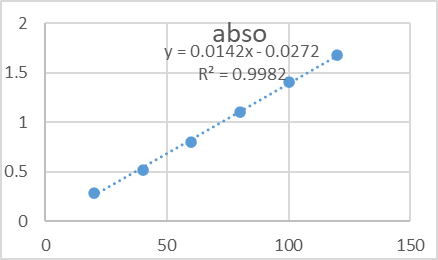
To assess the linearity of the method, standard solutions of Sitagliptin were prepared at concentrations ranging from 10% to 60% of the target concentration. These solutions were analyzed using UV-spectroscopy, and absorbance values were recorded. A calibration curve was constructed by plotting absorbance (Y-axis) against concentration (X-axis), as shown in Figure 2. The regression equation for the calibration curve was determined to be Y = 0.148x + 0.075, with a correlation coefficient (R²) of 0.9998, indicating a high degree of linearity over the tested concentration range.
|
|
Figure-02: The graph of concentration vs absorbance of linearity solutions Linearity overlay
Repeatability
Repeatability was determined by analyzing 1 μg/ml concentration of sitagliptin. for six times with %RSD < 2 which is illustrated in Table 2.
Table 2: Repeatability studies
|
Conc. in μg/ml |
Absorbance at 267 nm |
Absorbance Mean |
SD |
%RSD |
|
10 |
0.171 |
0.172 |
0.001414
|
0.008222 |
|
10 |
0.172 |
|||
|
10 |
0.171 |
|||
|
10 |
O.172 |
|||
|
10 |
0.174 |
|||
|
10 |
0.172 |
Precision
The precision of the developed method was evaluated by calculating the % relative standard deviation (%RSD), which reflects the reproducibility of the assay. The results demonstrated that the %RSD values were below 2%, indicating that the method is precise for determining the pure form of Sitagliptin. The interday and intraday precision results are presented in Table 3 and Table 4, respectively. These findings confirm the reliability and consistency of the method across different time points.
Table 3: Intraday precision
|
Conc. in μg /ml |
Inter day Precision S.D. ± Absorbance mean (n=3) |
%RSD |
|
10 |
0.001414 ± 0.172 |
0.008222 |
|
20 |
0.002±0.306 |
0.006536 |
|
30 |
0.002408±0.4546 |
0.005297 |
|
40 |
0.003493±1.0062 |
0.003471 |
|
50 |
0.016423±0.4962 |
0.033098 |
|
60 |
0.003647±1.0774 |
0.003385 |
Table 4: Inter day precision
|
Conc. in μg/ml |
Inter day Precision S.D. ±Absorbance mean(n=3) |
%RSD |
|
10 |
0.007759±0.0552 |
0.140562 |
|
20 |
0.005891±0.1912 |
0.03081 |
|
30 |
0.005099±0.392 |
0.013007 |
|
40 |
0.005244±0.498 |
0.01053 |
|
50 |
0.009813±0.5896 |
0.016643 |
|
60 |
0.007021±0.6806 |
0.010315 |
Accuracy
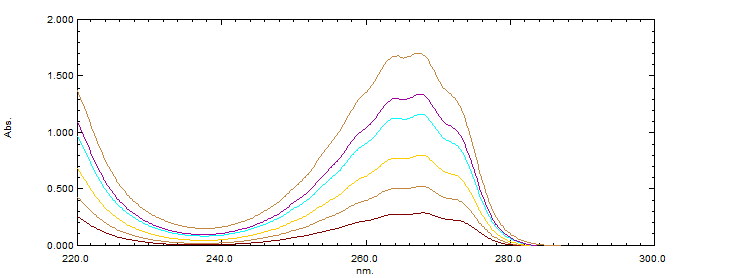
The accuracy of the method was assessed through recovery studies conducted at three different concentration levels. Known amounts of Sitagliptin were spiked into the formulation, and recovery was performed in triplicate for each concentration level. The percentage recovery was calculated, with the mean recovery falling between 100% and 101%. The %RSD values ranged from 0.7% to 1.0%, demonstrating the high accuracy and consistency of the method. The detailed results of the recovery studies are presented in Table 5.
Table 5: Recovery studies
|
Spiked level (%) |
Formulation conc. (µg/ml) |
Pure drug conc. (µg/ml) |
Amount conc. recovered (µg/ml) |
% Recovery |
% Mean recovery SD |
%RSD |
|
50 |
10 |
5 |
14.98 |
99.86 |
99.88 ± 0.040415 |
0.040 |
|
10 |
5 |
14.99 |
99.93 |
|||
|
10 |
5 |
14.98 |
99.86 |
|||
|
100 |
10 |
10 |
99.98 |
99.98 |
99.98 ± 0.005774 |
0.0057 |
|
10 |
10 |
99.99 |
99.99 |
|||
|
10 |
10 |
99.99 |
99.99 |
|||
|
150 |
10 |
15 |
149.98 |
99.98 |
99.98 ± 0.005774 |
0.0057 |
|
10 |
15 |
149.99 |
99.99 |
|||
|
10 |
15 |
149.99 |
99.99 |
Accuracy overlay
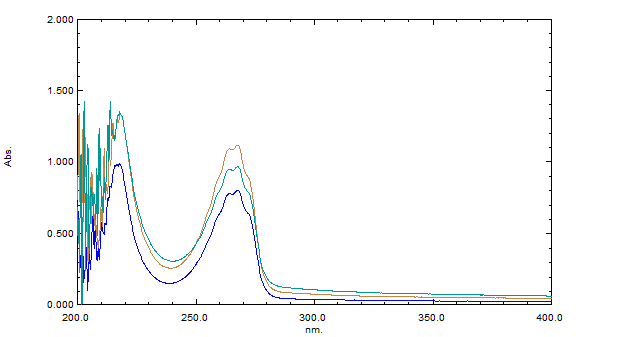
Figure-03: Limit of Detection (LOD) and Limit of Quantitation (LOQ)
The parameters LOD and LOQ were determined on the basis of response and slope of the regression equation. LOD and LOQ values are 0.361 and 1.00283 µg/ml respectively. The results are illustrated in Table 6.
Table 6: LOD and LOQ
|
Drug |
LOD |
LOQ |
|
Sitagliptin |
0.361 µg/ml |
1.00283 µg/ml |
Ruggedness studies
This study was performed by analysing 4 µg/ml of sitagliptin by two different analysts and on two instruments, results of the study were given in Table 7 and %RSD obtained was less than two which is within the acceptance limits.
Table 7: Ruggedness of Sitagliptin.
|
Parameter |
Conc. (µg/ml) |
Absorbance |
Absorbance Mean ± S.D. (n=3) |
%RSD |
|
Different Analyst |
10 |
0.115 |
0.116± 0.001528 |
0.013 |
|
0.118 |
||||
|
0.117 |
||||
|
Different instrument |
10 |
0.114 |
0.118±0.0036 |
0.030 |
|
0.119 |
||||
|
0.121 |
Assay for pharmaceutical formulation
The percentage recovery for istavel tablet formulation was found to be 99.6-101.06 % enlisted in Table 8. The results for assay are within acceptable limit.
Table 8: Assay of istavel tablets
|
Label claim (mg) |
Amount found (mg) |
% Purity |
Mean % purity ± SD (n=3) |
%RSD |
|
50 |
50.14 |
100.02 |
100.22±0.177764
|
0.177 |
|
50 |
50.05 |
100.10 |
||
|
50 |
50.18 |
100.36 |
Table 9: Summary of validated parameters
|
Parameters |
Method |
|
λmax |
267 nm |
|
Beers law limit |
10-60 µg/ml |
|
Correlation coefficient (r2) |
0.999 |
|
Molar absorptivity |
3.41x10⁴ L mol-1 cm-2 |
|
Regression equation (y=mx+c) |
Y=0.0141x-0.0599 |
|
Slope (m) |
0.0141 |
|
Intercept (c) |
0.0599 |
|
Accuracy |
99.24-100.24 |
|
Precision |
0.339-1.015 |
|
LOD |
0.361 µg/ml |
|
LOQ |
1.00283 µg/ml |
UV Analytical Method for Sitagliptin Quantification
The proposed UV spectrophotometric method for the quantification of sitagliptin in both its active pharmaceutical ingredient (API) and tablet formulations is simple, rapid, accurate, and well-suited for routine analysis. After determining the absorbance of the sample, only straightforward calculations are required to obtain the concentration. This method is applicable to substances that follow Beer's Law, making it versatile for other similar analytes. The low standard deviation and high recovery rates indicate that the method is both reproducible and accurate, confirming its reliability for consistent use in pharmaceutical quality control.
First-Order Derivative Method for Sitagliptin Estimation
Validated analytical methods were developed for the estimation of Sitagliptin in both API and tablet formulations using a UV-spectrophotometric approach. The method was designed to be simple, precise, rapid, and accurate, allowing for the reliable analysis of Sitagliptin in its tablet form, which has a label claim of 250 mg per tablet. Solubility is a crucial factor in UV spectrophotometric methods, and several solvents were tested to identify the most suitable one. Methanol was selected due to its ability to provide the highest absorbance and the most reliable spectral pattern when compared to other solvents.
The marketed Sitagliptin formulation was extracted and diluted to ensure the concentration fell within the method's linear range. The resulting solution was scanned, and measurements were taken at 267 nm, the absorbance maximum for Sitagliptin. The method demonstrated stable and linear results, with satisfactory recovery rates, making it ideal for routine analysis of Sitagliptin in tablet formulations. Solutions of Sitagliptin and its marketed product were prepared using methanol, and their UV spectra were recorded across the 200–400 nm range.
Selection of Solvent
An overlain spectrum of Sitagliptin and its marketed formulation was obtained using methanol as the solvent. Methanol provided the best absorbance for both the API and the formulation, offering a clear and consistent spectral pattern. As a result, methanol was chosen as the solvent for this study.
Absorbance Maximum (λmax)
The absorbance maximum (λmax) for Sitagliptin was determined to be 267 nm. This wavelength was selected for further analysis due to the sharp and distinct absorbance peak observed at this point in the UV spectrum of Sitagliptin.
Table- 10: UV Spectrum
|
concentration |
Absorbance |
|
10 |
0.088 |
|
20 |
0.225 |
|
30 |
0.370 |
|
40 |
0.502 |
|
50 |
0.675 |
|
60 |
0.800 |
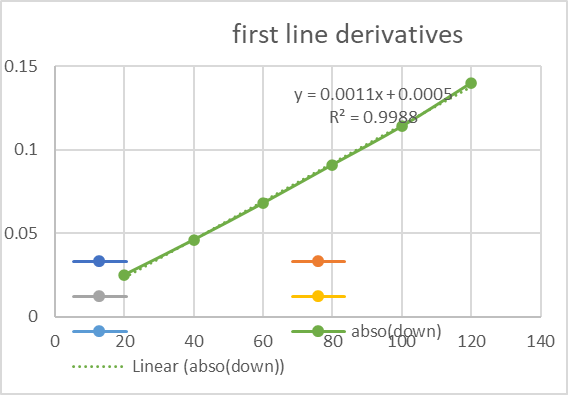
Figure-04: First line derivatives
Table 11: Intraday precision
|
Conc. in μg/ml |
Intraday Precision S.D. ± Absorbance mean (n=3) |
%RSD |
|
10 |
0.001441 ± 0.178 |
0.00835 |
|
20 |
0.0025±0.312 |
0.00654 |
|
30 |
0.00250±0.4564 |
0.00547 |
|
40 |
0.00350±1.057 |
0.003574 |
|
50 |
0.0178±0.5014 |
0.03412 |
|
60 |
0.00399±1.0802 |
0.003487 |
Table 12: Inter day precision
|
Conc. in μg/ml |
Inter day Precision S.D. ±Absorbance mean(n=3) |
%RSD |
|
10 |
0.007761±0.0555 |
0.140572 |
|
20 |
0.005122±0.1915 |
0.03092 |
|
30 |
0.005128±0.3931 |
0.013081 |
|
40 |
0.005248±0.501 |
0.01063 |
|
50 |
0.009817±0.590 |
0.016651 |
|
60 |
0.007050±0.6812 |
0.010321 |
Limit of Detection (LOD) and Limit of Quantitation (LOQ)
Table 13: LOD and LOQ
|
Drug |
LOD |
LOQ |
|
Sitagliptin |
0.361 µg/ml |
1.00283 µg/ml |
Accuracy
Table 13: Recovery studies
|
Spiked level (%) |
Formulation conc. (µg/ml) |
Pure drug conc. (µg/ml) |
Amount conc. recovered (µg/ml) |
% Recovery |
% Mean recovery SD |
%RSD |
|
|
10 |
5 |
14.99 |
99.92 |
|
|
|
10 |
5 |
14.98 |
99.87 |
|||
|
100 |
10 |
10 |
99.96 |
99.96 |
99.98 ± 0.005781 |
0.0067 |
|
10 |
10 |
99.98 |
99.99 |
|||
|
10 |
10 |
99.99 |
99.99 |
|||
|
150 |
10 |
15 |
149.98 |
99.98 |
99.98 ± 0.005774 |
0.0062 |
|
10 |
15 |
149.99 |
99.99 |
|||
|
10 |
15 |
149.99 |
99.99 |
SUMMARY AND CONCLUSION:
Based on the findings of this study, it can be concluded that the Zero-Order Derivative method is both cost-effective and reproducible. The method has been developed and validated according to ICH Q2 (R1) guidelines, ensuring its suitability for routine analysis of sitagliptin in pharmaceutical dosage forms. Validation results demonstrated that the method meets ICH and USP standards, confirming its simplicity, accuracy, precision, and linearity. It is well-suited for use in routine laboratory analysis, providing highly accurate and precise results. The method's precision, evaluated through repeatability tests using a sufficient number of homogeneous sample aliquots, confirmed its reliability. The method was applied successfully to the analysis of sitagliptin tablet dosage forms, with no interference observed from excipients, further validating its application in pharmaceutical analysis. Compared to other reported methods, the proposed method offers advantages in terms of sensitivity, simplicity, cost-effectiveness, and experimental efficiency. It does not require complex procedural steps, additional reagents, or prolonged analysis times, and can be performed using basic instrumentation.
Due to its cost-effectiveness and minimal maintenance requirements, this method is ideal for use in small-scale industries. It can effectively be applied for the quantitative analysis of sitagliptin in pharmaceutical formulations, ensuring therapeutic efficacy while minimizing both time and cost. The success of this method highlights the importance of careful method development and optimization to improve performance. A well-optimized method is easier to validate and can be employed for the rapid analysis of preclinical, formulation, and commercial samples. Upon reviewing existing literature, it is evident that there are limited methods available for the determination and validation of sitagliptin in bulk and pharmaceutical forms. Therefore, the method developed in this study fills this gap by offering an improved UV spectroscopic technique for determining sitagliptin in both bulk and pharmaceutical dosage forms. Furthermore, the method is also applicable to the determination of sitagliptin in bulk and pharmaceutical formulations. The validation parameters, including accuracy, precision, specificity, and linearity, show that the developed methods are reliable for routine analysis of sitagliptin with results meeting both ICH and USP requirements and adhering to Beer's Law.
REFERENCES

Pavan Kumar*, A. Naga Akshay Kumar, D. Pooja, S. k. Mastan Valli, Y. Yamini, UV Spectophotometric Method Development & Validation in Bulk Drugs and In Tablet Dosage Form of Sitagliptin by Using Methnol, Water & Acetnitrile as Solvents, Int. J. of Pharm. Sci., 2025, Vol 3, Issue 2, 1856-1867. https://doi.org/10.5281/zenodo.14913287
 10.5281/zenodo.14913287