
We use cookies to ensure our website works properly and to personalise your experience. Cookies policy
Dept. of Pharmaceutical Quality Assurance, DSTS Mandal’s College of Pharmacy, Solapur
This study reports the development of a UV-Vis spectrophotometric method for the estimation of furosemide in pharmaceutical dosage forms using water as the solvent. The furosemide showed maximum absorption at wavelength 277?nm and exhibited linearity over the concentration range of 5–25?µg/ml, with a correlation coefficient (R²) of 0.999. Precision studies showed an RSD of 0.123%, and accuracy recovery between 98-101%. The assay of a marketed furosemide tablet detected 98.86% of the label claim. Overall, the developed method is simple, sensitive, and reproducible, making it well suited for routine pharmaceutical analysis.
Furosemide, chemically known as 4-chloro-2-[(furan-2-ylmethyl)amino]-5-sulfamoylbenzoic acid, is a potent loop diuretic widely used in the management of edema associated with conditions such as congestive heart failure, liver cirrhosis, and renal disorders.¹ It exerts its pharmacological effect by inhibiting the Na?/K?/2Cl? co-transporter in the thick ascending limb of the loop of Henle, resulting in increased excretion of sodium, potassium, chloride, calcium, magnesium, and bicarbonate ions.²?³ Furosemide is a crystalline powder that is practically insoluble in water but soluble in acetone, methanol, and alkaline hydroxide solutions.? Furosemide is commercially available in the following forms: tablets (20 mg, 40 mg, and 80 mg per dose), oral solutions (10 mg/mL and 40 mg/5 mL), and injectable solutions (10 mg/mL).

Figure 1 Structure of furosemide
Due to its therapeutic significance, the accurate and reliable quantification of furosemide is essential for ensuring drug quality and efficacy. Among various analytical techniques, UV-Vis spectrophotometry is widely preferred because of its simplicity, sensitivity, and cost-effectiveness. Although several UV spectrophotometric methods have been developed for furosemide estimation, many exhibit limitations. Some studies utilized both absorbance maxima and area under the curve (AUC) approaches for bulk and tablet analysis but lacked comprehensive method validation.? In degradation studies, UV-based techniques were applied without the development or validation of a specific spectrophotometric protocol.? A kinetic UV spectrophotometric method involving Co(II) salts and acidic ethanol was reported, but it employed reagents that are environmentally hazardous and unsuitable for routine quality control.? Another method used methanol as the solvent without assessing alternative solvents or buffer systems.? A different approach employed a pH 9.2 buffer capsule and reported maximum absorbance at 276?nm, but did not account for possible interference from excipients or degradation products.? Additionally, a validated method using 0.1?N NaOH demonstrated a narrow linearity range (1–6?µg/mL) with absorbance at 229?nm, limiting its broader application.¹0 However, a method using water has not been reported. Therefore, in the present study, an attempt was made to develop a simple and economical UV-vis spectrophotometric method for the analysis of furosemide in water.
MATERIALS AND METHODS
Materials
Furosemide was obtained as gift samples from Hetero Drugs Ltd. Tablet formulation (Lasix 40mg Tab, Sanofi India Ltd) containing 40 mg was purchased from retail outlets. Analytical-grade methanol used in this study was obtained from Merck Life Science. For analysis UV-vis spectrophotometer Shimadzu (UV-1800) paired with 1-cm quartz cells. Samples were weighed with a Shimadzu (AY-220) digital balance, and an ultrasonicator (Microclean-103) was employed to sonicate the sample solution.
Methods
Preparation of standard solutions
Precisely, 10?mg of furosemide was weighed, transferred into a 10?ml volumetric flask, dissolved and diluted to 10 ml with methanol, to obtain a stock solution of 1000?μg/ml. From this stock solution, 1?ml was pipetted out and diluted to 20?ml with distilled water to obtain a standard solution of 50?μg/ml.
Determination of maximum absorption
To identify the optimal analytical wavelength, 10?μg/ml concentration solution was scanned in range of 400-200nm using UV-vis spectrophotometer.
Linearity Study
1, 2, 3, 4 and 5 ml of standard solutions was diluted up to 10?ml with distilled water in volumetric flasks. This resulted in solutions with concentrations of 5, 10, 15, 20, and 25?μg/ml, respectively. The absorbance of each solution was then measured at 277?nm, distilled water as the blank. Then absorbance vs concentration graph was plotted.
Precision Study
A solution of furosemide (15 µg/ml) was analyzed for precision. Absorbance values were recorded six times at 277 nm using a UV-Vis spectrophotometer. The relative standard deviation (%RSD) was calculated to evaluate the repeatability and consistency of the method.
Preparation for Accuracy study
The accuracy study demonstrates that the analytical method was reliable and produces consistent results across different levels of recovery.
Test solution: Accurately weighed 20 tablets of furosemide and average weight of tablets recorded. The tablets were triturated in glass mortar and pestle to get fine powder. From this tablet powder weight equivalent to 5 mg of furosemide powder was weighed, dissolved and diluted up to 10 ml with methanol in a volumetric flask resulting concentration of (500 µg/ml). From this (500 µg/ml) 1 ml was pipetted out and diluted to 10 ml with distilled water to get 50 µg/ml concentration.
For the recovery study, 1?mL of test solution (50?μg/mL) was kept constant. To this, 0.8, 1.0, and 1.2?mL of standard solution (50?μg/mL) were added to achieve 80%, 100%, and 120% recovery levels, respectively. Each mixture was then diluted with distilled water to 10?mL in a volumetric flask. The absorbance of these solutions was measured at 277 nm. The drug content was quantified using the standard calibration curve equation.
Limit of Detection
The Limit of Detection is the smallest amount of a substance that can be clearly detected. It was often calculated using the formula:
LOD=3.3×SD÷Slope
Here: SD: Standard deviation of the response, Slope: Slope of the calibration curve
Limit of Quantitation
This value indicates the smallest concentration of furosemide that can be quantified. To calculate the Limit of Quantitation following formula was used:
LOQ=10×SD÷Slope
Here: SD: Standard deviation of the response, Slope: Slope of the calibration curve
Preparation for furosemide tablet assay
2ml of test solution (50 µg/ml) was diluted to 10 ml with distilled water in a volumetric flask to get concentration of (approx10 µg/ml). The absorbance of this (approx10 µg/ml) was recorded at 277nm with distilled water serving as the blank. Percent assay was calculated from regression equation (Y= 0.0651x + 0.0718).
RESULTS AND DISCUSSION
The absorption spectrum revealed a peak at 277?nm, which was selected as the analytical wavelength for whole study.
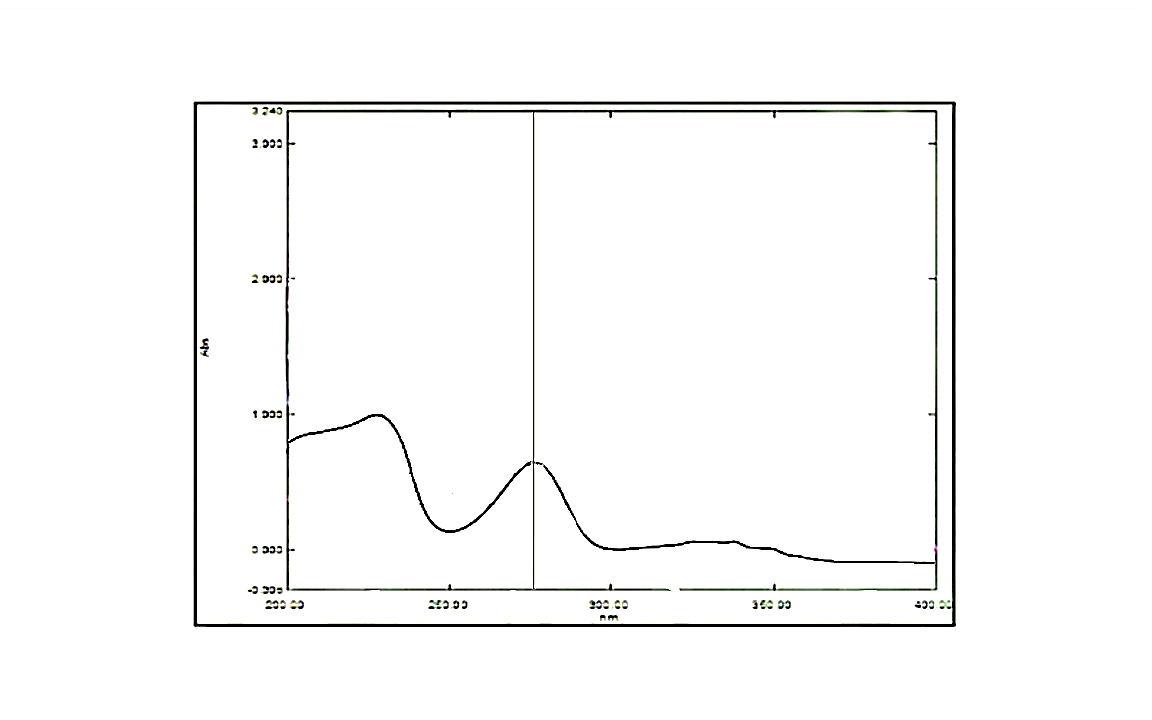
Figure 2 Absorption Spectra of Furosemide
Method Validation
The validation of this method was done by as per International Council for Harmonization.11,12
Linearity
When absorbance was plotted against concentration, the resulting graph exhibited a linear relationship with a strong correlation (R²=0.999), confirming the method's reliability and adherence to Beer-Lambert’s law.
Table 1 Absorbance of standard solution
|
Sr. No |
Concentration (mg/ml) |
Absorbance |
|
1 |
5 |
0.411 |
|
2 |
10 |
0.701 |
|
3 |
15 |
1.045 |
|
4 |
20 |
1.393 |
|
5 |
25 |
1.693 |
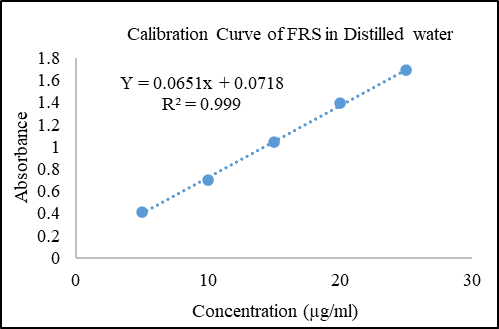
Figure 3 Linearity response of furosemide standard solution
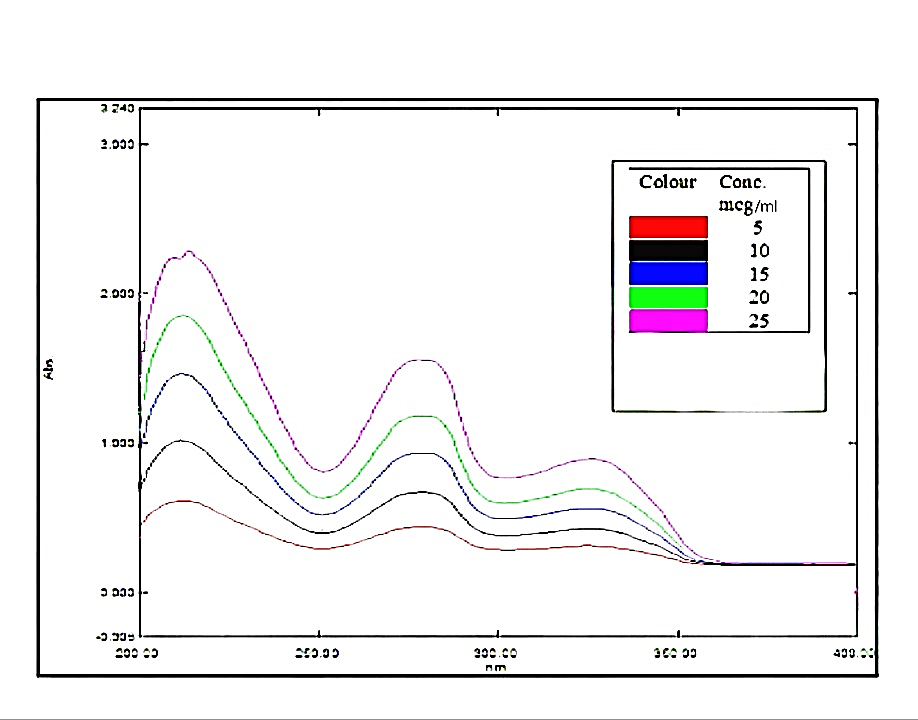
Figure 4 Overlay of UV Spectra of Standard Solutions of Furosemide
Precision
The precision study demonstrated that the UV-Vis spectrophotometric method for furosemide exhibited high reliability and consistency. As shown in Table 2, the absorbance values across six replicates showed minimal variation, with a relative standard deviation (RSD) of only 0.123%. This low RSD value indicates excellent repeatability.
Table 2 Precision Study
|
Sr. No. |
Absorbance |
|
1. |
1.054 |
|
2. |
1.055 |
|
3. |
1.055 |
|
4. |
1.056 |
|
5. |
1.057 |
|
6. |
1.057 |
|
Mean |
1.056 |
|
SD |
0.0013 |
|
RSD |
0.123% |
Accuracy
The accuracy of the method was evaluated through recovery studies at three concentration levels: 80%, 100%, and 120%. As shown in Table 3, the recovery percentages ranged from 98% to 101%, which fall well within the acceptable limits set by ICH and IP guidelines. These results confirm that the UV-Vis spectrophotometric method provides accurate quantification of furosemide across the tested concentration levels.
Table 3 Accuracy Study
|
Level of Recovery |
Test Solution (in ml) |
Standard Solution (in ml) |
Abs |
Conc. (in µg/ml) |
Amount Found |
Recovery (in %) |
|
0 |
1 |
0 |
0.378 |
4.70 |
- |
- |
|
80 |
1 |
0.8 |
0.598 |
8.11 |
4.47 |
100 |
|
100 |
1 |
1 |
0.669 |
9.17 |
3.41 |
98 |
|
120 |
1 |
1.2 |
0.735 |
10.34 |
5.8 |
101 |
Limit of Detection
The Limit of Detection (LOD) was calculated as 2.26 µg/ml, indicating the method's capability to detect very low concentrations of furosemide with high sensitivity.
Limit of Quantitation
The Limit of Quantitation (LOQ) was determined to be 6.84 µg/ml, representing the lowest concentration at which the method can quantify furosemide with acceptable accuracy and precision.
Assay of furosemide tablet
From the obtained absorbance, percent assay was calculated the (Table 4).
Table 4 Absorbance of test and Standard
|
Absorbance of test solution |
Percent assay |
|
0.693 |
98.86% |
The percent assay was 98.86%, which falls within the IP limit of 90% to 110%. This indicates that the sample meets the required standards.
CONCLUSION
A UV-Vis spectrophotometric method for the estimation of furosemide in pharmaceutical dosage forms has been successfully developed and comprehensively validated. The method fulfilled key analytical validation parameters, including linearity, precision, accuracy, and sensitivity, with a correlation coefficient (R²) of 0.999, excellent repeatability, and satisfactory recovery results. Assay findings for commercial tablet formulations confirmed compliance with pharmacopeial quality standards. Overall, the validated method is robust, cost-effective, and suitable for routine quality control of furosemide in various pharmaceutical dosage forms.
REFERENCES


Mahesh Dodtale*, Mallinath Kalshetti, Laxmikant Javalkote, UV-VIS Spectrophotometric Method for Estimating Furosemide in Dosage Form, Int. J. of Pharm. Sci., 2025, Vol 3, Issue 6, 1399-1404. https://doi.org/10.5281/zenodo.15613808
 10.5281/zenodo.15613808