Abstract
A simple, sensitive, accurate and precise Visible Spectrophotometric method was developed for the determination of darunavir in pharmaceutical dosage forms. darunavir was diazotized in acidic medium at 0-5 ºC temperature. The diazonium salt was reacting with coupling reagent ?-naphthol to form oranged red colored azo dye in an alkaline medium having maximum absorbance at 510 nm. The oranged red color azo dye is stable for about 6 hours. The calibration curve was found to be linear over a concentration range of 50 to 250 µg/ml.
Keywords
Darunavir, ?-naphthol, Visible spectroscopy
Introduction
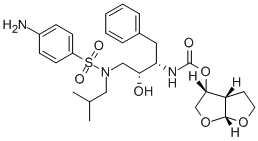
Darunavir ethanolate is chemically, [(1R,5S,6R)-2,8-dioxabicyclo[3.3.0]oct-6-yl] N-[(2S,3R)-4- [(4- aminophenyl)sulfonyl- (2-methylpropyl)amino]-3-hydroxy-1-phenyl- butan-2-yl] carbamate, which is a HIV protease inhibitor1-2 . Its molecular formula is C27H37N3O7S. C2H5OH and its molecular weight is 593.73 g/mol3 . It prevents HIV replication by binding to the enzyme's active site, there by preventing the dimerization and the catalytic activity of the HIV-1 protease. It also selectively inhibits the cleavage of HIV encoded Gag-Pol polyproteins in virus-infected cells, which prevents the formation of mature infectious virus. Various methods are reported in literature for the estimation of darunavir in phatamceutical formulations which includes Spectrophotometrric method1-5 RP-HPLC method6-7 and HPLC method8-9. The purpose of this work was to develop a novel, simple, economical and efficient spectrophotometric method for quantitative analysis of the drugs.

Fig1: Darunavir
DETECTION WAVELENGTH FOR TERAZOSIN HYDROCHLORIDE
The detection wavelength was determined by scanning the orange red solution in the range 400-650 nm using reagent blank. The overlain spectra were scanned and the wavelength was detected as 490 nm which was selected for analysis see figure 2.

Fig.2. Spectrum of diazotized darunavir coupled with ?-naphthol
MATERIALS AND METHODS
Instrumentation
Spectronic 1000 plus UV Visible Spectrophotometer with 1 cm matched quartz cells was used for all spectral and absorbance measurements.
Hydrochloric acid (0.1 N):
Hydrochloric acid solution (0.1N) is prepared by diluting the requisite volume of concentrated AR hydrochloric acid with distilled water and standardized by usual procedure.
Sodium nitrite (0.1N):
0.69 g of Sodium nitrite is dissolved in distilled water and the resulting solution is made up to the mark in 100 ml standard flask with distilled water. This solution is standardized by the usual analytical procedure.
?-Naphthol solution(1%):
Accurately weighed 1.0 g of ?-Naphthol solution is dissolved in methanol and the volume adjusted to 100 ml with methanol.
Urea solution (1%):
Accurately weighed 1 gm of Urea is dissolved in double distilled water and the volume made up to 100 ml with double distilled water.
Darunavir solution: 50 mg of Darunavir is dissolved in 50 ml methanol. 1.0 ml of the above stock solution is further diluted to 50 ml with methanol to get working concentration of 200 ?g/ml.
Assay Procedure:
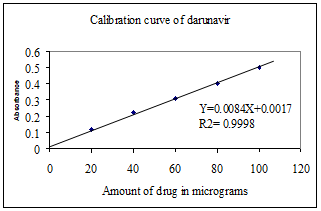
Various aliquots of the standard darunavir solution ranging from 0.2-1.0 ml are transferred into a series of 10 ml volumetric flasks. To each flask, 2.0 ml of 0.1N hydrochloric acid solution and 1.0 ml of cold 0.1N sodium nitrite solution are added. The resultant solution in each flask is well shaken and allowed to stand for five minutes at 0-5oC temperature for diazotization to complete. 1.0 ml of 1% urea solution is added to each flask and the solution is shaken frequently to allow nitrogen gas to escape. Then 1.0 ml of 0.5N sodium carbonate solution and 1.0 ml of 1% ?-naphthol solution are added and the volume in each flask is made up to 10 ml with methanol. An orange colour is formed. The maximum absorbance of the orange-coloured solution is measured at 490 nm against the reagent blank. Calibration graph is obtained by plotting absorbance values against the concentration of darunavir solution. The calibration curve is found to be linear over a concentration range of 20 to 100 ?g/ml of darunavir. The amount of darunavir present in the sample is estimated from the calibration graph. The results are presented in fig.2

Fig. 3. Calibration curve of darunavir
Assay of darunavir in pharmaceutical formulations:
Validation of Proposed Method
Linearity: Linearity was accessed by visualizing method with r2 value is 0.9998 shows calibration curve in linear. The regression equation found was Y = 0.0085x + 0.0017.
Precision
Precision of analytical procedure express the agreement between a series of measurement obtained from multiple sampling of the same homogeneous sample under the prescribed condition.
Repeatability
Repeatability was accessed by using minimum of 5 replicates of extracted terazosin hydrochlorideis of 100 ug/ml solutions. The %RSD shows below 2 and method passes the repeatability test.
Assay of darunavir in pharmaceutical formulations
The method is then applied to the determination of the darunavir from the marketed tablet formulations. Tablets are weighed and contents are powdered and well mixed. The powder equivalent to 50 mg of darunavir dissolved in methanol, filtered, residue is washed with distilled water and the volume is made upto 50 ml with methanol. Further dilution is made as described in the preparation of standard solution of terazosin hydrochloride. Further analysis is carried out as per procedure described above and the amount of drug present in the sample is estimated from calibration graph. The results are presented in table.2
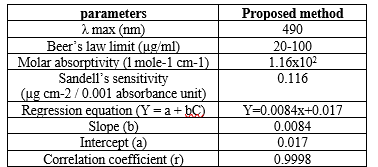
Table. 1 The optical characteristics of the proposed method

Table. 2 Assay of darunavir in pharmaceutical formulations

*Average of five determinations based on the label claim
RESULTS AND DISCUSSION:
In the present study darunavir react with sodium nitrite and hydrochloric acid at 0-5 ºC temperature to form diazonium cation. The diazonium cation reacts with the coupling reagent ?-naphthol to form an orange red azo dye solution. The absorbance of orange red colour azo dye solution was measured at 490 nm against reagent blank. The colour of the product is stable for more than 24 hours. The calibration curve was linear over the range of 20-100 ?g/ml of darunavir. The optical characteristics of the proposed method such as absorption maxima, Beer´s law limits, molar absorptivity and Sandell´s sensitivity are presented in Table 1. The molar absorp¬tivity and Sandell´s sensitivity values show that method is sensitivity. The regression analysis using method of least squares was made for the slope (b), intercept (a) and correlation (r) obtained from different concentrations and results are summarized in the Table 1. The value of correlation coefficient was 0.999, which indicated the good linearity of calibration lines. The percent relative standard deviation calculated from the five measurements of darunavir shown in Table.1. The % RSD is less than 2, which indicates that the method has good reproducibility. The standard deviation values are low indicates high accuracy and reproducibility of the method. The‘t’ calculated values are compares well with the theoretical value of 2.78 there by indicating that the precision of the method is good.
CONCLUTION
The proposed method is found to be simple, precise, accurate and time saving, reproducible and can be conveniently adopted for routine analysis of estimation of terazosin hydrochloride in bulk drugs samples and pharmaceutical formulations.
REFERENCES
- Krishnarao KVV, Phanindra B and Rajesh K. Spectrophotometric method for estimation of darunavir ethanolate by using MBTH reagent in bulk and pharmaceutical dosage form. Pharmanalysis & qualityassurance. 2013; 4: 1-3.
- Purushotham Reddty and Rami Reddy N. Spectrophotometric Determination of Darunavir in bulk and pharmaceutical formulations. Int. J. Chem. Sci.: 2013;11(1): 614-618.
- Vijayalakshmi Y, Naga Sri Ramya A, Dimple Mani M.D. Spectrophotometric Determination of Darunavir Ethanolate by Condensation Technique. International Journal of PharmTech Research. 2016; 9(6): 301-306.
- Acharyulu MLN , Mohana Rao PVSR , Siva Rama Koti. Spectrophotometric determination of Darunavir using NQS and Brucine meta periodate. Der Pharma Chemica. 2020;12(7): 36-42
- Josilene Correa. Development and validation of first derivative spectrophotometric method for quantification of darunair in tablets. British Journal of Pharmaceutical Research. 2014; 4(6):722-730
- Raveendra B, Ramprasad A, Srinivasu P, Jayachandra R, Rao JVLNS. New RP-HPLC method for the determination of darunavir in tablet dosage form, Asian J.Pharm.Res. 2011; 1(1); 10-14.
- Bhaskaramantena PV, Sumathirao V and Apparao KMCH. Method development and validation for the determination of four potential impurities present in darunavir tablets by reverse phase ultraperformance liquid chromatography coupled with diode array detector, Journal of liquid chromatography and related technologies., 2015: 38(12): 1236-1246.
- Bhavinipatel N and Suhagia BN. Simultaneous determination and validation of darunavir ethanolate and ritonavir in binary mixture by liquid chromatography, Int. j. pharmtech res. 2012;4(4): 1450-1456.
- Raveendrababu G, Lakshmanarao A and Venkateswararao J. Development and validation of novel HPLC method for estimation of darunavir in pharmaceutical formulations, IJRPC. 2013;3(2): 438-443.


 N Rami Reddy*


 10.5281/zenodo.13292917