

We use cookies to ensure our website works properly and to personalise your experience. Cookies policy
1PG Student Department of Pharmaceutics, Sarojini Naidu Vanita Pharmacy Maha Vidyalaya.
2Assistant Professor Department of Pharmaceutics, Sarojini Naidu Vanita Pharmacy Maha Vidyalaya.
Background: Acebrophylline is a bronchodilator and mucolytic used in asthma and chronic obstructive pulmonary disease (COPD) and is conventionally given twice daily. A controlled porosity osmotic pump (CPOP) tablet can extend its release without a laser-drilled orifice. Aim: To formulate acebrophylline CPOP tablets and evaluate the effect of osmogen and pore former levels on tablet properties and drug release. Materials and Methods: Core tablets (100 mg drug, 200 mg total weight) were prepared by direct compression using dextrose as osmogen (10, 20 and 30 mg) and spray dried lactose as diluent, and were dip-coated with ethyl cellulose containing PVP as pore former (12, 24 and 36 mg) and PEG as plasticizer, giving nine formulations (F1–F9). Drug–excipient compatibility was studied by FTIR, powder blends and tablets were evaluated, and in vitro release was studied in phosphate buffer pH 7.4. Release data of the optimised formulation were fitted to zero-order, first-order, Higuchi and Korsmeyer–Peppas models, and accelerated stability was assessed (40 ± 2 °C/75 ± 5% RH, 3 months). Results: The drug showed ?max at 274 nm (calibration y = 0.0203x + 0.0822; R² = 0.9976). FTIR showed no loss of the characteristic drug bands. Powder blends had good flow (Carr’s index 13.33–14.04%; Hausner’s ratio 1.15–1.16; angle of repose 27.8–28.7°). Tablets showed hardness of 6.1–7.3 kg/cm², friability of 0.24–0.42% and drug content of 96.9–99.5%. All formulations sustained release; F1, F2, F4 and F5 released 95.9–99.5% at 12 h, whereas F3, F7 (10 h) and F6, F8, F9 (8 h) reached 97.1–99.2% earlier. F5 gave the most gradual profile and the highest release at 12 h (99.5 ± 0.89%) and was selected as optimised. Its release fitted zero-order (R² = 0.998) and Korsmeyer–Peppas (R² = 0.997; n = 0.941, super case II transport) models best. Drug content of F5 remained within 95–105% after 3 months of accelerated storage (99.30 ± 0.70% to 98.96 ± 0.68%). Conclusion: Acebrophylline CPOP tablets provided controlled, near zero-order release over 12 h in vitro.
Chronic respiratory diseases impose a large and growing burden worldwide; asthma and COPD alone are estimated to affect around 400 million people.[1,2] The burden is particularly high in low- and middle-income countries, including India,[3] and treatment options remain limited, which keeps interest in improving the delivery and efficacy of existing drugs.[4]
Asthma is a chronic inflammatory disease of the airways with bronchial hyperresponsiveness, lumen narrowing and excess mucus production,[5] whereas COPD is characterised by airflow limitation that is not fully reversible.[6] Treatment of these conditions generally includes a bronchodilator, with corticosteroids and antibiotics where needed.
Conventional oral dosage forms release the drug rapidly, which produces fluctuating plasma concentrations and requires frequent dosing, with the risk of levels above the toxic or below the minimum effective concentration.[7] Sustained and controlled release systems are designed to reduce dosing frequency, give more uniform drug delivery and improve patient compliance, and the oral route has received most attention for such systems.[8]
Osmotic drug delivery systems use osmotic pressure as the driving force for release.[9,10] A key advantage is that drug release is largely independent of the pH and hydrodynamics of the external medium, which favours good in vitro–in vivo correlation, and the systems suit drugs with a wide range of solubilities.[9,10] The controlled porosity osmotic pump (CPOP) is an osmotic tablet whose semipermeable membrane contains water-soluble pore-forming agents. On contact with water these agents leach out, forming micropores in situ through which the dissolved drug is released by osmotic and hydrostatic pressure, so no orifice needs to be drilled.[11,12] The release rate depends on the water permeability and thickness of the membrane, the osmotic pressure of the core and the level of pore former. CPOP tablets have been investigated for diltiazem hydrochloride,[13] a nifedipine–metoprolol combination,[14] ketorolac tromethamine[15,16] and, with a push–pull design, theophylline and salbutamol for asthma.[17]
Acebrophylline combines the actions of ambroxol and theophylline-7-acetic acid, giving bronchodilatory and mucoregulatory effects, and is used in bronchial asthma and COPD at a usual adult dose of 100 mg twice daily. A controlled-release form could reduce dosing frequency and the fluctuations seen with conventional tablets. The present work was undertaken to develop a CPOP tablet of acebrophylline.
Aim and objectives
The aim of this work was to develop acebrophylline CPOP tablets using suitable excipients and conventional tablet manufacturing techniques, and to examine how the formulation variables influence tablet characteristics and drug release. The specific objectives were to:
(1) prepare acebrophylline CPOP tablets with suitable excipients and a suitable manufacturing process;
(2) study the physicochemical properties of acebrophylline and carry out preformulation studies;
(3) use FTIR spectra to check for drug–excipient interaction;
(4) evaluate the pre-compression characteristics of the powder blends (bulk density, tapped density, Carr’s index, Hausner’s ratio and angle of repose);
(5) assess post-compression parameters (thickness, hardness, friability, weight variation and drug content);
(6) study in vitro release in phosphate buffer pH 7.4 and the influence of formulation variables on release;
(7) fit the release data to zero-order, first-order, Higuchi and Korsmeyer–Peppas equations to understand the release pattern and mechanism; and
(8) identify the formulation with the most desirable release behaviour for further development.
MATERIALS AND METHODS
MATERIALS
Acebrophylline was a gift sample from Dr. Reddy’s Laboratories, Hyderabad, Telangana (assay 99–101% as per the certificate of analysis). Dextrose anhydrous (Gayathri Industries), spray dried lactose (Molychem, Mumbai), PVP K30 (Molychem, Mumbai), magnesium stearate (S.D. Fine-Chem, Mumbai), talc (Fine Chem, Bangalore), ethyl cellulose (Virat Labs), polyethylene glycol (S.D. Fine-Chem, Mumbai), acetone (S.D. Fine-Chem, Mumbai), methanol HPLC grade (Sigma-Aldrich, Bengaluru) and amaranth colour (Oxford Lab Fine Chem) were used. All other reagents were of analytical grade.
Preformulation studies
Colour, odour, melting point (capillary method) and hygroscopicity of the pure drug were recorded. Solubility was determined by shaking an excess of drug with fixed volumes of different solvents until equilibrium, filtering, diluting and measuring absorbance at 274 nm against the calibration curve. Bulk density, tapped density, porosity, Carr’s index, Hausner’s ratio and angle of repose (fixed-funnel method) were measured by pharmacopoeial methods. Carr’s index (%) = [(tapped density − bulk density)/tapped density] × 100 and Hausner’s ratio = tapped density/bulk density.
Preparation of phosphate buffer pH 7.4
Potassium dihydrogen orthophosphate (6.8 g) was dissolved in 500 ml of distilled water in a 1000 ml volumetric flask, 112 ml of 0.2 M sodium hydroxide was added and the volume was made up to 1000 ml with distilled water, as given in the Indian Pharmacopoeia (IP).
Calibration curve
A stock solution (1000 µg/ml) was prepared by dissolving 100 mg of acebrophylline in phosphate buffer pH 7.4 and making up to 100 ml. A 10 µg/ml solution was scanned from 200 to 400 nm against a blank to determine λmax. Dilutions of 5–30 µg/ml were prepared from a 100 µg/ml secondary stock, absorbance was read at 274 nm, and absorbance was plotted against concentration; the regression equation and R² were calculated. The curve was used for drug content, solubility and dissolution.
Drug–excipient compatibility (FTIR)
FTIR spectra of the pure drug, a 1:1 physical mixture of drug and excipients, and the formulated tablet were recorded by the KBr pellet method over 4000–400 cm⁻¹. Changes in position or disappearance of the characteristic drug peaks were examined.
Dose selection
The conventional dose is 100 mg twice daily (200 mg/day), so 100 mg of acebrophylline was incorporated in each core tablet of 200 mg, giving a drug loading of 50% w/w. For uniform release of 100 mg over 12 h, the theoretical zero-order release rate is 100/12 = 8.33 mg/h.
Preparation of core tablets
Core tablets were prepared by direct compression. Acebrophylline equivalent to 100 mg was blended with dextrose (osmogen), spray dried lactose (diluent) and PVP K30 (binder); talc and magnesium stearate were added and mixed. The blend was compressed on a rotary tablet machine to a target weight of 200 mg. Dextrose (10, 20 or 30 mg) and lactose (80, 70 or 60 mg) were varied while the drug dose was constant (Table 1).
Table 1: Composition of Core Tablets of Acebrophylline (mg per Tablet)
| Ingredient | F1 | F2 | F3 | F4 | F5 | F6 | F7 | F8 | F9 |
|---|---|---|---|---|---|---|---|---|---|
| Acebrophylline (drug) | 100 | 100 | 100 | 100 | 100 | 100 | 100 | 100 | 100 |
| Dextrose (osmogen) | 10 | 10 | 10 | 20 | 20 | 20 | 30 | 30 | 30 |
| Spray dried lactose (diluent) | 80 | 70 | 60 | 80 | 70 | 60 | 80 | 70 | 60 |
| PVP K30 (binder) | 5 | 5 | 5 | 5 | 5 | 5 | 5 | 5 | 5 |
| Talc (lubricant) | 3 | 3 | 3 | 3 | 3 | 3 | 3 | 3 | 3 |
| Magnesium stearate (lubricant) | 2 | 2 | 2 | 2 | 2 | 2 | 2 | 2 | 2 |
Coating of core tablets
Core tablets were dip-coated with a coating solution containing ethyl cellulose (120 mg) as polymer, PVP (12, 24 or 36 mg) as pore former and PEG as plasticizer in 20 ml of methanol:acetone (Table 2). The coated tablets were dried to remove the solvent and form a uniform semipermeable membrane.
Table 2: Composition of the Coating Solution Used for Core Tablets of Acebrophylline
| Ingredient (mg)/(ml) | F1 | F2 | F3 | F4 | F5 | F6 | F7 | F8 | F9 |
|---|---|---|---|---|---|---|---|---|---|
| Ethyl cellulose (polymer) | 120 | 120 | 120 | 120 | 120 | 120 | 120 | 120 | 120 |
| PVP (pore former) | 12 | 24 | 36 | 12 | 24 | 36 | 12 | 24 | 36 |
| Methanol:acetone (solvent system) | 20 | 20 | 20 | 20 | 20 | 20 | 20 | 20 | 20 |
| PEG (plasticizer) | 0.2 | 0.2 | 0.2 | 0.2 | 0.2 | 0.2 | 0.2 | 0.2 | 0.2 |
Evaluation of tablets
Weight variation was determined on 20 tablets and compared with the IP limits (±7.5% for tablets of more than 80 mg and less than 250 mg). Hardness was measured with a Monsanto hardness tester and thickness with a calibrated screw gauge. Friability was determined on 20 tablets in a Roche friabilator at 25 rpm for 4 min, and calculated as (W1 − W2)/W1 × 100, where W1 and W2 are the initial and final weights. For drug content, ten tablets were weighed and powdered, a quantity equivalent to the required amount of drug was dissolved in the specified medium, filtered, diluted and read at 274 nm.
In vitro drug release
Release was studied in a USP type II (paddle) apparatus at 50 rpm in phosphate buffer pH 7.4 at 37 ± 0.5 °C. Samples were withdrawn at 0, 1, 2, 4, 6, 8, 10 and 12 h, filtered, diluted and assayed at 274 nm, and the volume withdrawn was replaced with fresh medium to maintain sink conditions. Cumulative percentage release was calculated at each time point.
Release kinetics
Release data were fitted to the zero-order (Qt = Q0 + K0t), first-order (log Qt = log Q0 − K1t/2.303), Higuchi (Qt = KH·t^1/2) and Korsmeyer–Peppas (Mt/M∞ = ktⁿ) models, the last using the initial 60% of release. Zero-order, first-order and Higuchi fits were examined by plotting cumulative % release against time, log % remaining against time and cumulative % release against the square root of time, respectively. The release exponent (n) was interpreted as Fickian diffusion (n = 0.45), anomalous (non-Fickian) transport (0.45 < n < 0.89) or super case II transport (n > 0.89), and the models were compared by R².
Stability studies
The optimised formulation (F5) was packed in HDPE containers and stored at 40 ± 2 °C/75 ± 5% RH in a stability chamber as per ICH Q1A (R2). Samples were withdrawn at 0, 1 and 3 months and assayed for drug content; the acceptance limit was 95–105% of the label claim.
RESULTS AND DISCUSSION
Preformulation studies
Acebrophylline was a white to off-white crystalline powder with a melting point of 213–214 °C, slightly soluble in water, freely soluble in ethanol and slightly soluble in methanol (Table 3). Because the drug is only slightly soluble in water, dextrose was included in the core as an osmotic agent to generate the osmotic pressure needed for water uptake.
Table 3: Physical Characteristics of Acebrophylline
| Parameter | Acebrophylline |
|---|---|
| Physical appearance | White crystalline powder |
| Colour | White to off-white |
| Molecular weight | 616.30 g/mol |
| Solubility in water | Slightly soluble |
| Solubility in ethanol | Freely soluble |
| Solubility in methanol | Slightly soluble |
| Melting point | 213–214 °C |
Calibration curve
Acebrophylline showed maximum absorbance at 274 nm in phosphate buffer pH 7.4. Absorbance was linear with concentration over 5–30 µg/ml (Table 4, Figure 1), with the regression equation y = 0.0203x + 0.0822 and R² = 0.9976, so Beer–Lambert’s law was obeyed and the curve was suitable for estimating drug content and dissolution samples.
Table 4: Calibration Curve Data of Acebrophylline in Phosphate Buffer pH 7.4
| Concentration (µg/ml) | Absorbance |
|---|---|
| 5 | 0.188 |
| 10 | 0.284 |
| 15 | 0.381 |
| 20 | 0.498 |
| 25 | 0.576 |
| 30 | 0.701 |
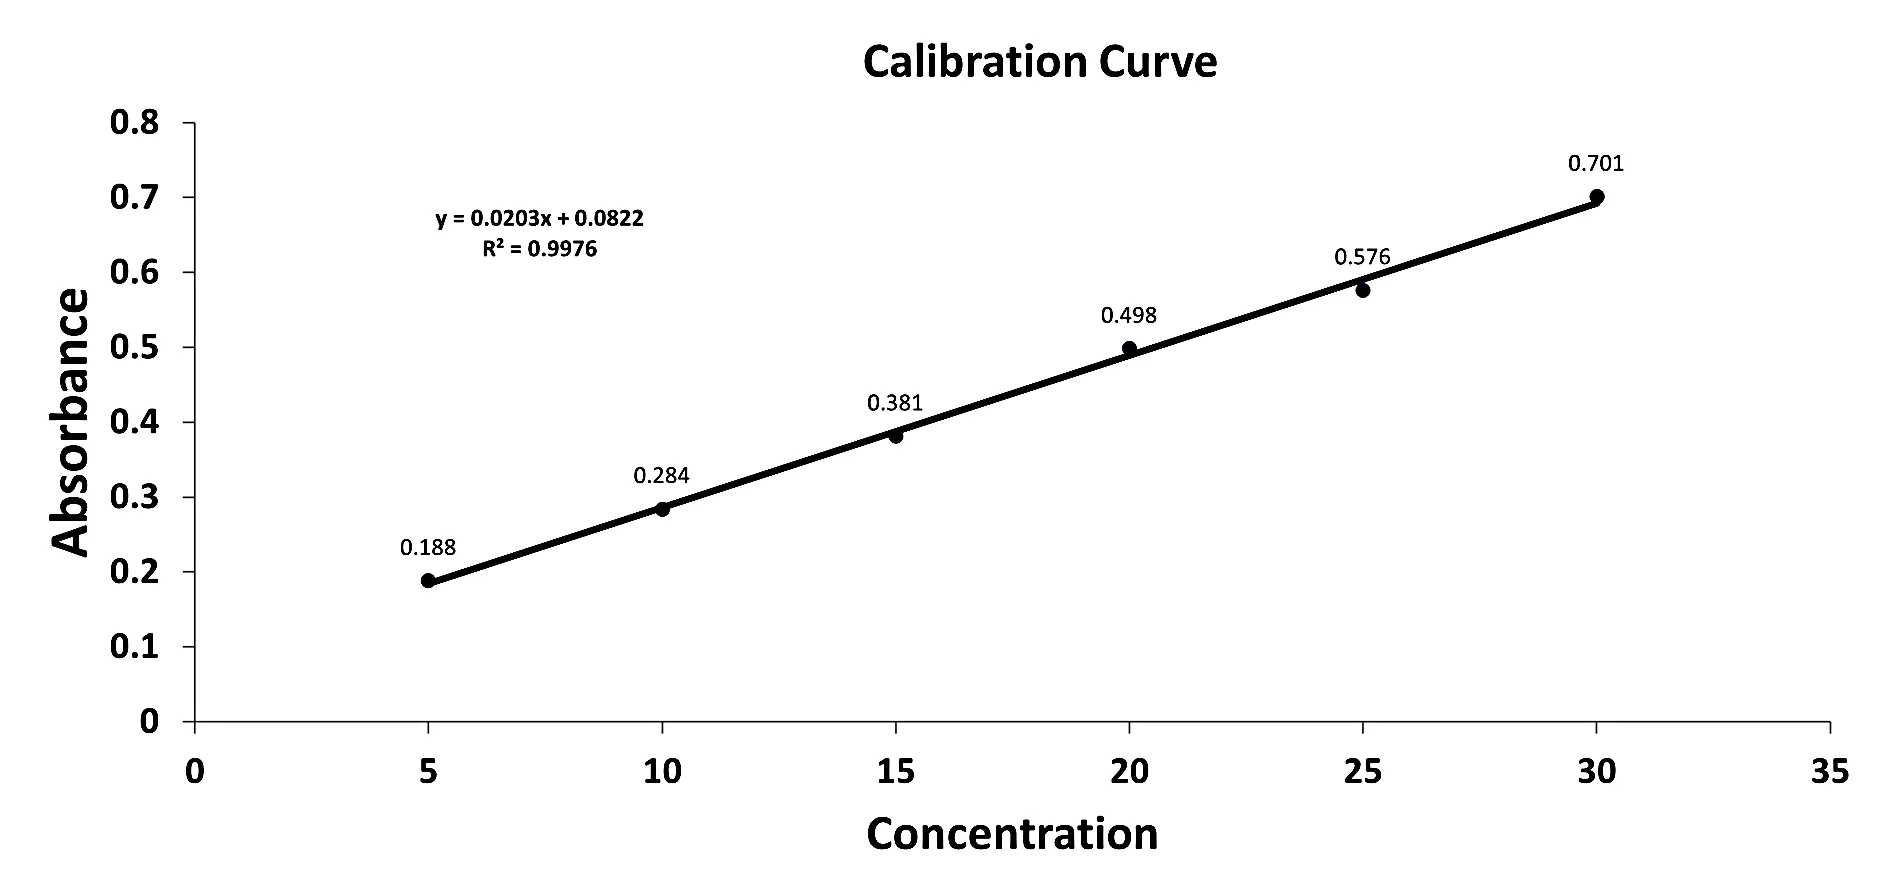
Figure 1: Calibration Curve of Acebrophylline in Phosphate Buffer pH 7.4
FTIR compatibility studies
The FTIR spectra of the pure drug, the physical mixture and the formulated tablet are shown in Figures 2–4 and the main bands in Table 5. The N–H stretching band (3498.12 cm⁻¹ in the pure drug), the carbonyl band (1706.34 cm⁻¹) and the alkane C–H stretching band (2931.00 cm⁻¹) were retained in the physical mixture (3499.45, 1703.99 and 2928.99 cm⁻¹) and in the tablet (3499.43, 1706.39 and 2930.04 cm⁻¹), with shifts of only a few wavenumbers. The aromatic C–H band at 3062.13 cm⁻¹ seen in the pure drug was not picked in the spectra of the mixture and the tablet. The retention of the principal functional-group bands indicates that no major chemical interaction occurred between acebrophylline and the excipients.
Table 5: FTIR Spectral Data of Pure Drug, Physical Mixture and Formulated Tablet
| Functional group | Pure drug (cm⁻¹) | Physical mixture (cm⁻¹) | Formulated tablet (cm⁻¹) |
|---|---|---|---|
| N–H stretching | 3498.12 | 3499.45 | 3499.43 |
| C=O stretching (carbonyl) | 1706.34 | 1703.99 | 1706.39 |
| C–H alkane stretching | 2931.00 | 2928.99 | 2930.04 |
| Aromatic C–H stretching | 3062.13 | – | – |
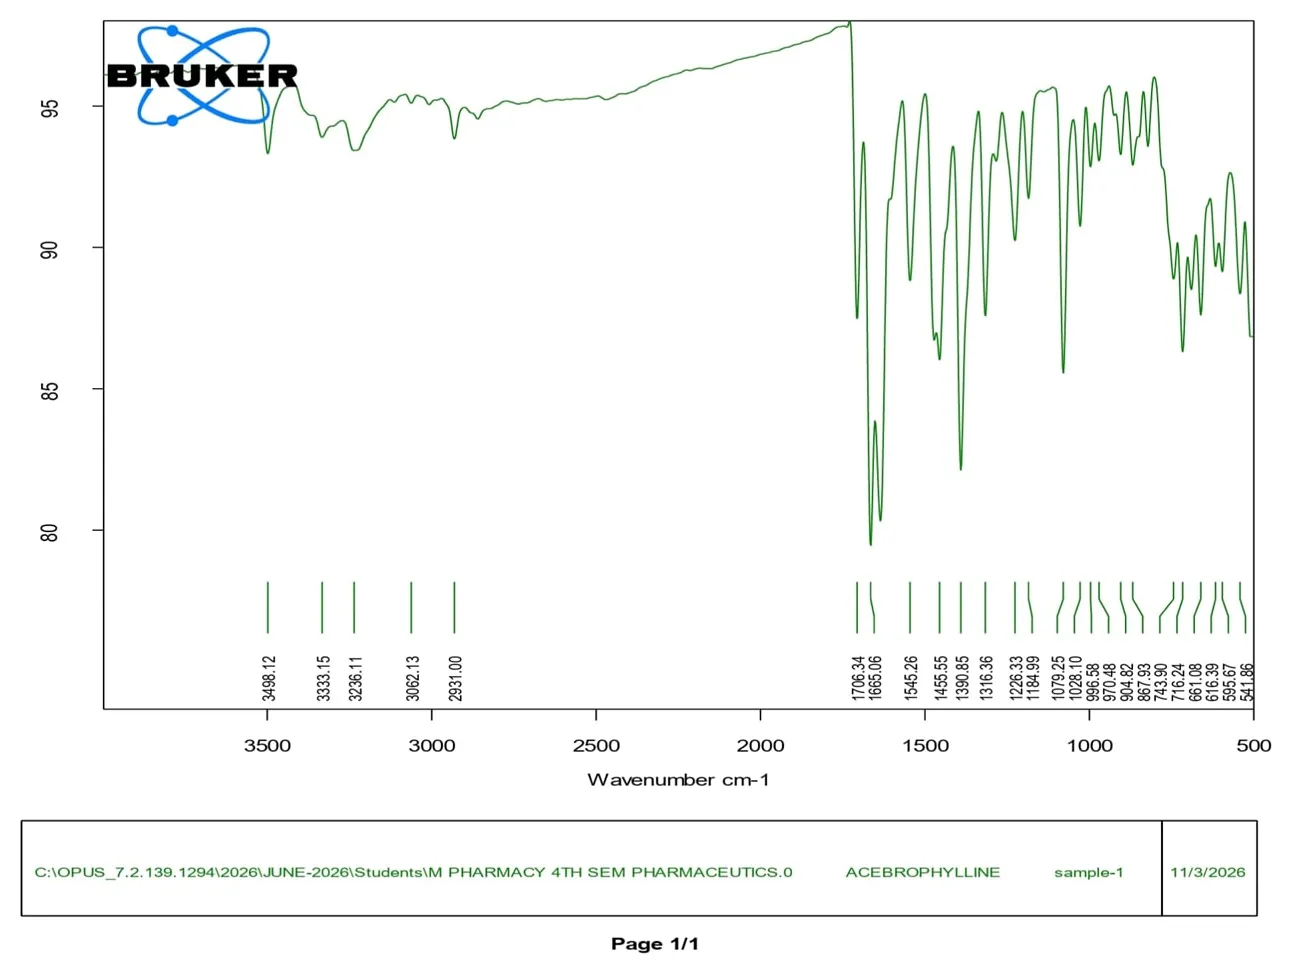
Figure 2: FTIR Spectrum of Acebrophylline (Pure Drug)
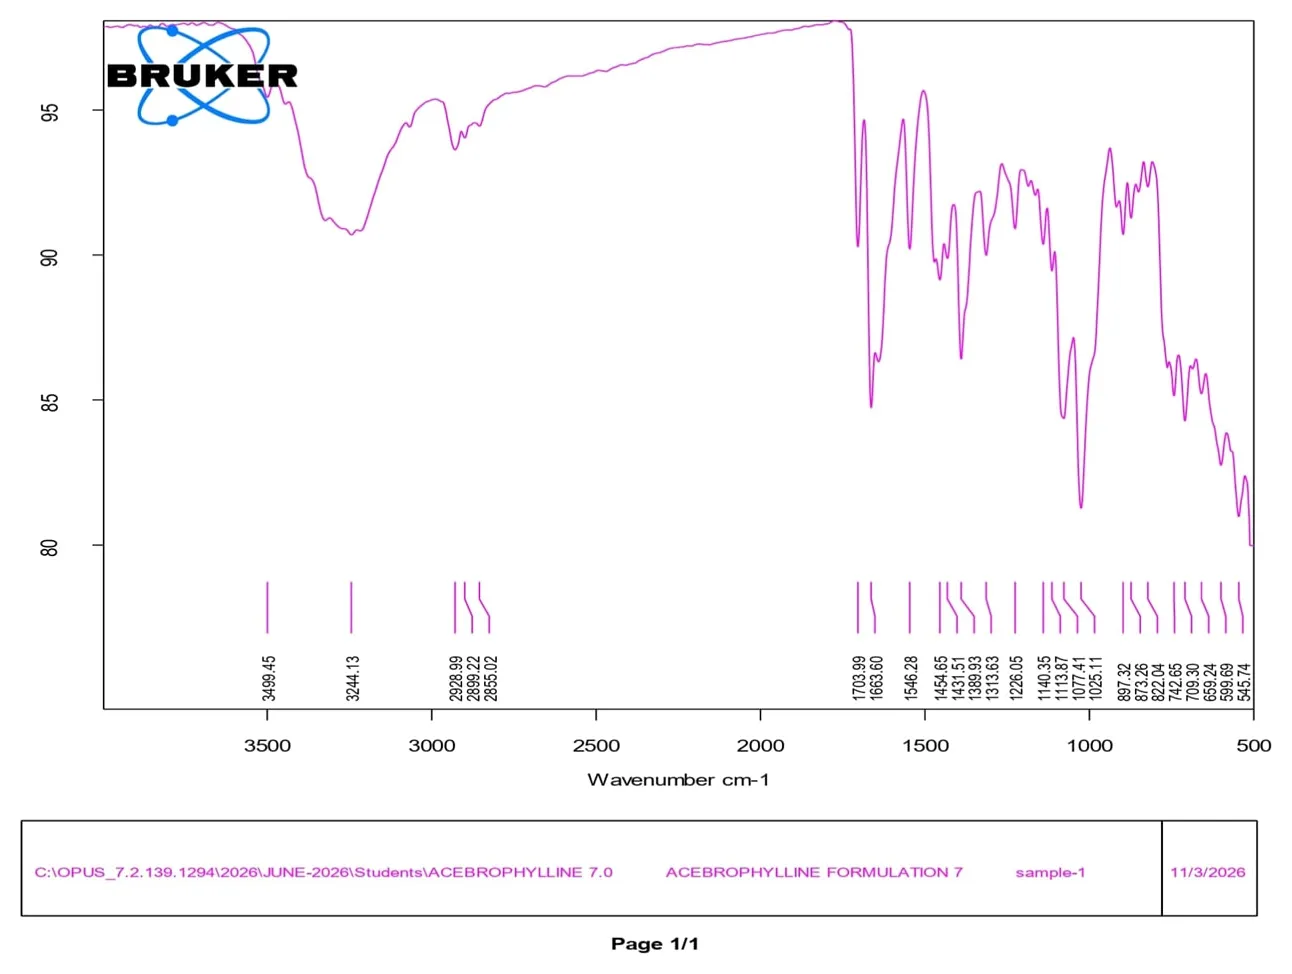
Figure 3: FTIR Spectrum of the Physical Mixture of Drug and Excipients
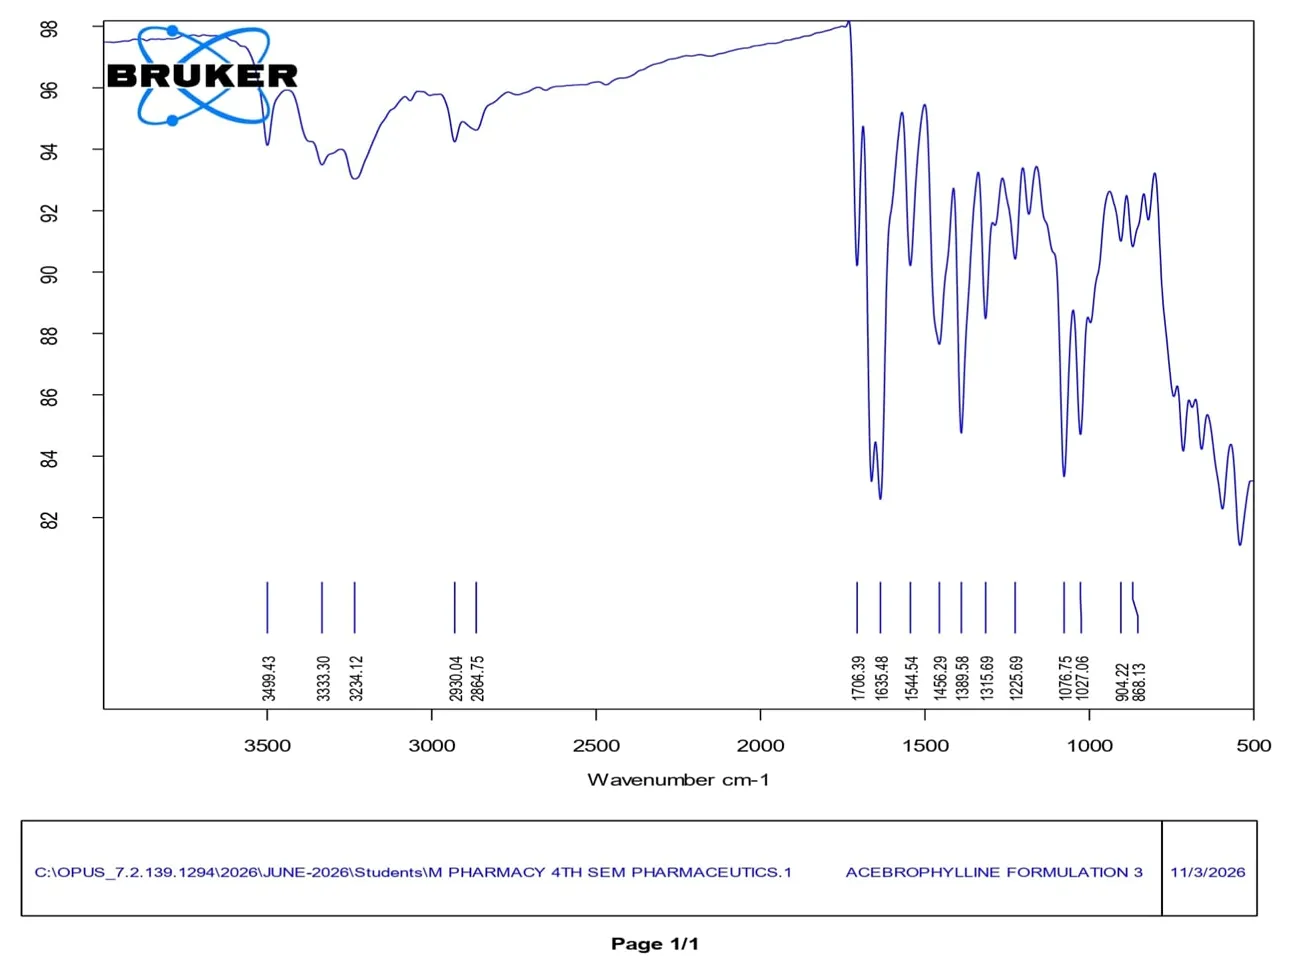
Figure 4: FTIR Spectrum of the Formulated Tablet
Pre-compression parameters
The blends of all nine formulations had bulk density of 0.49–0.52 g/cm³ and tapped density of 0.57–0.60 g/cm³ (Table 6). Carr’s index (13.33–14.04%), Hausner’s ratio (1.15–1.16) and angle of repose (27.8–28.7°) indicate good flow and compressibility, and the blends were suitable for direct compression.
Table 6: Micromeritic Properties of the Pre-Compression Powder Blends
| Formulation | Bulk density (g/cm³) | Tapped density (g/cm³) | Carr’s index (%) | Hausner’s ratio | Angle of repose (°) |
|---|---|---|---|---|---|
| F1 | 0.50 ± 0.01 | 0.58 ± 0.01 | 13.79 | 1.16 | 28.3 ± 0.1 |
| F2 | 0.50 ± 0.01 | 0.58 ± 0.01 | 13.79 | 1.16 | 28.1 ± 0.1 |
| F3 | 0.49 ± 0.01 | 0.57 ± 0.01 | 14.04 | 1.16 | 27.9 ± 0.1 |
| F4 | 0.51 ± 0.01 | 0.59 ± 0.01 | 13.56 | 1.16 | 28.5 ± 0.2 |
| F5 | 0.50 ± 0.01 | 0.58 ± 0.02 | 13.79 | 1.16 | 28.2 ± 0.1 |
| F6 | 0.49 ± 0.01 | 0.57 ± 0.01 | 14.04 | 1.16 | 27.8 ± 0.2 |
| F7 | 0.52 ± 0.01 | 0.60 ± 0.01 | 13.33 | 1.15 | 28.7 ± 0.2 |
| F8 | 0.51 ± 0.01 | 0.59 ± 0.01 | 13.56 | 1.16 | 28.4 ± 0.1 |
| F9 | 0.50 ± 0.01 | 0.58 ± 0.01 | 13.79 | 1.16 | 28.0 ± 0.1 |
Post-compression parameters
The tablets had thickness of 2.85–3.04 mm, hardness of 6.1–7.3 kg/cm² and friability of 0.24–0.42%, which is below the 1% limit, showing adequate mechanical strength (Table 7). Weight variation was 197.8–201.1 mg with SD not above 2.4 mg, well within the IP limit of ±7.5% for tablets of this weight, and drug content was 96.9–99.5%, within 95–105% of the label claim.
Table 7: Physicochemical Evaluation of the Formulated Tablets of Acebrophylline
| Formulation | Thickness (mm) ± SD | Hardness (kg/cm²) ± SD | Friability (%) ± SD | Weight variation (mg) ± SD | Drug content (%) ± SD |
|---|---|---|---|---|---|
| F1 | 2.85 ± 0.05 | 6.1 ± 0.2 | 0.42 ± 0.03 | 199.2 ± 1.8 | 98.7 ± 0.8 |
| F2 | 2.88 ± 0.07 | 6.4 ± 0.3 | 0.38 ± 0.03 | 198.7 ± 2.1 | 97.9 ± 0.9 |
| F3 | 2.92 ± 0.06 | 6.7 ± 0.2 | 0.34 ± 0.03 | 200.4 ± 1.5 | 99.3 ± 0.7 |
| F4 | 2.96 ± 0.08 | 6.9 ± 0.3 | 0.30 ± 0.02 | 199.6 ± 1.7 | 98.8 ± 0.6 |
| F5 | 3.00 ± 0.07 | 7.1 ± 0.2 | 0.27 ± 0.02 | 201.1 ± 1.3 | 99.5 ± 0.5 |
| F6 | 3.04 ± 0.06 | 7.3 ± 0.2 | 0.24 ± 0.03 | 198.9 ± 2.2 | 97.6 ± 1.0 |
| F7 | 2.98 ± 0.05 | 7.0 ± 0.3 | 0.28 ± 0.03 | 197.8 ± 2.4 | 96.9 ± 1.0 |
| F8 | 2.94 ± 0.07 | 6.8 ± 0.3 | 0.32 ± 0.03 | 200.2 ± 1.6 | 99.3 ± 0.6 |
| F9 | 2.90 ± 0.06 | 6.6 ± 0.2 | 0.36 ± 0.03 | 199.4 ± 1.9 | 98.4 ± 0.7 |
In vitro drug release
All nine formulations sustained release in phosphate buffer pH 7.4 (Table 8, Figure 5). Cumulative release at 12 h was 95.9% (F1), 96.5% (F2), 97.7% (F4) and 99.5% (F5); F3 and F7 reached 98.6% and 97.3% at 10 h, and F6, F8 and F9 reached 97.1%, 99.2% and 98.8% at 8 h, after which release was not followed further. Release at 1 h ranged from 8.5% (F2 and F5) to 22.7% (F6).
Both formulation variables influenced release. With 12 mg of PVP, increasing the dextrose level from 10 to 20 to 30 mg increased release at 6 h from 52.9% (F1) to 59.8% (F4) and 63.1% (F7), in line with higher osmotic pressure and water uptake. The highest pore former level (36 mg) gave the fastest release in the 10 mg and 20 mg dextrose series (F3 and F6, ≥97% by 10 h and 8 h respectively), consistent with a more porous membrane after leaching of PVP; in the 30 mg dextrose series, F8 and F9 (24 and 36 mg PVP) reached ≥98.8% by 8 h whereas F7 (12 mg PVP) needed 10 h. A similar direct relation of release to osmogen and pore former level has been reported for CPOP tablets of ketorolac.[16] The relation was not strictly linear across all nine batches: F5 (20 mg dextrose, 24 mg PVP) released more slowly than F2 and F8 at the intermediate time points (47.3% versus 61.2% and 81.8% at 6 h).
F5 gave the most gradual profile of the nine batches (63.8% at 8 h, against 74.1–99.2% for the others) and the highest cumulative release at 12 h (99.5 ± 0.89%), which corresponds closely to the intended 12 h delivery of 100 mg at about 8.33 mg/h. F5 was therefore selected as the optimised formulation. Its release profile is given in Table 9 and Figure 6.
Table 8: In Vitro Drug Release (Cumulative %, Mean ± SD) of Formulations F1–F9 in Phosphate Buffer pH 7.4
| Time (h) | F1 | F2 | F3 | F4 | F5 | F6 | F7 | F8 | F9 |
|---|---|---|---|---|---|---|---|---|---|
| 1 | 12.4 ± 1.04 | 8.5 ± 0.94 | 12.5 ± 0.61 | 10.8 ± 1.14 | 8.5 ± 1.84 | 22.7 ± 0.62 | 10.9 ± 1.14 | 15.8 ± 0.78 | 22.6 ± 0.52 |
| 2 | 24.8 ± 2.04 | 29.8 ± 1.24 | 24.6 ± 1.30 | 22.9 ± 1.98 | 16.1 ± 3.69 | 39.7 ± 1.48 | 18.5 ± 2.51 | 26.2 ± 2.56 | 43.0 ± 2.60 |
| 4 | 39.6 ± 4.07 | 52.6 ± 3.71 | 50.6 ± 0.65 | 45.5 ± 0.61 | 29.3 ± 3.68 | 64.1 ± 3.72 | 34.8 ± 4.59 | 51.9 ± 4.64 | 60.5 ± 4.69 |
| 6 | 52.9 ± 5.02 | 61.2 ± 2.76 | 73.2 ± 1.70 | 59.8 ± 2.68 | 47.3 ± 4.73 | 79.6 ± 2.77 | 63.1 ± 3.65 | 81.8 ± 3.71 | 75.5 ± 3.74 |
| 8 | 74.1 ± 3.08 | 76.5 ± 4.81 | 84.3 ± 3.75 | 74.2 ± 3.72 | 63.8 ± 5.79 | 97.1 ± 3.83 | 84.7 ± 2.70 | 99.2 ± 0.76 | 98.8 ± 2.80 |
| 10 | 82.8 ± 2.02 | 84.6 ± 3.86 | 98.6 ± 2.79 | 86.5 ± 5.77 | 81.4 ± 2.84 | – | 97.3 ± 3.74 | – | – |
| 12 | 95.9 ± 3.08 | 96.5 ± 3.01 | – | 97.7 ± 2.82 | 99.5 ± 0.89 | – | – | – | – |
– = not determined after near-complete (≥97%) release at the preceding sampling time.
Table 9: In Vitro Release Profile of the Optimised Formulation F5
| Time (h) | F5 cumulative drug release (%) |
|---|---|
| 0 | 0 |
| 1 | 8.5 ± 1.84 |
| 2 | 16.1 ± 3.69 |
| 4 | 29.3 ± 3.68 |
| 6 | 47.3 ± 4.73 |
| 8 | 63.8 ± 5.79 |
| 10 | 81.4 ± 2.84 |
| 12 | 99.5 ± 0.89 |
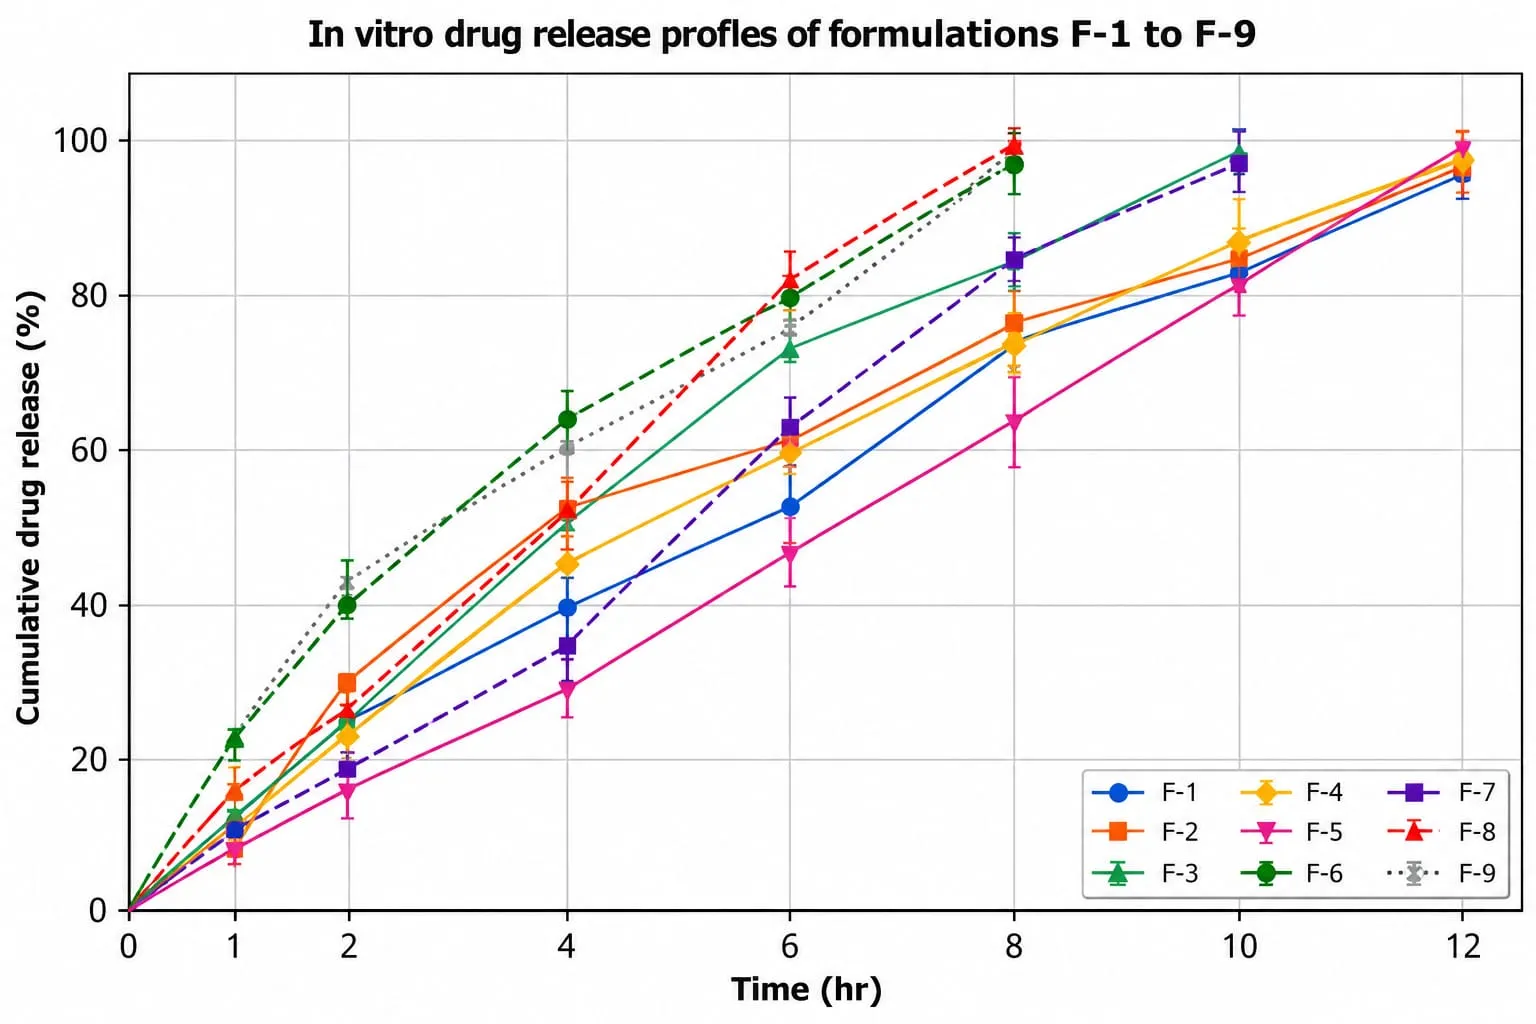
Figure 5: In Vitro Drug Release Profiles of Formulations F1–F9 in Phosphate Buffer pH 7.4
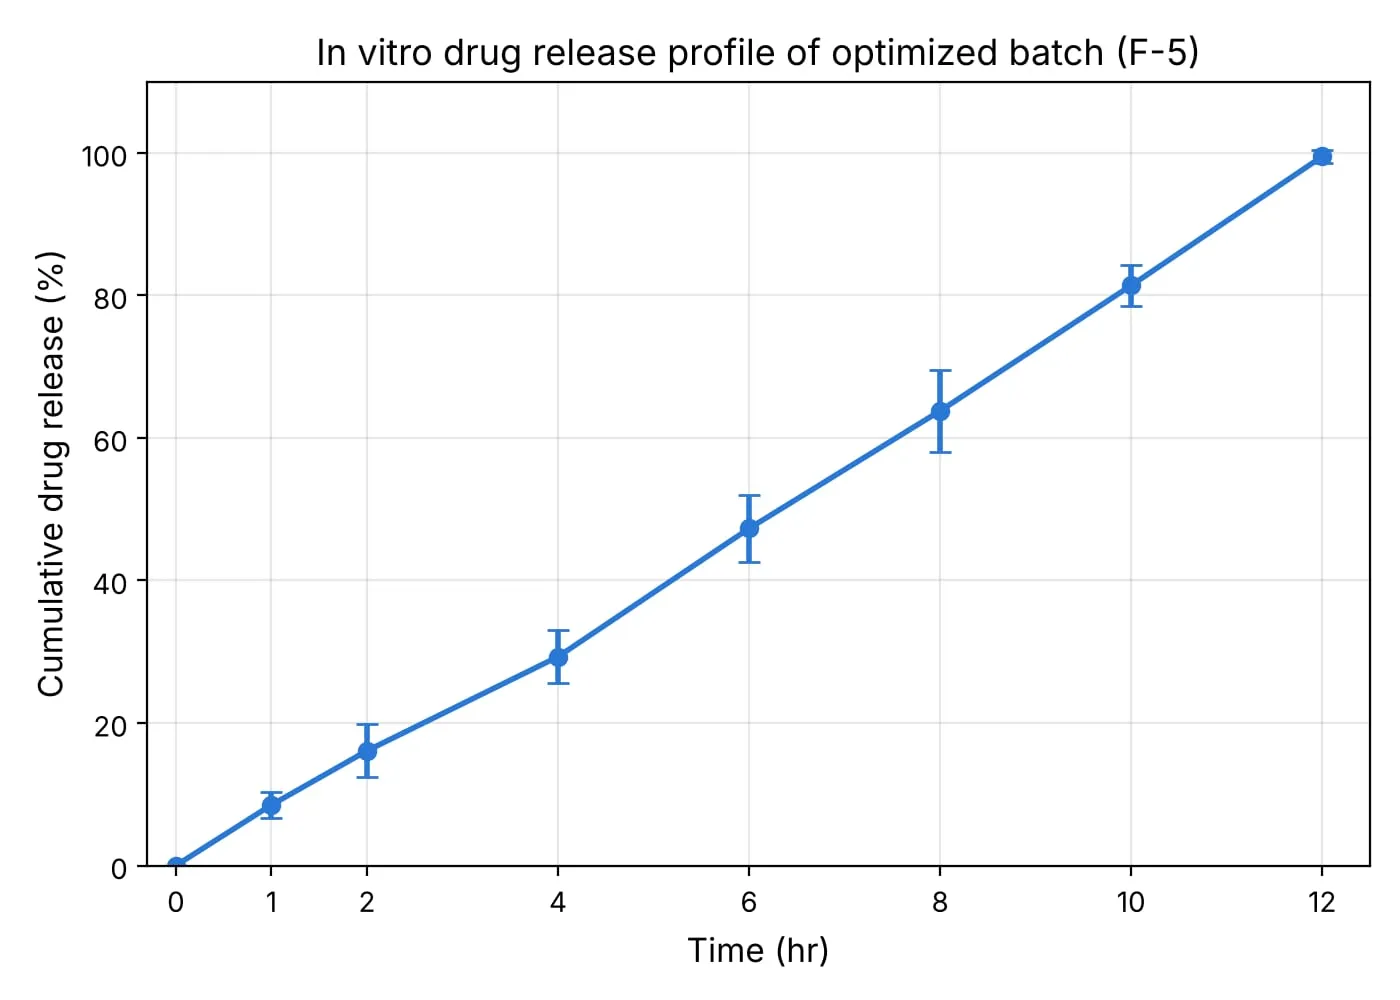
Figure 6: In Vitro Drug Release Profile of the Optimised Formulation F5
Drug release kinetics
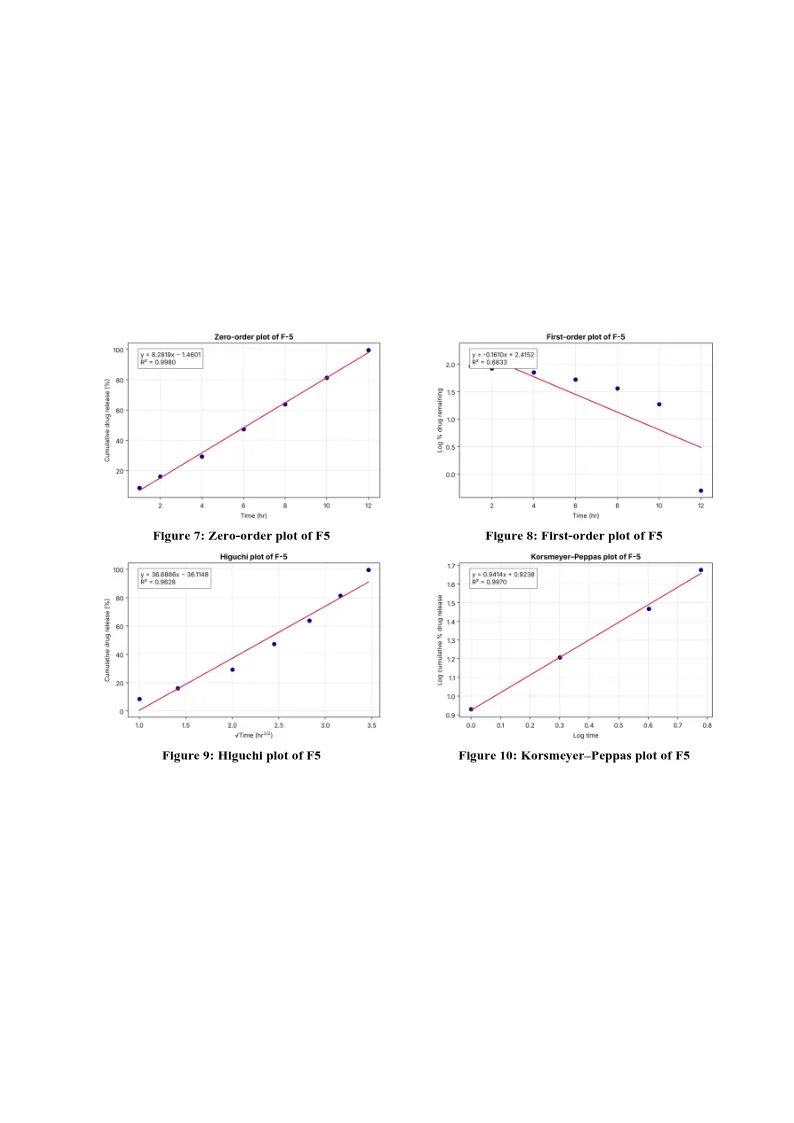
The release data of F5 were fitted to the zero-order, first-order, Higuchi and Korsmeyer–Peppas models (Table 10, Figures 7–10). The zero-order model gave the best fit (R² = 0.998; K0 = 8.28% h⁻¹, close to the theoretical 8.33 mg/h target), followed by the Korsmeyer–Peppas (R² = 0.997) and Higuchi (R² = 0.963) models; the first-order model fitted poorly (R² = 0.683). Release therefore proceeded at a nearly constant rate independent of the amount of drug remaining, as expected for an osmotic pump.
The Korsmeyer–Peppas release exponent was 0.941, which is above 0.89 and corresponds to super case II transport. This points to a complex mechanism in which osmotic pressure, relaxation of the polymeric membrane and diffusion of drug through the micropores formed by leaching of PVP all contribute. Because the Korsmeyer–Peppas model gives only an initial indication of mechanism, n should be read together with the other models; its value here is based on the initial 60% of release of one formulation.
Table 10: Mathematical Modelling and Drug Release Kinetics of the Optimised Formulation F5
| Formulation | Zero-order R² | First-order R² | Higuchi R² | Peppas n | Peppas R² | Mechanism of release |
|---|---|---|---|---|---|---|
| F5 | 0.998 | 0.683 | 0.963 | 0.941 | 0.997 | Super case II transport |
Accelerated stability studies
After storage of F5 at 40 ± 2 °C/75 ± 5% RH, drug content was 99.30 ± 0.70% initially, 99.12 ± 0.65% at 1 month and 98.96 ± 0.68% at 3 months (Table 11). The change over 3 months was only 0.34% and all values stayed within 95–105%, indicating that the formulation is stable with respect to drug content under accelerated conditions.
Table 11: Drug Content of the Optimised Formulation F5 After Accelerated Stability Studies (40 ± 2 °C/75 ± 5% RH)
| Parameter | Initial | After 1 month | After 3 months |
|---|---|---|---|
| Drug content (%) ± SD | 99.30 ± 0.70 | 99.12 ± 0.65 | 98.96 ± 0.68 |
SUMMARY AND CONCLUSION
SUMMARY.
Acebrophylline CPOP tablets were prepared by direct compression of 200 mg cores containing 100 mg of drug, with dextrose as osmogen (10, 20, 30 mg), followed by dip-coating with ethyl cellulose containing PVP as pore former (12, 24, 36 mg), giving nine formulations. Acebrophylline showed λmax at 274 nm and a linear calibration over 5–30 µg/ml, and FTIR showed retention of its characteristic bands in the mixture and the tablet. The blends showed good flow, and the tablets had satisfactory thickness, hardness, friability, weight variation and drug content. All formulations sustained release in phosphate buffer pH 7.4, and release rate and extent varied with the composition of the batches. F5 gave the highest release at 12 h (99.5%), the best fit to the zero-order model (R² = 0.998) and a Korsmeyer–Peppas exponent of 0.941, and its drug content remained within 95–105% after 3 months of accelerated storage.
CONCLUSION.
Acebrophylline can be formulated as a controlled porosity osmotic pump tablet that releases the drug in a regulated, near zero-order manner over 12 h in vitro. Further studies on the effect of medium pH, agitation intensity and osmotic pressure, on membrane morphology, and in vivo evaluation are needed to establish long-term stability, reproducibility and therapeutic performance.
Acknowledgments
The authors thank Dr. Reddy’s Laboratories, Hyderabad, for the gift sample of acebrophylline and Sarojini Naidu Vanita Pharmacy Maha Vidyalaya (Co-ed) for providing the facilities for this work.
REFERENCES

Syeda Sana Ilsa, P. M. Sameera, An Osmotically Driven Approach to Acebrophylline Delivery: Formulation, Optimization and Pharmaceutical Evaluation, Int. J. of Pharm. Sci., 2026, Vol 4, Issue 11, 2157-2167. https://doi.org/10.5281/zenodo.24216496
 10.5281/zenodo.24216496