

We use cookies to ensure our website works properly and to personalise your experience. Cookies policy
1,2,3,4Department of Pharmacy Practice, NET Pharmacy College, Navodaya Medical College Hospital & Research Centre, Raichur, Karnataka, India.
5Medical Superintendent, Navodaya Medical College Hospital & Research Centre, Raichur, Karnataka, India.
Clinical pharmacy practice is essential for optimizing medication therapy, preventing drug-related problems, and enhancing health-related quality of life. Evaluating patient satisfaction offers measurable feedback to optimize clinical pharmacy workflows and patient-provider interactions. To assess the levels of patient satisfaction with inpatient clinical pharmacy services in a tertiary care teaching hospital and identify key determinants influencing patient experience. A prospective cross-sectional study was conducted over a six-month duration (February to August 2025) among 100 inpatients admitted to Navodaya Medical College Hospital and Research Centre (NMCH & RC), Raichur. Data were obtained using a validated 15-item Likert-scale questionnaire addressing patient counselling, medication history interviews, pharmacist attitude, and communication clarity. Descriptive analysis was executed using SPSS version 20.0. Among 100 enrolled patients (mean age: 44.1 ± 15.09 years; male-to-female ratio: 1.3:1), 38% had primary or secondary education and 37% were illiterate. Diabetes Mellitus (31%) was the predominant condition counselled. High satisfaction was achieved for communication clarity (73% satisfied/completely satisfied) and medication counselling (67%). Pharmacist attitude and behaviour showed the lowest positive satisfaction (26%), with 51% neutral responses. Overall satisfaction with clinical pharmacy services was positive in 48% and neutral in 44% of patients. Clinical pharmacy services were well received by inpatients, particularly regarding communication clarity and medication counselling. Interpersonal skills, empathy, and structured follow-up represent primary opportunities for quality enhancement.
Clinical pharmacy practice is concerned with the promotion of effective, safe, and economical drug therapy. Pharmacy practice represents a broad health care discipline comprising clinical pharmacy and diverse patient care–oriented functions performed by pharmacists in institutional and community environments. These core functions encompass dispensing, drug distribution, health promotion, patient counselling, pharmacovigilance, medication reviews, and therapeutic drug monitoring (TDM). In nations such as India, drug use challenges remain widespread as a consequence of complex socioeconomic, medical, and clinical factors. Drug-related problems (DRPs) manifest at multiple stages of the medication use continuum, engaging prescribers, patients, pharmacists, and health care authorities. Clinical pharmacy practice across hospital wards provides direct clinical interventions that advance medicine use safety and overall therapeutic outcomes.1
Hospital clinical pharmacists engage in critical clinical responsibilities including adverse drug reaction (ADR) monitoring, patient counselling, ward round participation, medication history interviews (MHIs), medication reconciliation, and therapeutic drug monitoring.2 Adverse drug reactions are appreciable noxious or unintended reactions resulting from diagnostic or therapeutic interventions. Pharmacists contribute substantially to ADR detection, management, and institutional reporting. Structured patient counselling further enhances therapeutic compliance, prevents administration mistakes, and resolves patient concerns regarding medication regimens.3-5 In addition, patient satisfaction serves as a recognized measure of clinical quality and interpersonal care delivery. Evaluating satisfaction enables health care institutions to align pharmacy workflows with patient expectations and achieve superior treatment adherence.10-13 The present investigation was therefore undertaken to determine patient satisfaction levels with clinical pharmacy services provided in a 1000-bedded tertiary care teaching hospital and identify key determinants influencing overall patient satisfaction.
MATERIALS AND METHODS
Study Design and Setting
A prospective, hospital-based cross-sectional study was conducted over a six-month duration from
February 2025 to August 2025 at Navodaya Medical College Hospital and Research Centre (NMCH & RC), Raichur, Karnataka, India. NMCH & RC is a premier 1000-bedded multi-speciality tertiary care teaching hospital providing medical, surgical, intensive care, and dedicated clinical pharmacy services.
Study Participants and Sampling
The study enrolled a sample size of 100 inpatients utilizing simple random sampling. Inclusion criteria comprised inpatients aged 18 years and above admitted to medical and surgical wards who received clinical pharmacy services and provided written informed consent. Outpatients, critically ill intensive care patients, and individuals unwilling to provide consent were excluded.
Data Collection Instrument and Phases
The investigation was structured into three systematic phases. Phase I involved comprehensive literature evaluation and the design of a bilingual (English and Kannada) structured questionnaire. Internal consistency was validated using Cronbach's alpha statistical analysis. Phase II involved daily ward visits, patient enrolment, administration of informed consent, and completion of the 15-item questionnaire scored on a 5-point Likert scale (Strongly Agree = 4, Agree = 3, Neutral = 2, Disagree = 1, Strongly Disagree = 0). Phase III encompassed data compilation, score categorization, and statistical evaluation.
Ethical Approval
The study protocol, consent documents, and questionnaire format were reviewed and formally approved by the Medical Superintendent and institutional authorities of Navodaya Medical College Hospital and Research Centre and NET Pharmacy College, Raichur. Written informed consent was documented for all enrolled participants prior to data collection.
Statistical Analysis
Descriptive statistics including frequencies, percentages, and mean ± standard deviation (SD) were calculated using Statistical Package for the Social Sciences (SPSS) software, version 20.0. Tables and figures were utilized to summarize demographic, clinical, and domain-specific satisfaction data.
RESULTS
A total of 100 inpatients were evaluated during the six-month study period. The sociodemographic characteristics and clinical distribution of participants are detailed below.
Sociodemographic Profile
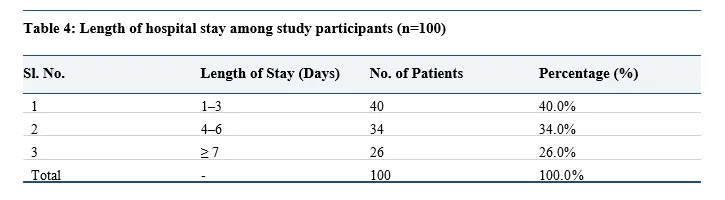
The mean age of the patient cohort was 44.1 ± 15.09 years. Patients aged 40–49 years represented the largest cohort (25%), followed by 20–29 years (23%) and 50–59 years (17%) (Table 1). The gender distribution comprised 57 male patients (57%) and 43 female patients (43%), establishing a male-tofemale ratio of 1.3:1 (Table 2). Regarding educational status, 38% had attained primary or secondary schooling, 37% were illiterate, and 25% were graduates or higher (Table 3). Assessment of hospitalization length revealed that 40% remained for 1–3 days, 34% for 4–6 days, and 26% for 7 days or more (Table 4).
Table 1: Age-wise Distribution of Study Participants (N=100)
| Sl. No. | Age Group (Years) | No. of Patients | Percentage (%) |
|---|---|---|---|
| 1 | 20–29 | 23 | 23.0% |
| 2 | 30–39 | 17 | 17.0% |
| 3 | 40–49 | 25 | 25.0% |
| 4 | 50–59 | 17 | 17.0% |
| 5 | 60–69 | 12 | 12.0% |
| 6 | 70–79 | 6 | 6.0% |
| Total | Mean Age: 44.1 ± 15.09 years | 100 | 100.0% |
Table 2: Gender Distribution of Study Participants (N=100)
| Sl. No. | Gender | No. of Patients | Percentage (%) |
|---|---|---|---|
| 1 | Male | 57 | 57.0% |
| 2 | Female | 43 | 43.0% |
| Total | Male to Female Ratio: 1.3:1 |
100 | 100.0% |
Table 3: Educational Status of Study Participants (N=100)
| Sl. No. | Educational Status | No. of Patients | Percentage (%) |
|---|---|---|---|
| 1 | Illiterate | 37 | 37.0% |
| 2 | Primary / Secondary School | 38 | 38.0% |
| 3 | Graduate and above | 25 | 25.0% |
| Total | - | 100 | 100.0% |
| Table 4: Length of hospital stay among study participants (n=100) | |||
| Sl. No. Length of Stay (Days) No. of Patients | Percentage (%) | ||
Clinical Distribution of Services
Patient counselling and medication history interviews were delivered across ten major disease classifications (Table 5). Diabetes Mellitus represented the largest clinical indication (31%), followed by Asthma (10%), Hypothyroidism (10%), Cellulitis (10%), Acute Hepatitis (10%), and Chronic Kidney Disease (8%).
Table 5: Disease Distribution for Patient Counselling and Medication History Interviews (N=100)
| Sl. No. | Clinical Diagnosis | No. of Patients | Percentage (%) |
|---|---|---|---|
| 1 | Diabetes Mellitus | 31 | 31.0% |
| 2 | Asthma | 10 | 10.0% |
| 3 | Hypothyroidism | 10 | 10.0% |
| 4 | Cellulitis | 10 | 10.0% |
| 5 | Acute Hepatitis | 10 | 10.0% |
| 6 | Chronic Kidney Disease (CKD) | 8 | 8.0% |
| 7 | Hysterectomy | 8 | 8.0% |
| 8 | Appendicitis | 5 | 5.0% |
| 9 | Cerebrovascular Accident (CVA) | 4 | 4.0% |
| 10 | Femur Fracture | 4 | 4.0% |
| Total | - | 100 | 100.0% |
Patient Satisfaction Across Service Domains
Patient satisfaction scores were categorized into distinct domains: patient counselling, pharmacist attitude and behaviour, communication clarity, and overall service satisfaction.
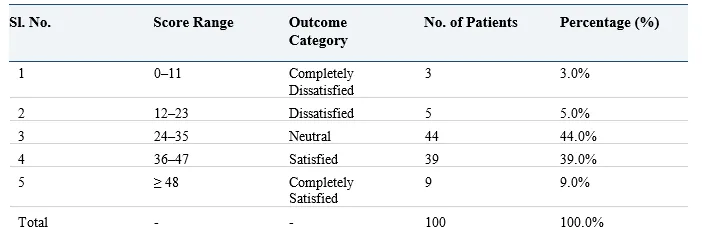
With respect to patient counselling, 57% were satisfied and 10% completely satisfied (combined positive: 67%), while 26% were neutral and 7% dissatisfied (Table 6). In contrast, evaluation of the clinical pharmacist's attitude and behaviour revealed that 51% gave neutral ratings, 24% were satisfied, 2% completely satisfied, and 23% dissatisfied (Table 7). Communication clarity represented the highest-scoring domain, with 62% satisfied, 11% completely satisfied (combined positive: 73%), 22% neutral, and 5% dissatisfied (Table 8). Overall satisfaction with clinical pharmacy services was positive in 48% (39% satisfied, 9% completely satisfied), neutral in 44%, and negative in 8% (Table 9).
Table 6: Patient Satisfaction with Counselling Provided (N=100)
| Sl. No. | Score Range | Outcome Category | No. of Patients | Percentage (%) |
|---|---|---|---|---|
| 1 | 0–3 | Completely Dissatisfied | 2 | 2.0% |

Table 7: Patient Satisfaction with Attitude and Behaviour of Clinical Pharmacist (N=100)
| Sl. No. | Score Range | Outcome Category | No. of Patients | Percentage (%) |
|---|---|---|---|---|
| 1 | 0–2 | Completely Dissatisfied | 3 | 3.0% |

Table 8: Patient Satisfaction with Communication Clarity of Clinical Pharmacist (N=100)
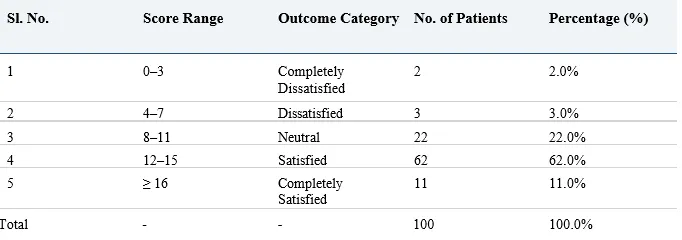
| Total - - 100 | 100.0% |
|---|---|
| Table 9: Overall patient satisfaction with clinical pharmacy services (n=100) | |
| Sl. No. Score Range Outcome No. of Patients Category |
Percentage (%) |
Item-Level Likert Responses
Analysis of the 15-item questionnaire demonstrated that patients agreed most strongly with privacy preservation during consultations (45.6% combined positive) and overall satisfaction with hospital pharmacy services (43.0% combined positive) (Table 10). Conversely, notable negative feedback was observed regarding comprehension verification (13.7% negative), medication storage guidance (16.0% negative), and communication in the patient's native dialect (16.0% negative).
Table 10: Percentage Distribution of Responses Across the 15-Item Questionnaire (N=100)
| Sl. No. | Questionnaire Statement | Strongly Agree (%) | Agree (%) | Neutral (%) | Disagree (%) | Strongly Disagree (%) |
|---|---|---|---|---|---|---|
| 1 | Pharmacist checked my understanding of medications | 4.9 | 36.3 | 45.1 | 2.9 | 10.8 |
| 2 | Pharmacist provided clear, relevant, and easy information | 4.0 | 37.0 | 45.0 | 7.0 | 7.0 |
| 3 | Pharmacist understood my concerns about medications | 1.0 | 40.4 | 43.4 | 4.0 | 7.1 |
| 4 | Satisfied with sufficiency of time given for counselling | 3.0 | 40.6 | 42.6 | 5.0 | 8.9 |
| 5 | Satisfied with pharmacy services received during visit |
4.0 | 39.0 | 43.0 | 6.0 | 8.0 |
| 6 | Pharmacy service respected my privacy | 5.0 | 40.6 | 41.6 | 3.0 | 9.9 |
| 7 | Clinical pharmacy personnel were respectful and polite | 3.0 | 37.0 | 42.0 | 7.0 | 11.0 |
| 8 | Pharmacist used local language to explain medication use | 1.9 | 38.7 | 43.4 | 6.6 | 9.4 |
| 9 Pharmacist instructed me on how to take medication |
2.9 | 37.9 | 44.7 | 6.8 | 7.8 | |
| 10 Satisfied with pharmacist behavior and attitude |
3.0 | 41.4 | 42.4 | 5.1 | 8.1 | |
| 11 Satisfied with medicine storage information provided |
3.0 | 39.0 | 42.0 | 5.0 | 11.0 | |
| 12 Pharmacist answered questions in an understandable way |
1.1 | 38.9 | 45.3 | 7.4 | 7.4 | |
| 13 Pharmacist helped manage issues like cost and side effects |
2.1 | 40.6 | 43.8 | 6.2 | 7.3 | |
| 14 Pharmacist followed up progress in a timely manner |
2.1 | 41.2 | 45.4 | 3.1 | 8.2 | |
| 15 Satisfied with history taking by clinical pharmacist |
5.0 | 38.6 | 44.6 | 5.0 | 6.9 | |
DISCUSSION
Patient satisfaction serves as a recognized multidimensional indicator reflecting technical, functional, and interpersonal health care performance.10-12 In this investigation, the patient population presented a mean age of 44.1 ± 15.09 years, with 66% situated between 30 and 60 years. This adult working demographic often contends with dual burdens of family obligations and progressive chronic diseases, rendering clinical pharmacy counselling and therapeutic regimen monitoring particularly impactful.3,8
Educational evaluation showed that 75% of respondents had limited formal schooling (37% illiterate and 38% primary/secondary education). Limited health literacy is strongly linked to inadequate drug compliance, higher rates of unintentional medication errors, and reluctance to query clinical providers.21,24 Consequently, clinical pharmacists practicing in this region must implement simplified verbal instruction, pictograms, and local Kannada vernacular to ensure optimal regimen comprehension.
The delivery of counselling and medication history interviews was concentrated primarily on chronic metabolic and pulmonary illnesses such as Diabetes Mellitus (31%) and Asthma (10%). Patients with chronic diseases require continuous education on dose scheduling, glycemic monitoring, inhaler technique, and lifestyle adaptation.19,23 Communication clarity emerged as the strongest domain, with 73% positive satisfaction, verifying that clinical pharmacists conveyed drug regimens effectively without overwhelming patients with medical jargon.20,24
In contrast, pharmacist attitude and behaviour was identified as the weakest domain, yielding only 26% positive satisfaction and a large neutral proportion of 51%. In hospital environments, patient perception is heavily governed by perceived empathy, patience, eye contact, and active listening.11,24 The substantial neutral cohort across multiple questionnaire items (41%–45%) suggests that while technical services were executed efficiently, interpersonal interactions were perceived as routine rather than personalized. Implementing institutional communication training, interactive 'teach-back' verification, and scheduled post-admission follow-up visits can effectively bridge this gap.
CONCLUSION
The findings indicate that clinical pharmacy services provided at Navodaya Medical College Hospital & Research Centre are well received by inpatients, demonstrating robust performance in communication clarity and medication counselling. Pharmacist interpersonal demeanour, empathetic engagement, and systematic comprehension checking were identified as key areas warranting improvement. Institutional implementation of patient-centred communication workshops and structured follow-up routines will optimize clinical pharmacy delivery and enhance therapeutic outcomes.
ACKNOWLEDGMENT
The authors express their sincere gratitude to the Medical Superintendent, physicians, nursing personnel, and administrative leadership of Navodaya Medical College Hospital & Research Centre and NET Pharmacy College, Raichur, for granting institutional permission and clinical facilities to conduct this research.
CONFLICTS OF INTEREST
The authors declare that they have no financial or commercial conflicts of interest pertaining to this study.
REFERENCES

Binu K. M., Mohammed Saqeeb, H. Doddayya, Khan Labeesh, Arun K. N., Assessment of Patient Satisfaction with Clinical Pharmacy Services Provided in a Tertiary Care Teaching Hospital, Int. J. of Pharm. Sci., 2026, Vol 4, Issue 11,
 10.5281/zenodo.24189766