Department of Pharmaceutical Chemistry, Adhiparasakthi College of Pharmacy Melmaruvathur (affiliated to)
The Tamil Nadu Dr. M.G.R. Medical University, Chennai- 32
The objective of the current study was to develop a novel technique, simple, precise, rapid, reproducible and selective UPLC method for the estimation of Prucalopride Succinate in bulk and tablet dosage form. Estimation was achieved by C18 (50mm×3mm×1.7µ) column using Potassium dihydrogen ortho phosphate and Methanol, Ratio 60:40 %w/w at ambient temperature. Flow Rate was 0.8ml/min, injection volume 2 µl and detectable wavelength at 225nm. The retention time for Prucalopride succinate was 0.61 minutes. The method was validated for specificity, linearity, precision, accuracy; robustness .The linearity of the proposed method was at the range of 50-150µg/ ml of Prucalopride succinate with a correlation coefficient of 0.9999. The precision (relative standard deviation – RSD) of six samples was 0.5066%. The accuracy (recovery) was 100.07 % and 100.19 %.and 99.93%.
UPLC is a modern technique which gives a new direction for liquid chromatography. UPLC refers to ultra performance liquid chromatography, which enhance mainly in three areas: “speed, resolution and sensitivity. Today’s pharmaceutical industries are looking for new ways to cut cost and shorten time for development of drugs while at the same time improving the quality of their products and analytical laboratories are not exception in this trend. Though High-performance liquid chromatography (HPLC) is a well-established reliable technique used in controlling the quality and consistency of active pharmaceutical ingredients (API’s) and dosage forms, it is often a slow technique because of the complexity of some of the samples, it could still be improved. Ultra performance liquid chromatography (UPLC) applicable for particle less than 2µm in diameter to acquire better resolution, speed, and sensitivity compared with High-performance liquid chromatography (HPLC). In twenty first centenary pharmaceutical industries are focusing for new ways to in economy and shorten time for development of drugs. Prucalopride succinate (PRCLD) is a “first in class” agent in a dihydrobenzo furan carboxamide derivative acting as a selective agonist for serotonin type 4 receptors (5-HT4) and developed as an enterokinetic agent for the treatment of chronic constipation [1-3]. Its chemical name is 4-amino-5-chloro-N-[1-(3-methoxypropyl) piperidin-4-yl]-2,3-dihydro-1-benzofuran-carboxamide; butanedioic acid.
The drug has also been tested for the treatment of chronic intestinal pseudo-obstruction. The primary measure of efficacy in the clinical trials is three or more spontaneous complete bowel movements per week; a secondary measure is an increase of at least one complete spontaneous bowel movement per week. This medication is used to treat chronic constipation; Prucalopride succinate is contraindicated where there is hypersensitivity to the active substance or to any of the excipients, renal impairment requiring dialysis, intestinal perforation or obstruction due to structural or functional disorder of the gut wall, obstructive ileus, severe inflammatory conditions ofthe intestinaltract,suchas Crohn'sdisease,and ulcerativecolitis and megarectum. Invitro data indicates that Prucalopride succinate has a low interaction potential, and therapeutic concentrations of Prucalopride succinate are not expected to affect the CYP-mediated metabolism of co-medicated medicinal products
So far to our present knowledge, no UPLC assay method for the determination of Prucalopride succinate in pharmaceutical formulation was available in literature. Moreover UPLC method can be the first choice of chromatographers among the UPLC, reflectance near-infrared and Fourier transform Raman spectroscopy methods. So, development is based on UPLC method.
A literature review revealed that Prucalopride succinate has been determined and studied by several procedures; quantitative analysis of Prucalopride succinate in bulk drug and pharmaceutical dosage is formed by Selective separation and characterization of stress degradation products and process impurities of Prucalopride Succinate by LC-QTOF-MS/MS. Baira Shandila Mahamuni. et.al (2016) few clinical method studies are reported Stephen Flach, . et.al (2015) Taleuzzaman M et.al (2015) Tayler, M.J. et.al (2016).There is no method reported for quantification of Prucalopride succinate by UPLC.
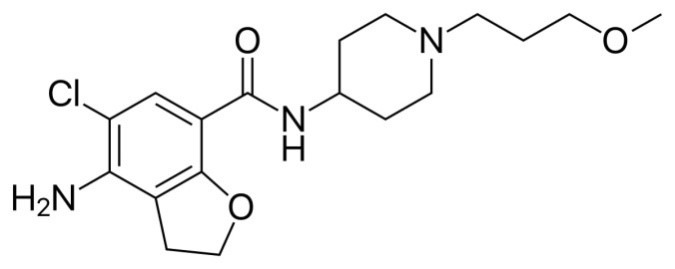
Figure: 1 Structure of Prucalopride succinate
Key words and Abbrevation: Prucalopride succinate(PRCLD),Uitra performance Liquid Chromatography(UPLC)
2. EXPERIMENTAL
2.1. Material and Reagents.
Pure PRCLD (Purity > 99.5) was procured as gift sample from Symed laboratories, Hyderabad, India. PRCLD tablet was purchased from local commercial sources. HPLC grade methanol was procured from Merck India, Mumbai, India. Potassium dihydrogen phosphate and ortho phosphoric acid (S.D. Fine Chemicals, Mumbai, India) were of analytical grade used for the preparation of mobile phase. HPLC grade water acquired from Millipore Milli-Q water system.
The high purity Milli-Q water was obtained through a Milli-Q Integral Water Purification System All other reagents were of analytical grade and used without further purification.
3. Methods
3.1. UPLC chromatographic conditions.
Chromatographic separation was developed and optimized with respect to the stationary and mobile phase compositions, flow-rate, sample volume, and detection wavelength. Separation was achieved by reverse-phase isocratic elution using a mobile phase. Freshly prepared mobile phase was filtered through an online 0.20 ?m filter and degassed continuously by an online degasser within the UPLC system. The detector wavelength was set at 225 nm and the injection volume was 1.0 ?l. Analysis of PRCLD was carried out on Agilent technology 1220 infinity LC with PDA detector. The output signal was monitored and processed using CHEM STATION OPEN LAB. The chromatographic column used was PHENOMENEX C18 (50x3.0) mm
Isocratic elution analysis was used throughout the analysis
3.2 Mobile Phase.
2.72g of potassium di hydrogen ortho phosphate was accurately weighed and dissolved in 1000ml of water and added 1ml of tri ethylamine, adjusted the pH 3.7 with ortho phosphoric acid and methanol in ratio of 60:40.
3.3 Preparation of standard stock solution
Stock solution of PRCLD was prepared by dissolving 25 mg of PRCLD powder into a 25ml volumetric flask in minimum quantity of methanol and made up to 25 ml with the same, to get the concentration 1000ppm.
3.4 Selection of wavelength and stability studies
The standard stock solution was diluted with the mobile phase consisting of buffer: methanol (60:40) which is degassed for 15 minutes by sonication to get the concentration of 10ppm .The solution was scanned in UV region of 200nm to 400nm, which can be used for the estimation of compound by UPLC. The absorbance of same solution was measured repeatedly for stability studies; PRCLD in mobile phase was found to be stable for 3 hours.
3.5 Preparation of calibration graph
In this progression, the aliquots of stock solution of PRCLD (0.5 – 1.5 mL) individually into a series of seven 10mL volumetric flasks and made up to the mark with mobile phase to get concentrations 50 – 150 ppm. All the solutions were injected and the chromatograms were recorded at 225 nm. The graph was plotted against concentration and the calibration curve was constructed. The above concentration range was found to be linear and obeys Beer’s law.
3.6 Preparation of Tablet Extract.
The 20 tablets (PRUWEL) had to be crushed together and finely powdered. Then a definite weight of the powder can be taken for further manipulation. From these, powdered, equivalent to 25 mg powder of PRCLD was weighed and transferred into a 25 mL volumetric flask and added 15mL of methanol to dissolve the substance with intermittent shaking and made up to the volume with the same(1000ppm). The solution was sonicated for 15 minutes, centrifuged at 200rpm for 15 minutes and filtered through Whatmann filter paper No.41. From the clear solution, further dilution was made by diluting 1mL into 10mL with mobile phase. Further 1 ml of this is diluted to 10 ml with mobile phase to obtain the expected concentration 10 ppm solution. A steady base line was recorded with optimized chromatographic conditions. After the concentration of each test solution was determined by using slope and intercept values from the calibration graph.
3.7 Recovery procedure
In order to ensure the reliability and suitability of the proposed method recovery studies were carried out. It was done by mixing known quantities of standard drug with formulation sample and the contents were pre analyzed by the proposed method. To a quantity of formulation equivalent to 25 mg of PRCLD and Standard drug PRCLD were added at 110%, 120% and 130% levels. This was extracted, diluted and reanalyzed as per the formulation procedure. Peak areas were noted at the respective Concentration. The amount of each drug recovered from the formulation was calculated for all the drugs by UPLC method. The amount estimation was repeated in triplet in each concentration
3.8 System suitability studies
The system suitability studies conceded as per ICH guidelines and USP. The parameters like capacity factor, tailing factor, asymmetry factor and number of theoretical plates were calculated.
4. METHOD VALIDATION
Authentification of the investigative method is the process that starts by laboratory studies in which the requirements of the performance properties of method are met for the intended analytical application. To the validation of analytical procedures UPLC method developed was validated according to International Conference on Harmonization (ICH) and USP guidelines. Various parameters or criteria are used for the method of validification, such as linearity, accuracy, precision, system suitability, ruggedness, limit of Quantification (LOQ) and limit of Detection(LOD)
4.1. Accuracy.
To determine the accuracy, PRCLD solutions were analyzed at three different concentrations (80%, 100%, and 120%). Mobile phase was used as a blank and injected before sample injection and the RSD values of peak area and retention time were calculated.
4.2. Precision.
Precision study was performed by injecting the solution containing PRCLD (100 ppm) repeatedly, and peak area was measure. The results were reported in terms of relative standard deviation. The intraday and interday precision study of PRCLD was carried out by estimating the corresponding responses on the same day and on different days and the results were reported in terms of relative standard deviation (RSD).
4.3. Limit of Detection (LOD) and Quantification (LOQ).
The LOD and LOQ were determined at a signal-to-noise ratio of 3 and 10, respectively. LOQ and LOD were achieved by injecting a series of dilute solution of PRCLD. The precision and accuracy for PRCLD at LOQ were checked.
4.4. Linearity.
Linearity was prepared from LOQ level to 150% of the actual sample concentration (100 ppm). A total of seven concentrations of the solutions were made separately and injected (LOQ: 50%, 70%, 90%, 100%, 110%, 130%, and 150% of the actual sample concentration). Calibration curve constructed by plotting peak area versus concentrations of the drug and regression equations was computed for PRCLD.
4.5. Robustness and Ruggedness.
Robustness of the method was studied by deliberately changing the experimental conditions. The experimental conditions changed like flow rate (0.8 ± 0.2 mL/min), column oven temperature (30 ± 5 ?C), mobile phase composition (buffer: methanol = 62: 38 and 58: 42, v/v), and wavelength (225 ± 2 nm). Different columns of same dimensions were used for the analysis. The study was performed on the same day and on three different days by three different analysts. In each case, the RSD values were calculated for the peak area and retention time. The number of theoretical plates and tailing factors was compared with those obtained under the optimized conditions.
5. RESULT AND DISCUSSION
Proper selection of the methods depends upon the nature of the sample (ionic or ionisable or neutral molecule) its molecular weight and solubility.
To develop a rugged and suitable UPLC method for the quantitative determination of PRCLD, the analytical conditions were selected after testing the different parameters such as diluents, buffer, buffer concentration, organic solvent for mobile phase and mobile phase composition and other chromatographic conditions.
UPLC becomes very famous in the recent year due to its fast approach for method development and validation of pharmaceutical drug. It is observed that the run time of the UPLC method is very short (3min) to that of HPLC methods. The present method discusses the development and validation of a method for quantitative analysis of PRCLD
5.1. Method Optimization.
The preliminary trials using different composition of mobile phases consisting of water with methanol or acetonitrile, did not give good peak shape
Different chromatographic conditions were experimented to achieve better efficiency of the chromatographic system. Choice of retention time, tailing, theoretical plates, and run time was the major task while developing the method.
Several proportions of buffer and solvents were evaluated in order to obtain suitable composition of mobile phase. In order to achieve symmetrical peak of PRCLD, various stationary phases like C8, C18 and phenyl column with different lengths (50 and 100 mm) were studied. From the summary, it is concluded that PHENOMENEX C18 (50x3.0) mm column has the ideal stationary phase for the determination of PRCLD. UV spectra of PRCLD showed that the drug was absorbed appreciably at 225 nm, so the same was selected as the detection wavelength during the studies.
5.2 System suitability
A system suitability test of the chromatographic system was performed before each validation run. Five replicate injections of standard preparation were injected and asymmetry, theoretical plate and % RSD of peak area were determined for same. For all system suitability injections, asymmetry was less than 2.0, theoretical plates were greater than 10,000 and % RSD of peak area less than 2.0 was found.
5.3. Accuracy.
The accuracy of the method was determined by calculating recoveries of PRCLD. The recoveries for PRCLD obtained were 100.07 %, 100.19% and 99.93%. The results of accuracy study and RSD illustrate that the method is accurate. The summary of accuracy study is revealed in Table 4.
5.4. Precision.
In the intermediate precision, study results demonstrate that RSD values were in the same order of magnitude as those obtained for precision study. Overall, the data for the precision study suggested that assay value for each test preparation was between 98 and 102% and RSD of all results was less than 2%.Therefore, from all the observations, it can be concluded that the proposed method is highly precise.
5.5. Linearity.
A linear correlation was obtained between the mean peak area and the concentration in the range of 50-150 ppm, from which the linear regression equation was computed and found to be ???? = 2300???? + 2844, ????2 = 0.999 (Figure 3). Where ???? is the mean peak area, ???? is the concentration of PRCLD in ????g/mL and ???? is the correlation coefficient. These results confirm the linearity relation between the mean peak area and concentration as well as the sensitivity of the method.
5.6. Robustness and Ruggedness.
The robustness of an analytical procedure is a measure of its capacity to remain unaffected by small but deliberate change in method parameters and provides an indication of its reliability during normal usage. On deliberate variation in chromatographic condition (flow rate, and mobile phase composition) of PRCLD analysis, the value of assay (with %RSD < 2>
5.7. Solution and Mobile Phase Stability.
At the specified time interval, % assay of PRCLD obtained from drug solution stability and mobile phase stability was within accepted criteria. The results also confirmed that the standard solution of drug and mobile phase were stable at least for 24 hours during the assay analysis. The summary of solution and mobile phase stability is illustrated.
CONCLUSION
A new UPLC method has been developed to be routinely applied to determine PRCLD in pharmaceutical dosage form. The method was validated by employment of ICH recommended condition. The method has been proved to be specific, linear, precise, accurate and robust. Hence, the method is recommended for routine quality control analysis and also sample analysis. Method development and validation of PRCLD drug was carried out under the circumstances of using mobile phase buffer and methanol which give sharp peak and UV spectra also. The developed UPLC method was found to be simple, rapid, selective accurate, precise for the concurrent estimation of drug in dosage form. The method was evaluated in best condition, linear relation including coefficient of correlation, linearity, robustness, and accuracy, precision. The percent RSD for all parameter was found to be less than two which indicate the validity of method and assay result obtained by this method are in fair agreement. . All result obtained with proposed method confirm the suitability of these method for the analysis of pharmaceutical dosage form. The proposed method has been successfully applied for routine in process quality control
ACKNOWLEDGMENT
The authors wish to thank Sakthi Arul Thiru Amma and Thirumathi Amma ACMEC Trust, for providing facilities to do the work in successful manner. We are grateful to thank our Dean Dr. T. Vetrichelvan and Principal Dr. D. Nagavalli for the kind support and encouraging for the completion of work.
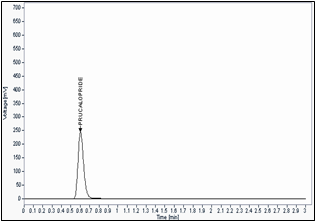
Fig -2 Standard chromatogram by UPLC
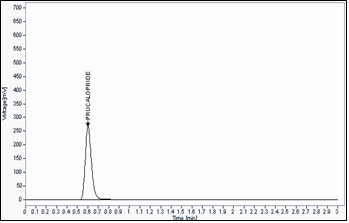
Fig -3 Sample chromatogram by UPLC
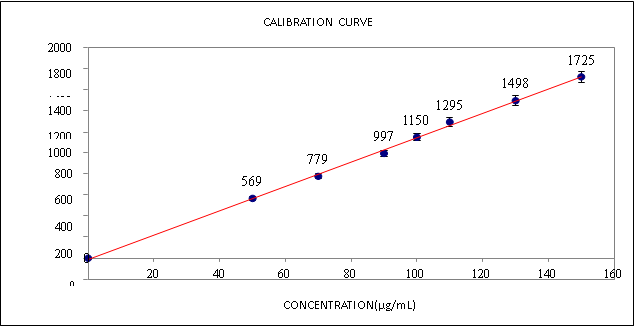
Fig -4 Calibration Curve Of Prucalopride Succinate By Uplc Method
Table: 1 System Suitability Parameters
|
Parameters |
Prucalopride succinate |
Standard limit |
|
Retention time |
0.6 |
- |
|
Tailing Factor |
1.34 |
< 2> |
|
Asymmetrical factor |
1 |
< 2> |
|
Theoritical plates |
500 |
< 2000> |
Table: 2 Solution and mobile phase stability study
|
|
Initial |
6 hr |
12 hr |
24 hr |
48 hr |
|
% Assay for solution stability |
99.82 |
100.11 |
99.52 |
99.67 |
99.38 |
|
% Assay for solution mobile phase stability |
100.17 |
99.83 |
100.06 |
99.32 |
99.74 |
TAB-3 OPTICAL PARAMETERS
|
S. No |
Parameters |
UPLC method |
|
1. |
? max (nm) |
225 nm |
|
2. |
Beer’s law limit (µg/ mL) |
50 - 150 |
|
3. |
Correlation co-efficient |
0.999 |
|
4. |
Regression equation (Y= mx + c) |
Y = 11.5880x -12.33 |
|
5. |
Slope (m) |
11.5880 |
|
6. |
Intercept (c) |
-12.33 |
|
7. |
LOD ( µg/ mL) |
8.6031 |
|
8. |
LOQ ( µg/ mL) |
26.070 |
|
9. |
Standard error of mean |
21.4928 |
|
10. |
Molar absorbtivity |
5784687.73 |
|
11. |
Sandell’s sensitivity (µg/cm2/0.001 A.U.) |
8.62955 |
Table 4: Assay results of tablet dosage form using proposed method
|
S.NO |
Labelled amount (mg/tab) |
Amount found (mg/tab) |
Percentage obtained (%) |
Average percentage found (%) |
S.D (+/-) |
% R.S.D |
S.E |
|
1. |
2 |
1.981 |
99.05 |
|
|
|
|
|
2. |
2 |
2.004 |
100.20 |
|
|
|
|
|
3. |
2 |
2.009 |
10045 |
100.05 % |
0.5069 |
0.5066 |
0.0140 |
|
|
|
|
|
|
|
|
|
Table – 5: Evaluation data of accuracy study
|
|
Labelled amount (mg\tab) |
Percentage obtained (%) |
S.D |
% R.S.D |
|||
|
Intraday |
Interday |
Intraday |
Interday |
Intraday |
Interday |
||
|
1. |
2 |
98.05 |
99.71 |
0.7466 |
0.7474 |
1.7061 |
0.9160 |
|
2. |
2 |
100.20 |
100.5 |
||||
|
3. |
2 |
100.45 |
98.68 |
||||
Table –6 Intraday and Interday Analysis
|
Drug |
% |
Amount present (µg/mL) |
Amount added (µg/mL) |
Amount estimated (µg/mL)* |
Amount recovered (µg/mL)* |
% Recovery |
Average (%) ± S.D |
% R.S.D |
S.E |
|
PRCS |
110 |
10 |
11 |
21.18 |
11.18 |
100.85 |
100.07 |
0.6875 |
0.0764 |
|
|
120 |
10 |
12 |
22.10 |
12.10 |
100.46 |
100.19 |
0.2339 |
0.0260 |
|
|
130 |
10 |
13 |
22.99 |
12.99 |
99.97 |
99.93 |
0.1154 |
0.0128 |
|
|
|
|
|
|
|
|
|
|
|
REFERENCES

Dr. G. Abirami*, Dr. T. Vetrichelvan, M. Raman, A Novel Validated Uplc Method for The Determination of Prucalopride Succinate in Solid Dosage Form, Int. J. of Pharm. Sci., 2024, Vol 2, Issue 12, 1035-1043. https://doi.org/10.5281/zenodo.14332878
 10.5281/zenodo.14332878
