Anemia is a frequent complication of chronic kidney disease (CKD), defined by hemoglobin levels below 13.1 g/dL in males and 12.0 g/dL in premenopausal females. It typically presents as a hypoproliferative, normochromic, normocytic anemia, significantly impacting the quality of life and increasing morbidity in CKD patients. The aim of this study is to evaluate the effectiveness of erythropoietin alone versus a combination of erythropoietin and desidustat in managing anemia associated with CKD. A prospective comparative study was conducted at Durgabai Deshmukh Hospital, Hyderabad, following ethics committee approval and obtaining informed consent from all participants. A total of 70 CKD patients were included, with 56 patients (80%) receiving erythropoietin alone and 14 patients (20%) receiving a combination of erythropoietin with desidustat. Data were collected and analyzed using appropriate statistical tools.The results showed that erythropoietin therapy led to a significant mean increase in hemoglobin levels (71%), compared to a slight improvement (70%) in the combination group. Additionally, erythropoietin alone contributed to a notable reduction in serum creatinine levels, from a mean of 2.78 mg/dL to 1.07 mg/dL. However, a decrease in glomerular filtration rate (GFR) was observed, dropping from a mean of 77 ml/min to 66 ml/min.This study suggests that erythropoietin is a safe and effective option for treating anemia in CKD patients, showing clear benefits in improving hemoglobin levels and reducing serum creatinine. The addition of desidustat provided minimal additional advantage, highlighting the need for further research into its role in combination therapy.
Anemia is generally defined as haemoglobin levels less than 13.1 g/dL for males and 12.0 g/dL for premenopausal women. It is a form of hypo proliferative, normochromic, normocytic anemia brought on by chronic kidney disease (CKD). Among other comorbidities of CKD, it is commonly associated with poor CKD results and greater mortality.[1] The insufficient production of erythropoietin by failing kidneys results in a decrease in the stimulation of red blood cell (RBC) formation in the bone marrow. Although there is variation across patients, the degree of anemia worsens as renal function impairment advances. The Hct typically starts to decrease when the plasma creatinine level rises above 2 mg/dl and decreases when the glomerular filtration rate (GFR) drops1–3. Dropped erythropoietin has lately been linked with the down regulation of hypoxia- inducible factor (HIF), a recap factor that regulates gene expression of erythropoietin.[1]
Chronic Kidney Disease:
Kidney damage or an estimated glomerular filtration rate (eGFR) of less than 60 ml/min is considered chronic kidney disease (CKD). regardless of the aetiology, that lasts for three months or more. Kidney replacement therapy, such as dialysis or transplantation, is eventually required due to the increasing loss of kidney function. Increased urine albumin excretion rates, anomalies in urinary sediment, or pathologic abnormalities indicated by imaging investigations or renal biopsy are all considered signs of kidney impairment. [2]
The following is a classification of the stages of CKD:
Stage 1: Kidney damage with normal or increased GFR (>90 mL/min/1.73 m 2)
Stage 2: Mild reduction in GFR (60-89 mL/min/1.73 m 2)
Stage 3a: Moderate reduction in GFR (45-59 mL/min/1.73 m 2)
Stage 3b: GFR declines moderately (30–44 mL/min/1.73 m 2)
Stage 4: Severe reduction in GFR (15-29 mL/min/1.73 m 2)
Stage 5: Dialysis or kidney failure (GFR < 15 mL/min/1.73 m 2)
Anaemia:
A decrease in the percentage of red blood cells is known as anemia. Anemia is a symptom of an underlying illness rather than a diagnosis. The sharpness of onset, the aetiology of anemia, and the existence of additional comorbidities particularly cardiovascular disease all influence a patient prognosis. The majority of patients exhibit anemia-related symptoms when the haemoglobin level falls below 7.0 g/dL.[3] The kidney produces erythropoietin (EPO), which is the main factor that stimulates the creation of red blood cells (RBCs). EPO is primarily stimulated by tissue hypoxia, and its levels are often inversely correlated with haemoglobin concentration. Put differently, a person with low haemoglobin and anemia has higher amounts of EPO.[4]
Etiology:
Signs And Symptoms:
Pathophysiology:
Hypoxia Inducible Factor System:
Treatment:
EPO production in CKD:
Hypoxia Inducible Factor System:
MATERIALS AND METHODS:
Aim:
A study on efficacy of erythropoietin versus erythropoietin with desidustat in treating chronic kidney disease with anemia.
Objectives:
MATERIALS AND METHODOLOGY:
RESULT AND DISCUSSION:
In this study, a total of 60 case report were reviewed, where erythropoietin and desidustat were compared using following parameters which includes anemia, serum creatinine, GFR levels.
Table1: Distribution Based on Mean Haemoglobin by Treatment:
|
Treatment |
Mean |
Std. Deviation |
P value |
|
|
Hemoglobin_Day1 |
inj. Eponef |
8.0446 |
.48126 |
0.003 |
|
inj. Eponef and T. OXEMIA |
7.4286 |
1.16845 |
||
|
Hemoglobin_Day2 |
inj. Eponef |
8.5268 |
.49119 |
0.134 |
|
inj. Eponef and T. OXEMIA |
8.2786 |
.74336 |
||
|
Hemoglobin_Day3 |
inj. Eponef |
9.2391 |
.91191 |
0.049 |
|
inj. Eponef and T. OXEMIA |
8.4286 |
.91600 |
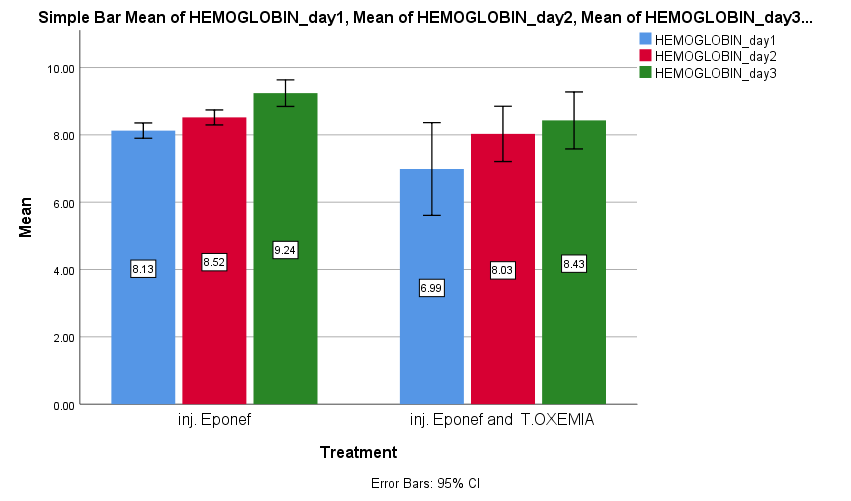
Figure :1 Bar Graph Depicts the Mean of Haemoglobin by Treatment.
RESULT:
The haemoglobin levels increased drastically when Inj. Eponef was administered. Mean average was found to be 8.0446 >8.5268 >9.2391 respectively, whereas when Inj. Eponef with T. oxemia was administered the haemoglobin levels didn’t increase much. There was no significant difference seen between the baseline parameter.
Distribution Of Subject Based on Mean Serum Creatinine by Treatment
|
Treatment |
Mean |
Std. Deviation |
P value |
|
|
Serumcrea_Day1 |
inj. Eponef |
2.6016 |
.67784 |
<0.0.01 |
|
inj. Eponef and T. OXEMIA |
3.5677 |
.86451 |
||
|
Serumcrea_Day2 |
inj. Eponef |
1.7555 |
.70661 |
<0.001 |
|
inj. Eponef and T. OXEMIA |
2.7425 |
.72164 |
||
|
Serumcrea_Day3 |
inj. Eponef |
1.0677 |
.62895 |
0.001 |
|
inj. Eponef and T. OXEMIA |
2.0237 |
.63074 |
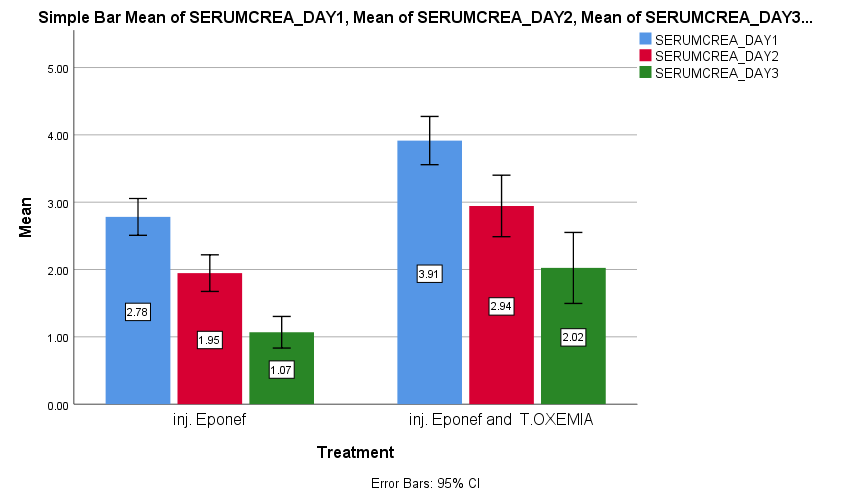
Figure :2 Bar Graph Depicts the Distribution Of Subject Based On Meam Serum Creatinine By Treatment.
RESULT: The serum creatinine levels decreased drastically when Inj. Eponef was administered. Mean average was 2.6016>1.7555>1.0677 respectively, whereas when Inj. Eponef with T. oxemia was administered the serum creatinine levels didn’t decrease much. There was no significant difference seen between the baseline parameter.
Distribution Based on Mean GFR With Treatment:
|
|
Treatment |
Mean |
Std. Deviation |
P value |
|
GFR_day1 |
inj. Eponef |
65.88 |
7.267 |
0.001 |
|
inj. Eponef and T.OXEMIA |
57.29 |
12.431 |
||
|
GFR_day2 |
inj. Eponef |
70.54 |
7.772 |
0.009 |
|
inj. Eponef and T.OXEMIA |
63.21 |
13.463 |
||
|
GFR_day3 |
inj. Eponef |
76.89 |
8.798 |
0.163 |
|
inj. Eponef and T.OXEMIA |
72.43 |
16.090 |
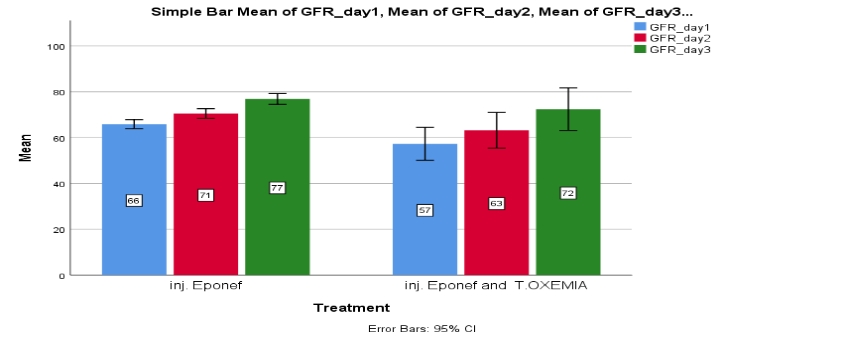
Figure :3 Bar Graph Shows the Distribution of Subjects Based on Mean GFR By Treatment.
RESULT: The GFR levels increased drastically when Inj. Eponef was administered. Mean average was 65.88>70.54>76.89 respectively, whereas when Inj. Eponef with T. oxemia was administered the GFR levels didn’t increase much effectively. The baseline parameter did not vary much.
Disruption Of Subject Based on Estimated Mean of Measure of Haemoglobin by Treatment
|
Treatment |
Mean |
Std. Deviation |
P value |
|
|
inj. Eponef |
Hemoglobin_Day1 |
8.1261 |
.52503 |
<0.001 |
|
Hemoglobin_Day2 |
8.5174 |
.51580 |
||
|
Hemoglobin_Day3 |
9.2391 |
.91191 |
||
|
inj. Eponef and T. OXEMIA |
Hemoglobin_Day1 |
6.9857 |
1.48933 |
0.001 |
|
Hemoglobin_Day2 |
8.0286 |
.88828 |
||
|
Hemoglobin_Day3 |
8.4286 |
.91600 |
||
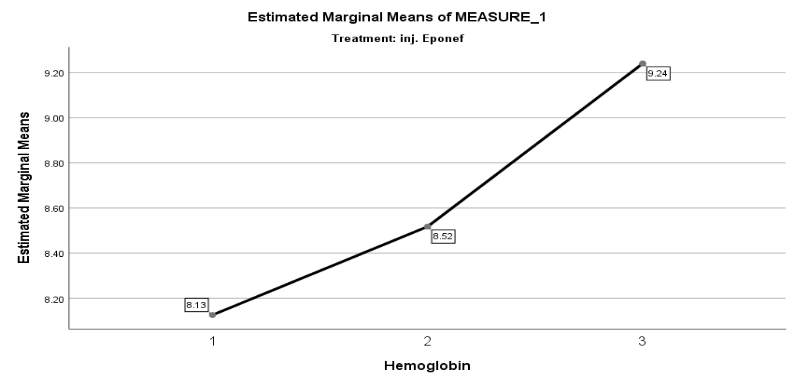
RESULT:
The haemoglobin levels showed drastic increase when Inj.Eponef was given to 70 subject. The average mean of haemoglobin was 8.13>8.52>9.25. There was no significant difference in baseline parameters.
RESULT:
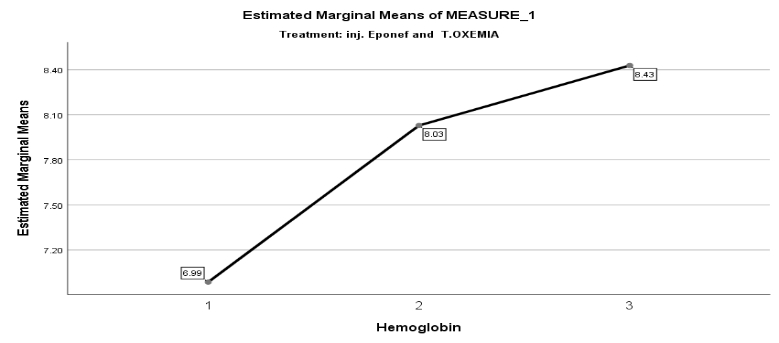
The haemoglobin levels didn’t increase when Inj.eponef with T. oxemia. The average mean of haemoglobin was 6.99>8.03.>8.43 there was no significant difference in baseline parameters.
Disruption Of Subject Based On Estimated Mean Of Measure Of Serum Creatinine By Treatment
|
Treatment |
Mean |
Std. Deviation |
P value |
|
|
inj. Eponef |
Serumcrea_Day1 |
2.7810 |
.73232 |
<0.001\ |
|
Serumcrea_Day2 |
1.9463 |
.72749 |
||
|
Serumcrea_Day3 |
1.0677 |
.62895 |
||
|
inj. Eponef and T.OXEMIA |
Serumcrea_Day1 |
3.9150 |
.42842 |
<0.001 |
|
Serumcrea_Day2 |
2.9438 |
.54610 |
||
|
Serumcrea_Day3 |
2.0237 |
.63074 |
||
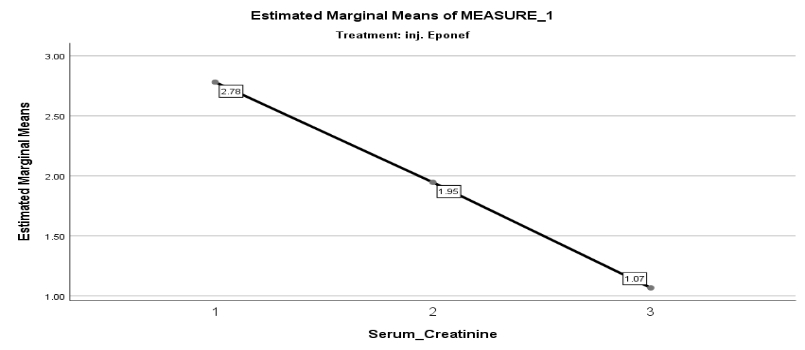
RESULT: Among 70 subjects taken the estimated marginal mean for serum creatinine levels showed drastically decrease when Inj eponef was given to patients. The average mean of serum creatinine was 2.78>1.95>1.07. there was no significant difference in baseline parameters.

|
Treatment |
Mean |
Std. Deviation |
P value |
|
|
inj. Eponef |
GFR_day1 |
65.88 |
7.267 |
<0.001 |
|
GFR_day2 |
70.54 |
7.772 |
||
|
GFR_day3 |
76.89 |
8.798 |
||
|
inj. Eponef and T. OXEMIA |
GFR_day1 |
57.29 |
12.431 |
<0.001 |
|
GFR_day2 |
63.21 |
13.463 |
||
|
GFR_day3 |
72.43 |
16.090 |
||
RESULT:
Among 70 subjects taken the estimated marginal mean for serum creatinine levels was ineffective in treating CKD with anemia when Inj eponef with T. oxemia was given to patients. The average mean of was creatinine 3.92>2.94>2.02. There was no significant difference in baseline parameters.
Distribution Of Subject Based On Estimated Mean Of Measure Of GFR By Treatment
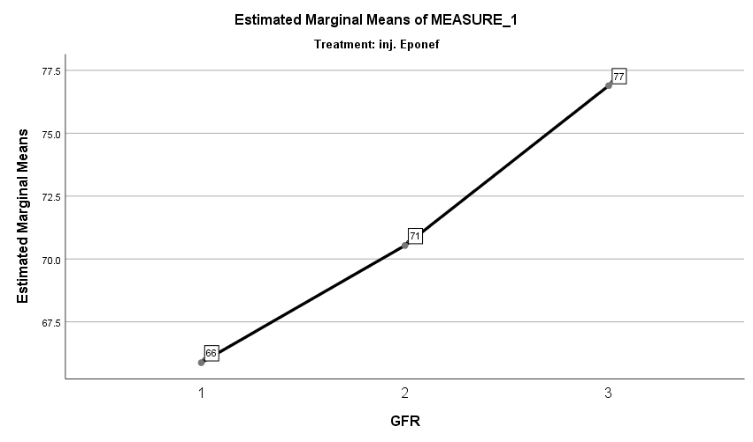
RESULT: Among 70 subjects taken the estimated marginal mean for GFR levels showed drastically increase and showed effective in treating CKD with anemia when Inj eponef was given to patients. The average mean of GFR was 66>71>77. There was no significant difference in baseline parameters.
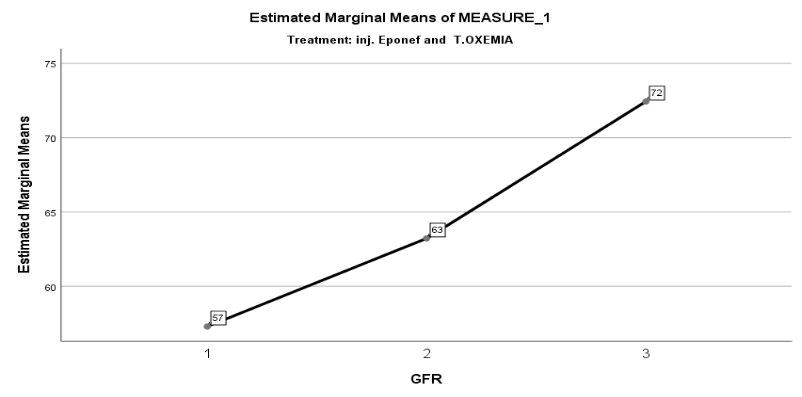
RESULT:
Among 70 subjects taken the estimated marginal mean for GFR levels was ineffective within in treating CKD with anemia ,when Inj eponef with T. oxemia was given to patient. The average mean of GFR was 57>63>72 there was no significant difference in baseline parameters.
CONCULSION:
Therefore, we think that erythropoietin is a safe and effective medicine to treat the complications caused due kidney dysfunction and improve in quality of life.
Conflict Of Interest:
The authors have no conflicts of interest regarding this investigation.
ACKNOWLEDGMENT
We sincerely thank the Nephrology Department and our respected guides for their support, which made this study successful. The knowledge gained will be valuable for our future endeavors.
REFERENCES


Arifa Begum S. K.*, Asha Raj, Swathi Boddupally, Samreen, Are Bindhu, B. Bindu2, Dileep Katikala, A Study on Efficacy of Erythropoietin Versus Erythropoietin with Desidustat in Treating Chronic Kidney Disease with Anemia, Int. J. of Pharm. Sci., 2025, Vol 3, Issue 5, 545-556 https://doi.org/10.5281/zenodo.15335482
 10.5281/zenodo.15335482
