
We use cookies to ensure our website works properly and to personalise your experience. Cookies policy
Department of Pharmaceutical Analysis, CMR College of Pharmacy, Hyderabad, Telangana.
A simple and selective UV method is described for the determination of Ranolazine in bulk and pharmaceutical dosage form. This study describes the validation of a UV Spectrophotometric method for the quantitative determination of Ranolazine in pharmaceutical dosage form using acetate buffer (pH 4.0) as solvent. The maximum absorbance was found at 272 nm. Linearity was observed in the range of 10-50 µg/ml for ranolazine ( r2 0.9989) for drugs estimated by the proposed method was in good agreement with the label claim. The %RSD for Intraday and Interday precision studies was found to be 1.8 and 1.6 respectively. The % assay was found to be 99.8%. The average % recovery of ranolazine was found to be in between 98.5-101.7%. LOD and LOQ was found to be 0.83 µg/ml and 2.5 µg/ml respectively.
Ranolazine is the recommended medication for treating angina pectoris.This well-tolerated medicine specifically blocks the late sodium current and is a derivative of piperazine. Its IUPACname is N?(2,6?dimethylphenyl)?4(2?hydroxy?3?[2?meth?oxyphenoxy]?propyl)?1?piperazine acetamide dihydrochloride.[1]The sodium and potassium ion channel currents are inhibited by ranolazine at clinically therapeutic doses. suppression of the inward sodium current's late phase during heart repolarization. Lowering that current raises the amounts of calcium inside cells to decline. Consequently, the heart wall becomes less tense, thereby reducing the quantity of oxygen required by the muscles.[2-3]A white, crystalline powder that dissolves easily in dichloromethane, methanol, and acetate buffer. Sparingly soluble in acetone, ethanol, and acetonitrile, slightly soluble in ethyl acetate, isopropanol, toluene, and ethyl ether, and extremely weakly soluble in water.[4-6]A survey of the literature indicates that bulk drug samples and pharmaceutical tablet dosage forms containing ranolazine were analyzed using UV Spectrophotometric analytical methods developed under different conditions.[7-9] Ranolazine comes in a variety of dosage forms on the market, such as film-coated, oval-shaped, extended-release tablets. The recommended dosing range for ranolazine is 500–1000 mg twice a day.[10-11]UV-visible spectrophotometry is one of the techniques used in pharmaceutical analysis the most frequently. The fundamental idea behind spectrophotometric quantitative analysis is Beer- Lambert law.[12-14]The objective of this study was to develop a quantitative spectrophotometric method for measuring ranolazine that was simple to use, precise, fast, reliable, and affordable. We developed a procedure in this manner with the aid of the International Conference on Harmonization (ICH) Guidelinesfor the purpose of measuring ranolazine in pharmaceutical dosage forms and bulk drug samples.
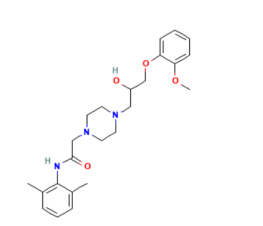
Figure 1: Chemical Structure of Ranolazine
MATERIALS AND METHODS:
Materials:
Sodium hydroxide pellets, glacial acetic acid, distilled water, ranolazine pure drug were procured from Research Lab. Ranolazine extended-release tablets(500 mg) were purchased from a local pharmacy store.
Instruments Used:
UV-Visible spectrophotometer with UV Win software and make was PG-Instruments. Weighing balances and matching quartz cells with a 1 cm cell path length were utilized along with the mentioned equipment, which had automatic wavelength accuracy of 0.1 nm and pH meter.
METHOD DEVELOPMENT
Standard stock solution preparation:
Standard stock solution was prepared by accurately weighing 10mg of Ranolazine and transferred in to 10 ml of volumetric flask and then dissolved in few ml of acetate buffer pH(4.0) until it solubilizes and the volume was made up to the mark with acetate buffer to obtain the concentration of 1 mg/ml or 1000 µg/ml (standard stock solution-1). From stock 1 solution pipette out 10 ml and transfer to 100 ml volumetric flask and made up to the mark with acetate buffer, to obtain the concentration of 100 µg/ml (standard stock solution-2).[15-16]
Selection of wavelength for analysis of Ranolazine:
The stock solution was then scanned in UV region from 200- 400 nm to get ?max of 270nm.
Selection of solvent:
Several trials were done to find out the right solvent system for dissolving the drug. The solvents like methanol, distilled water, acetate buffer of different pH were tried depending on the solubility of the Ranolazine. The solvents such as methanol, acetate buffer were tried based on the solubility of the drug.
Method validation:
According to ICH Q2 (R1) and USP criteria, the suggested technique was validated for a number of parameters, including linearity, precision, assay, accuracy, robustness and limit of detection (LOD),limit of quantification (LOQ).[17-18]
Linearity:
Different concentrations of ranolazine solution concentrations were prepared using 100 ?g/ml to give concentrations from 10 to 50µg/ml. The absorbance of these solutions is noted at wavelength of 270nm. The graph of concentration vs absorbance of linearity solutions was plotted.
Precision:
Intraday and Interday (between 2 days) precision study was carried out by using 10 µg/ml concentration of Ranolazine and analysed.
Accuracy:
Accuracy of the proposed method was determined using recovery studies. The recovery studies were carried out by adding different amounts (80%, 100%, and 120%) of the pure drug to the pre-analysed formulation. The solutions were prepared in triplicates and the %recovery was calculated.
Robustness:
Robustness was obtained by performing the analysis at two different wavelengths (±1 nm). The results were reported.
Limit of Detection and Limit of Quantitation:
The parameters LOD and LOQ were determined on the basis of response and slope of the regression equation. The limit of detection (LOD) and the limit of quantitation (LOQ) of the drug were derived by calculating using the following equations designated by International Conference on Harmonization (ICH Q2) guidelines[19-22].
LOD = 3.3 × ?/S
LOQ = 10× ?/S
Where,
? = Standard deviation of the response
S = Slope of the calibration curve.
Preparation of sample solution for %assay:
Take 10 tablets and weighed individually, made it into fine powder by using Mortar and pestle. From this powder weighed accurately a quantity of powder equivalent to 100 mg of Ranolazine. Transfer it into the 100 ml volumetric flask, add few ml acetate buffer to dissolve the powder and then volume was made up to mark with acetate buffer. Filter the solution through Whatmann filter paper and pipette out 1ml from the solution and diluted up to the 10 ml with measure the absorbance of six replicates at 270 nm. Determine the amount of % Ranolazine in tablet according to the following formula.[23-24]
% Assay = ???????? ???? ???????? ???? ????????????????????????????. ????. ???? ????????????. ????????.
---------------------------------------------------------- ????PS
???????? ???? ???????????????????????????????? ????. ????. ???? ???????? ???? ????????
Where,
WS = Weight of standard
WT = Weight of Test
AT = Absorbance of Ranolazine in the test solution
AS = Absorbance of Ranolazine in the standard solution
Standard D.F = Standard dilution factor
Sample D.F. = Sample dilution factor
PS = Purity of working standard [%]
LC = Label claim of the Ranolazine
RESULTS AND DISCUSSION:
Linearity:
The linearity concentration lies for ranolazine lies in between 10-50 µg/ml. Calibration curve and linearity data was shown in Table:-1 and Fig-2. The correlation coefficient, intercept and slope were calculated for Ranolazine and results were shown in Table:-2
Table:-1 Linearity data of Ranolazine
|
SNO. |
Concentration(µg/ml) |
Absorbance |
|
1 |
10 |
0.106 |
|
2 |
20 |
0.188 |
|
3 |
30 |
0.271 |
|
4 |
40 |
0.334 |
|
5 |
50 |
0.41 |
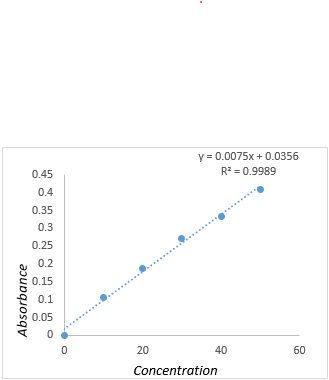
Figure: 2 Calibration curve of ranolazine at 270 nm
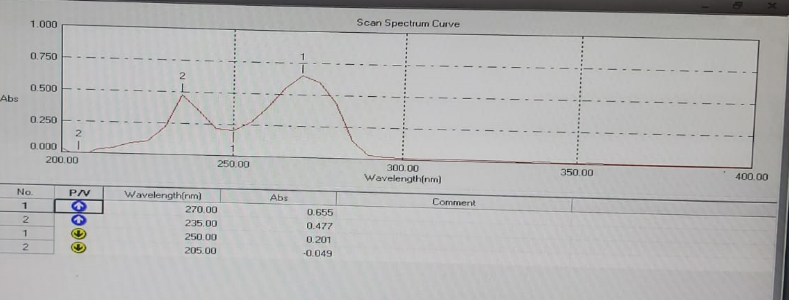
Figure:3 Absorption spectrum of Ranolazine
Table: 2 Optical characteristics of ranolazine
|
Parameters |
Ranolazine |
|
?max |
270nm |
|
Slope |
0.0075 |
|
Linearity |
10 to 50 µg/ml |
|
Correlation coefficient |
0.9989 |
|
Intercept |
0.0356 |
Discussion: Calibration curve was plotted and correlation coefficient was found to be 0.9989. So, there was a good correlation between absorbance and concentration.
Precision: Intraday and interday precision data was shown in Table:-3 and 4 respectively.
Table: 3 Intraday Precision data of Ranolazine
|
Concentration(µg/ml) |
Absorbance |
|
10 |
0.106 |
|
10 |
0.101 |
|
10 |
0.103 |
|
10 |
0.104 |
|
10 |
0.102 |
|
Mean |
0.104 |
|
Stdev |
0.00192 |
|
%RSD |
1.8 |
Table:-4 Interday Precision data of Ranolazine
|
Concentration(µg/ml) |
Intraday Absorbance DAY-1 |
Interday Absorbance DAY-2 |
|
10 |
0.106 |
0.083 |
|
10 |
0.101 |
0.083 |
|
10 |
0.103 |
0.08 |
|
10 |
0.104 |
0.081 |
|
10 |
0.102 |
0.082 |
|
Mean |
0.104 |
0.081 |
|
Stdev |
0.00192 |
0.001304 |
|
%RSD |
1.8 |
1.6 |
Discussion: The %RSD for intraday and interday precision was found to be <2>
Limit of detection and Limit of quantification:
LOD and LOQ was calculated and shown in Table:5.
Table: 5 LOD and LOQ data
|
Parameters |
Ranolazine(µg/ml) |
|
LOD |
0.83 µg/ml |
|
LOQ |
2.5 µg/ml |
Discussion: LOD and LOQ values for ranolazine was found to be 0.83µg/ml and 2.5µg/ml.
Accuracy: Recovery studies: Recovery studies were carried out by spiking the samples solution with standard solution 80%, 100%, and 120% for three replicates data was shown in Table:6.
Table: 6 Accuracy data of Ranolazine
|
Sample (% level) |
Amount Taken(µg/ml) |
Amount Added(µg/ml) |
Amount Recovered(µg/ml) |
% Recovery |
Average |
|
80 80 80 |
15 15 15 |
12 12 12 |
26.4 26.5 26.4 |
98.4% 98.8% 98.4% |
98.5 |
|
100 100 100 |
15 15 15 |
15 15 15 |
29.8 29.9 29.88 |
99.5% 99.8% 99.7% |
99.6 |
|
120 120 120 |
15 15 15 |
18 18 18 |
32.4 32.5 32.3 |
102% 102% 101% |
101.7 |
Discussion: The average % recovery of Ranolazine was found to be in between 98-103%.
Robustness: Robustness data was shown in Table:7.
Table: 7 Robustness data of ranolazine
|
S.NO. |
Wavelength |
Absorbance |
|
1 |
268 |
0.089 |
|
2 |
270 |
0.09 |
|
3 |
272 |
0.093 |
Discussion: There was no much variation in the absorbance with change in wavelength.
Assay:
Assay data of ranolazine was shown in Table:8.
Table: 8 Assay of ranolazine
|
Label claim |
Amount found |
Assay% |
|
500 mg |
499 mg |
99.8% |
Discussion: The % assay of Ranolazine was found to be 99.8%. It shows that UV- Spectroscopic method developed was successful in determining ranolazine from tablet dosage form.
CONCLUSION
From the above experimental results and parameters it was concluded that, this developed UV-Spectroscopy method for the estimation of Ranolazine was found to be simple , precise, accurate, robust, economic and rapid makes this method more acceptable and cost effective and it can be effectively applied for routine analysis of Ranolazine in bulk and commercial pharmaceutical formulations.
ACKNOWLEDGEMENT
We are thankful to CMR College of Pharmacy management and principal for providing facilities and equipment for carrying out the work.
REFERENCES

A. Raja Reddy*, Sabitha Sabu, T. Rama Rao, Analytical Method Development and Validation of Ranolazine in Bulk and Tablet Formulation By UV- Spectrophotometry, Int. J. of Pharm. Sci., 2024, Vol 2, Issue 11, 757-763. https://doi.org/10.5281/zenodo.14175770
 10.5281/zenodo.14175770