Department of Pharmacology, Acharya and BM Reddy College of Pharmacy, Bengaluru
The study aims to evaluate the antineoplastic activity of Apocynin-Hyaluronic acid (APO-HA) conjugate in-vitro on HBL-100, MCF-7 cell lines and in-vivo against Ehrlich Ascites Carcinoma (EAC) bearing Swiss albino mice. Cytotoxic effect of APO-HA conjugate was measured by MTT assay on HBL-100, MCF-7 cell lines. The therapeutic efficacy of APO-HA conjugate in-vivo was evaluated against EAC induced Swiss albino mice. 4 groups of 9 mice each were induced with EAC by injecting 1×10⁶ cells/ml/mouse intraperitoneally. Group-I served as cancer control (DMSO 4ml/kg), Group-II was treated with APO (65 mg/kg), Group-III was treated with APO-HA conjugate (65 mg/kg) and Group-IV was treated with 5-Flurouracil (20 mg/kg), serving as a standard. Treatment was conducted for 15 days. Blood was collected from the mice for hematological investigations post treatment. APO-HA conjugate showed cytotoxicity on HBL-100 and MCF-7 cell lines in dose dependent manner. APO-HA conjugate treated mice significantly maintained hematological parameters (Hb, RBC, WBC, packed cell volume) and also enhanced the life span of cancer induced mice. All the observations conclude that APO-HA conjugate has antineoplastic effect from its in-vitro evaluation and confirms that 65 mg/kg dose of APO-HA conjugate possess protective effect against EAC induced Swiss albino mice.
Cancers are a large family of diseases that involves abnormal cell growth with the potential to invade or spread to other parts of the body. they form a subset of neoplasms. A neoplasm or tumor is a group of cells that undergo unregulated growth and will form a mass or lump.[1] The growth of neoplasm exceeds, becomes uncoordinated with the normal tissues and persists in the same excessive manner after cessation of the stimuli which evoked the change.[2] The term ‘cancer’ is derived from the Latin word ‘crab’ because it adheres to any part in an obstinate manner like a crab. This results from a series of molecular events that alter the normal properties of cells.[3] Cancer is caused by a diversity of environmental and endogenous (reactive oxygen species and other free radicals) stimuli.[4] It is one of the leading causes of death worldwide after cardiovascular disease related deaths. World Health Organization reported 10.4 million (around 13 % of all deaths) cancer deaths in 2023 and was projected to increase by 18.6 million in 2050. Although scientific research has led to many new and effective treatments, some medicines have clear limitations.[5] Breast cancer is the commonly diagnosed malignant tumor in women and accounting for approximately 24 % of all female cancers worldwide.[6,7]
Current anticancer drugs present important drawbacks such as low specificity and high toxicity; this results in limitations in their efficacy. Attempts to create tumor-selective cytotoxic drugs focuses on understanding physiological and biochemical differences existing between malignant and healthy tissues.[8] Conjugation of cytotoxic drugs with macromolecules improves their pharmacokinetic profile, prolonging the distribution and elimination phases. Furthermore, the slow release of active drug from the carrier may result in sustained high intratumoral drug levels and lower plasma concentrations of the active drug.[9] In order to achieve this combined effect, a macromolecule-drug conjugate should preferentially release the active drug within the tumor tissue.[10]
Hyaluronic acid (HA) also known as hyaluronan is an anionic, non-sulfated glycosaminoglycan distributed widely throughout connective, epithelial and neural tissue; it is formed in the plasma membrane and has a large molecular size.[11] It is one of the chief components of the extracellular matrix; it contributes significantly to cell proliferation and migration.[12] It is an important component of articular cartilage, where it is present as a coat around each chondrocyte. When aggrecan monomers bind to HA in presence of HAPLN1 (Hyaluronanic acid and proteoglycan link protein 1), large and negatively charged aggregates form. These aggregates imbibe water and are responsible for the resilience of cartilage. The molecular weight of HA in cartilage decreases with age, but the amount increases.[13] HA is also a major component of skin, where it is involved in tissue repair. When the skin is exposed to excessive UVB rays, it becomes inflamed and the cells in the dermis stop producing enough HA.[14] HA also contributes to tissue hydrodynamics, movement and proliferation of cells. It participates in a number of cell surface receptor interactions notably those including its primary receptors CD44 and RHAMM. In some cancers, HA levels correlate well with malignancy and poor prognosis. HA is often used as a tumor marker for prostate and breast cancer; it may also be used to monitor the progression of the disease.[15] The HA receptors, CD44 and RHAMM, are most thoroughly studied in terms of their roles in cancer metastasis. Increased clinical CD44 expression has been positively correlated to metastasis in a number of tumor types.[16] In terms of mechanics, CD44 affects adhesion of cancer cells to each other and to endothelial cells, rearranges the cytoskeleton through the Rho GTPases and increases the activity of ECM degrading enzymes. Increased RHAMM expression has also been clinically correlated with cancer metastasis. RHAMM promotes cancer cell motility through a number of pathways including focal adhesion kinase (FAK), Map kinase (MAPK), pp60 (c-src). The downstream targets of Rho kinase (ROK), RHAMM can also cooperate with CD44 to promote angiogenesis toward the metastatic lesion.[17] In water, high molecular weight HA self-aggregates to form a viscous solution in which each molecule forms a sponge-like matrix with a radius of about 100 nm; this makes it a suitable candidate for passive tumor accumulation. HA plays an important physiological role in the tumorigenesis process, and consequently HA receptors are overexpressed on many types of tumor cells.[9] This feature could be exploited in drug delivery by using the receptor as an anchor to attach prodrugs or nanomedicine-based delivery systems through a ligand.[8] HA is closely related to angiogenesis in many types of tumors in which HA receptors, CD44 and RHAMM, are abundantly over expressed on the surface. Thus malignant cells with high metastatic activities often exhibit enhanced binding and uptake of HA.
HA and its derivatives have been popularly used as target-specific drug delivery vehicles for various therapeutic agents due to its affinity towards specific protein found on the surface of diseased cells.[9] Chemical modification and conjugation of HA have been achieved by utilizing its reactive functional groups such as carboxylic groups and hydroxyl groups. Small drug molecules can be linked to the polymer that allows controlled release of the free bioactive group. In general, coupling of antitumor agents to biopolymers provides advantages in drug solubilization, stabilization, localization, and controlled release.[10]
Apocynin (APO), also known as acetovanillone, is a natural organic compound structurally related to vanillin. APO is a methoxy-substituted catechol that is commonly used as an inhibitor of NADPH oxidase. ROS production is also inhibited due to APO's inhibition of NADPH oxidase.[18] APO is a prodrug that is converted by peroxidase-mediated oxidation to a dimer (diapocynin), which is more efficient than APO. APO showed potential antioxidant activities and suppressed the generation of reactive oxygen species that is implicated in lipopolysaccharide-induced acute lung injury. It showed inhibitory effects on pro-inflammatory cytokines and apoptosis pathway. APO has shown potential therapeutic effects in many diseases (diabetic nephropathy, cyclosporine induced nephrotoxicity, arteriosclerosis, and arthritis) by its NADPH oxidase inhibition.[19] The present study was conducted to evaluate the anti-cancer ability of APO-HA conjugate in vitro on HBL-100, MCF-7 cell lines and on EAC cells in mice.
MATERIALS AND METHODS:
Materials:
APO and HA was purchased from Sigma Aldrich and 5-Fluorouracil was purchased from Central Drug House, New Delhi. All other chemicals and reagents used were of analytical grade. HBL-100 cell line and MCF-7 cancer cell lines (National Centre for Cell Science, Pune, India) was used for the assays. EAC cancer cells were obtained from Manipal University, Udupi, Manipal, Karnataka 576104.
Methodology:
Apocynin-Hyaluronic acid micelles conjugates synthesis:
2 g of HA was dissolved in 200 ml of 1:1 v/v (H2O/DMSO) and subjected for sonication for 30 min. 50 ml of the above solution was taken into a 100 ml double necked round bottom flask. 200 mg of N,N’-Dicyclohexylcarbodiimide and 80 mg of 4-dimethylaminopyridine were added and kept on magnetic stirrer for one hour. This is done to activate the carboxylic group of HA so that conjugation with APO can take place. 150 mg of APO was dissolved in 25 ml of DMSO by adding slowly under nitrogen blanket. The mixture was stirred well at 60-65 ºC for about 6 h. The resultant solution was dialyzed against DMSO for 1 day and then against deionized water for 3 days using a dialysis membrane (MWCO: 3500 Da) to remove unbound entities. APO-HA conjugate was lyophilized and kept under refrigeration.
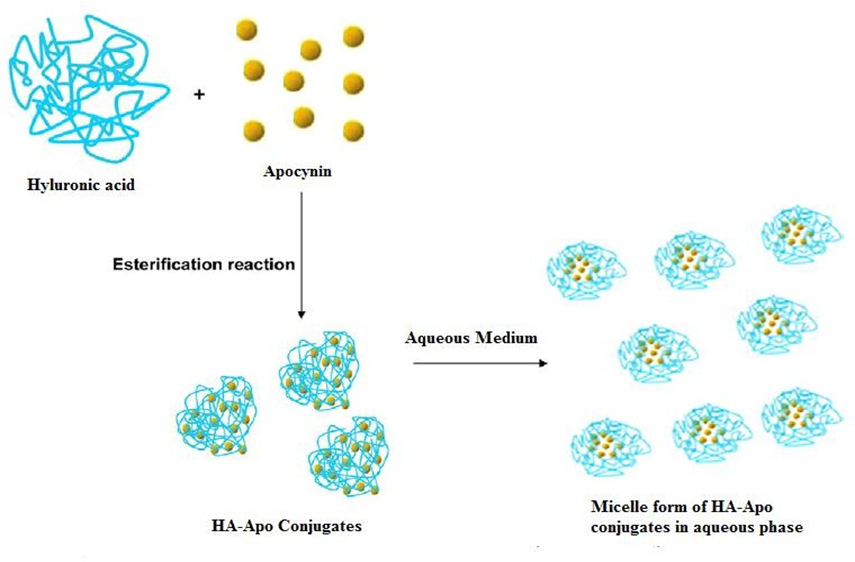
Figure 1: Synthesis of Apocynin-Hyaluronic acid micelles conjugates
In-vitro study:
MTT assay:
MTT [3-(4,5-Dimethylthiazol-2-yl)-2,5-diphenyl tetrazolium bromide] assay is a standard quantitative colorimetric assay for measuring mammalian cellular growth, cell survival and cell proliferation based on the ability of live cells. It can also be used to determine cytotoxicity of potential medicinal agents and other toxic materials. In this method, MTT (pale yellow) enters the cell and passes into the mitochondria of viable cell where mitochondrial dehydrogenase reduce MTT enzymatically to formazan crystals (dark blue) by cleaving the tetrazolium ring. The formazan crystals so formed are insoluble in aqueous solutions. The cells are then treated with an organic solvent, acid-isopropanol (0.04 N HCl in isopropanol), to dissolve the insoluble purple formazan product into a colored solution. The absorbance of this colored solution can be quantified by measuring at 490 to 600 nm wavelength using a multi-well scanning spectrophotometer (ELISA reader). Since reduction of MTT can only occur in metabolically active cells, the level of activity is a measure of the viability of the cells. 10 ml of the suspension cell culture was taken in 15 ml tubes and were centrifuged at 2500 rpm for 10 min. The supernatant was discarded and the cell pellet was resuspended in 1 ml growth medium.
The cell viability was checked by counting the number of viable cells in the above 1 ml suspension through hemocytometer and diluting the resuspended cells with growth medium to get required cell concentration. 1 × 10⁴ exponentially growing cells were seeded per well in 96 well plates. Cells were exposed to various concentrations of drugs. The plates were incubated at 37 °C in 5 % CO2 / 95 % humidified air. After 24 h of incubation, the plates were centrifuged at 2500 rpm for 10 min and the supernatant was discarded. 100 μl of growth medium and 10 μl of MTT was added (5 mg/ml) into each well of 96 well plates and plates were incubated at 37 °C in 5 % CO2 / 95 % humidified air for 4 h. The plates were centrifuged at 2500 rpm for 10 min and the supernatant was discarded. The precipitated formazan salt was dissolved to form a colored solution by adding 100 μl of acid-isopropanol (0.04 N HCl in isopropanol) into each well. The absorbance of this colored solution was measured at a wavelength of 492 nm using a multiwell scanning spectrophotometer (ELISA reader).[20-24]
% Cell viability = [Absorbance of cells (treated) / Absorbance of cells (untreated)] × 100
In-vivo study:
65 mg/kg dose was selected for screening anticancer activity against EAC bearing mice.[24] Stock solutions of 5 mg/ml of APO and APO-HA were prepared by dissolving 125 mg of each in 10 % DMSO followed by making up the volume to 25 ml with distilled water separately. Doses were fixed for each mice based on its body weight. The drug was given intraperitoneally daily for 15 days.
Ehrlich Ascites Carcinoma model:
0.1 ml of normal saline (0.9 %) was injected intraperitoneally into donor mouse. After injecting saline, immediately 1 ml of ascitic fluid was collected from peritoneal cavity and diluted with normal saline up to 10 ml. 10 µl ascites fluid from this was taken and placed on Neubauer’s chamber and the number of cells appeared on chamber were calculated and concentration of 1× 10⁶ cells were injected to each mice intraperitoneally.
Animal studies:
Healthy Swiss albino mice with body weight 25 ± 3 g were procured from Central Animal Facilities, Acharya & BM Reddy College of Pharmacy, Bengaluru. Animals were housed in polypropylene cages and maintained under standard conditions. They were fed with standard diet and water. The animals were maintained in accordance with CPCSEA (Committee for the Purpose of Control and Supervision of Experimental Animals) guidelines for the care and use of laboratory animals. The study protocol number (IAEC/ABMRCP/2016-2017/1) was approved by Institutional Animal Ethics Committee (IAEC), Acharya & BM Reddy College of Pharmacy, Bengaluru.
Grouping and dosing of animals:
Swiss albino mice were randomly divided into 4 groups of 9 mice each. All groups were induced with EAC. Group-I served as cancer control (DMSO 4 ml/kg), Group-II was treated with APO (65 mg/kg), Group-III was treated with APO-HA conjugate (65 mg/kg) and Group-IV was treated with 5- Flurouracil (20 mg/kg). The treatment protocol is given below.[24-26]
Table 1: Animal grouping for Ehrlich Ascites Carcinoma study
|
Group |
Treatment |
Dose |
|
I |
Cancer control |
10 % DMSO 4 ml/kg |
|
II |
APO |
65 mg/kg |
|
III |
APO-HA conjugate |
65 mg/kg |
|
IV |
5-FU |
20 mg/kg |
Evaluation parameters:
Determination of hematological parameters:
In order to know the effect of APO-HA conjugate on hematological status of EAC cells mice, a comparison between Group-I (control), Group-II (APO) Group-III (APO-HA) and Group-IV (5-FU) was done. Blood was drawn from each mice by retro-orbital plexus method. 12 µl of blood was collected in EDTA tube by puncturing retro-orbital sinus of mice for the hematological studies. The EDTA tubes containing blood samples were tested using Animal Blood Counter (Vet ABC- HORIBA) for RBC count, WBC count, packed cell volume and haemoglobin (Hb) content.[27,28]
Measurement of mean survival time and percentage increase in life span:
The effect of 65 mg APO and 65 mg APO-HA and 20 mg/kg 5-FU on tumor growth was monitored by recording the mortality rate daily until all the animals were dead. The mean survival time and % increase in life span (ILS) were calculated.[28]
% ILS = [MST of treated group / MST of control group -1] × 100
Body weight analysis:
All the mice were weighed weekly after tumor cell inoculation and the average increase in the body weight of carcinoma induced mice was measured. Percentage decrease in the body weight was determined by using the following formula:
Percentage decrease in the body weight = (Gc – Gt) / Gc ×100,
where Gc = gain in the body weight of control group; Gt = gain in the body weight of treated group
Expression of apoptotic genes29:
Isolation of genomic DNA from mouse ascites:
DNA Estimation using NanoDrop:
1 µl of sterile Milli Q water was used to initialize the instrument. Once the instrument has been initialized, 1 µl of sterile filtered tris-EDTA buffer was used as blank and the subsequent reactions were performed. The results obtained were collated below:
Sample G1:
From the NanoDrop, the yield of genomic DNA isolated was 805.5 ng / µl. 1 µl of this genomic DNA was diluted using 10 µl of sterile filtered tris-EDTA buffer to give a concentration of 805.5 ng / 10 µl. From this stock, 5 µl was used to set up a PCR reaction.
A PCR reaction for the sample G1 was set up as follows:
Table 2: Sample G1 for PCR
|
Component |
Concentration (µl) |
|
PCR Buffer with MgCl2 |
4 |
|
10 mM dNTPs |
1 |
|
10 mM forward Primer |
1 |
|
10 mM Reverse Primer |
1 |
|
Genomic DNA |
5 |
|
Taq DNA Polymerase |
0.5 |
|
Water |
12.5 |
Sample G2:
The concentration from the NanoDrop for the sample G2 was 46.6 ng / µl. This sample was not diluted as the yield was low and used directly for PCR reactions. PCR reaction for the sample G2 was set up as follows:
Table 3: Sample G2 for PCR
|
Component |
Concentration (µl) |
|
PCR Buffer with MgCl2 |
4 |
|
10 mM dNTPs |
1 |
|
10 mM forward Primer |
1 |
|
10 mM Reverse Primer |
1 |
|
Genomic DNA |
10 |
|
Taq DNA Polymerase |
0.5 |
|
Water |
7.5 |
Sample G3:
The concentration from the NanoDrop for the sample G3 was 908.7 ng / µl. This sample was diluted to 10 µl using filtered sterile tris-EDTA buffer to give a final concentration of 908.7 ng / 10 µl. From this stock, 5 µl amounting to 454.35 ng was taken to set up a PCR reaction as follows:
Table 4: Sample G3 for PCR
|
Component |
Concentration (µl) |
|
PCR Buffer with MgCl2 |
4 |
|
10 mM dNTPs |
1 |
|
10 mM forward Primer |
1 |
|
10 mM Reverse Primer |
1 |
|
Genomic DNA |
5 |
|
Taq DNA Polymerase |
0.5 |
|
Water |
12.5 |
The PCR cycle is as follows:
A negative control without any template was used as control to check for any contamination. After PCR reaction was completed, the PCR tubes containing samples were transferred to a ice bucket and from the total volume, 15 µl of each of the sample was loaded onto an 1.2 % agarose electrophoresis gel.
RESULTS:
Standardisation of Apocynin-Hyaluronic acid conjugate:
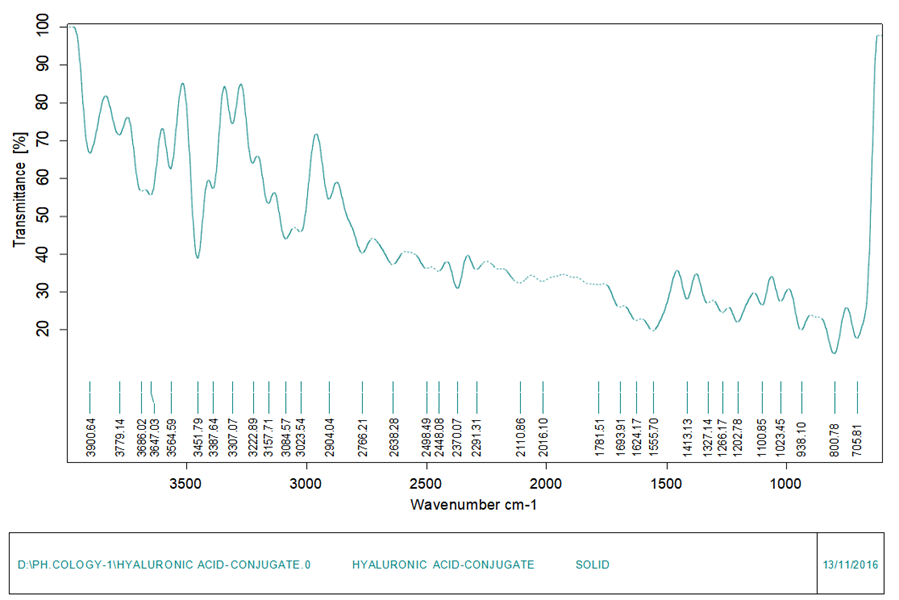
Figure 2: FTIR of Apocynin-Hyaluronic acid conjugate
Table 5: Functional groups vibration range of Apocynin-Hyaluronic acid conjugate
|
Sl. No |
Wave number (Cm-1) |
Functional group |
|
1 |
3451 |
O-H st |
|
2 |
3023 |
Ar C-H st |
|
3 |
2904 |
Ali C-H st |
|
4 |
1693 |
C=O st |
|
5 |
1556 |
C=C st |
|
6 |
1413 |
C-O st |
|
7 |
938 |
C-H b |
|
8 |
800 |
C-H b |
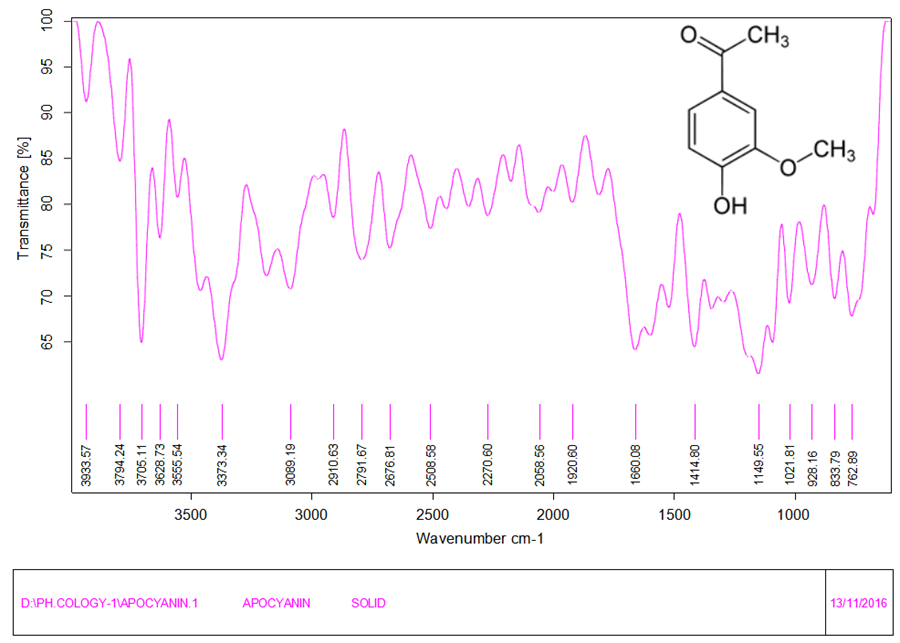
Figure 3: FTIR of Apocynin
Table 6: Functional groups vibration range of Apocynin
|
Sl. No |
Wave number (cm-1) |
Functional group |
|
1 |
3373 |
O-H st |
|
2 |
3089 |
Ar C-H st |
|
3 |
2791 |
Ali C-H st |
|
4 |
1660 |
C=O st |
|
5 |
1414 |
C-O st |
|
6 |
928 |
C-H b |
|
7 |
762 |
C-H b |
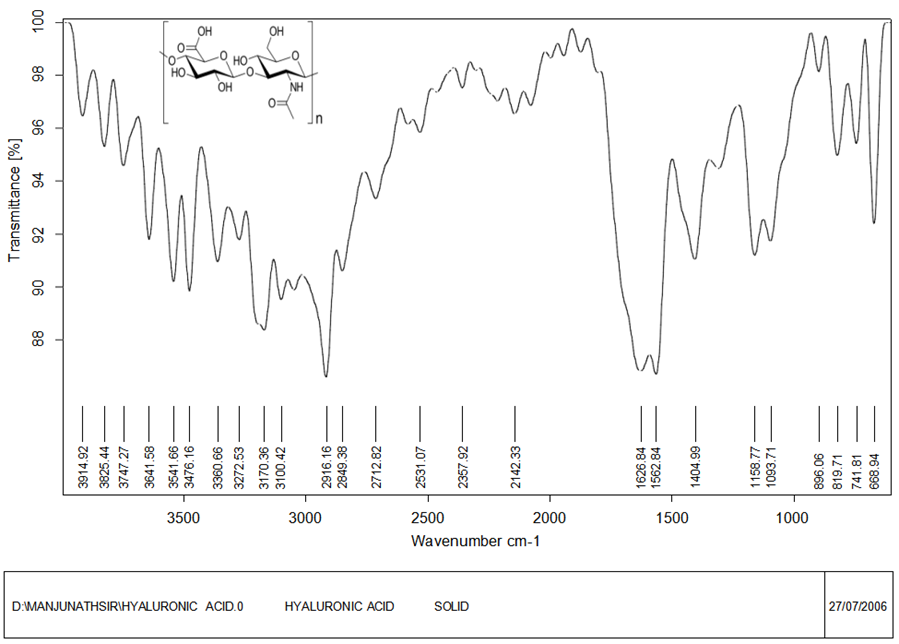
Figure 4: FTIR of of Hyaluronic acid
Table 7: Functional groups vibration range of Hyaluronic acid
|
Sl. No |
Wave number (Cm-1) |
Functional group |
|
1 |
3541 |
N-H st (Asymmetric st) |
|
2 |
3476 |
N-H st (Symmetric st.) |
|
3 |
3360 |
O-H st |
|
4 |
2916 |
C-H st |
|
5 |
1626 |
C=O st |
|
6 |
1404 |
C-O st |
|
7 |
1093 |
C-O st |
|
8 |
896 |
C-H b |
|
9 |
668 |
C-H b |
MTT assay:
Cell viability of MCF-7 cell line:
The effect of APO-HA conjugate on percentage cell viability on MCF-7 cell lines is given in Table 8 and Figures 5 and 6. The results showed that APO-HA conjugate demonstrated extremely significant reduction in the percentage cell viability on MCF-7 cell lines (IC50 30.74 at 250 µM) in a dose dependent manner.
Table 8: Effect of Apocynin-Hyaluronic acid conjugate on percentage cell viability of MCF-7 cell line
|
Concentration (µM) |
% cell viability of Apocynin-Hyaluronic acid conjugate |
|
Blank |
100 ± 0.00 |
|
3.906 |
67.21 ± 0.58 |
|
7.812 |
54.44 ± 1.70 |
|
15.625 |
44.76 ± 0.67 |
|
31.25 |
44.07 ± 1.28 |
|
62.5 |
37.74 ± 2.91 |
|
125 |
34.10 ± 1.64 |
|
250 |
31.95 ± 2.21 |
|
500 |
24.43 ± 1.11 |
|
1000 |
21.61 ± 0.98 |
|
IC50= 30.74 at 250 µM |
|
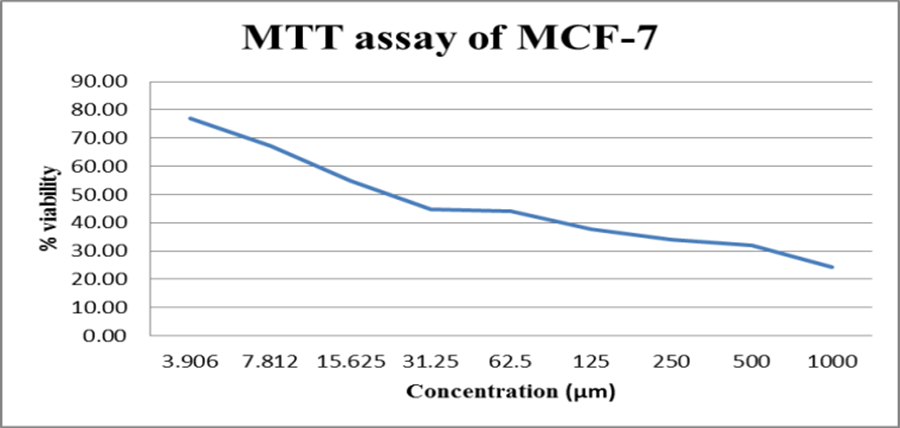
Figure 5: Effect of Apocynin-Hyaluronic acid conjugate on percentage cell viability of MCF-7 cell line
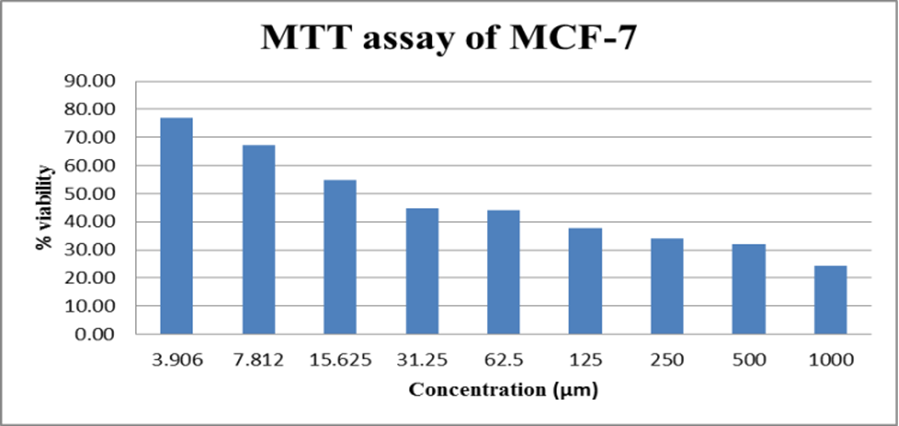
Figure 6: Effect of Apocynin-Hyaluronic acid conjugate on percentage cell viability of MCF-7 cell line
Cell viability of HBL-100 cell line:
The effect of APO-HA conjugate on percentage cell viability on HBL-100 cell line is given in Table 9 and Figures 7 and 8. The results showed that APO-HA conjugate produced an extremely significant reduction in the percentage cell viability on HBL-100 cell line (IC50 94.01 at 7.812 µM) in a dose dependent manner.
Table 9: Effect of Apocynin-Hyaluronic acid conjugate on percentage cell viability of HBL-100 cell line
|
Concentration (µM) |
% cell viability of Apocynin-Hyaluronic acid conjugate |
|
Blank |
100 ± 0.00 |
|
3.906 |
98.01 ± 1.36 |
|
7.812 |
93.32 ± 1.11 |
|
15.625 |
88.61 ± 0.83 |
|
31.25 |
83.32 ± 1.11 |
|
62.5 |
81.21 ± 1.00 |
|
125 |
79.66 ± 0.69 |
|
250 |
66.10 ± 1.06 |
|
500 |
56.92 ± 1.31 |
|
1000 |
44.69 ± 0.55 |
|
IC50 = 94.01at 7.812 µM |
|
n=3 and values were expressed as Mean ± SD
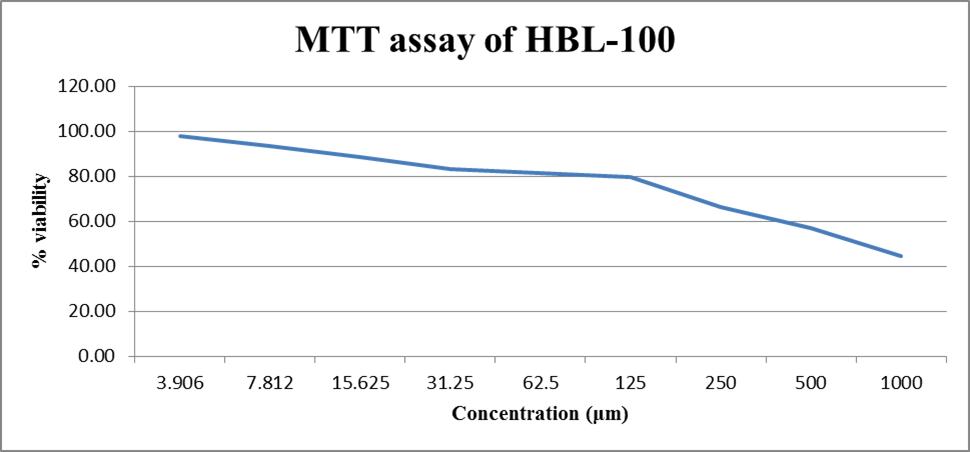
Figure 7: Effect of Apocynin-Hyaluronic acid conjugate on percentage cell viability of HBL-100 cell line
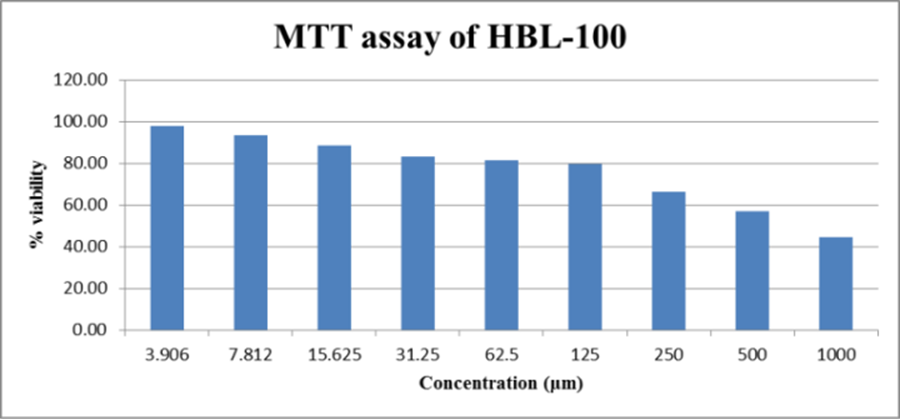
Figure 8: Effect of Apocynin-Hyaluronic acid conjugate on percentage cell viability of HBL-100 cell line
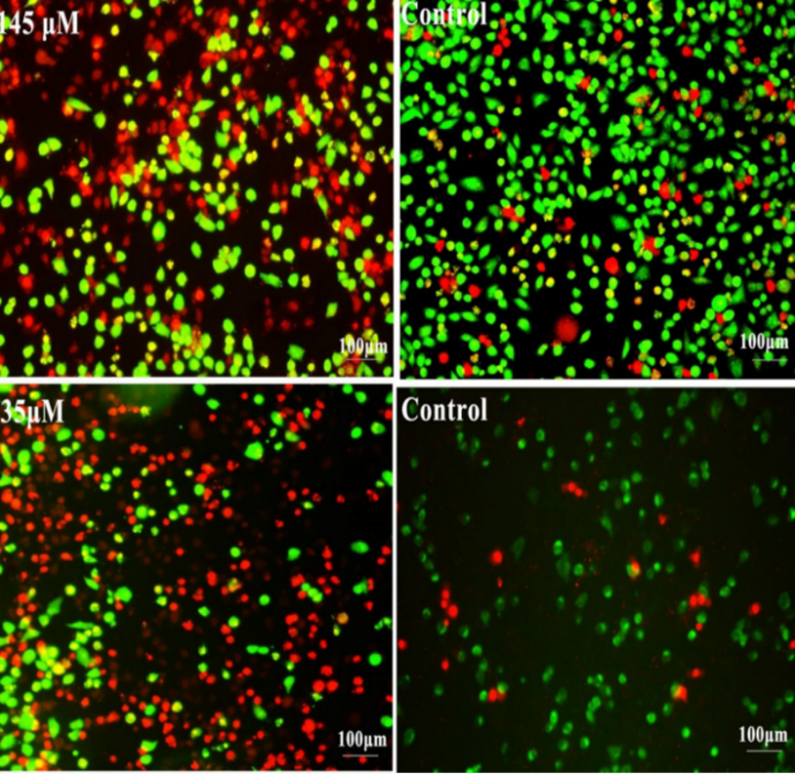
Figure 9: Dual staining effect of Apocynin-Hyaluronic acid conjugate on percentage cell viability of MCF-7 cell line
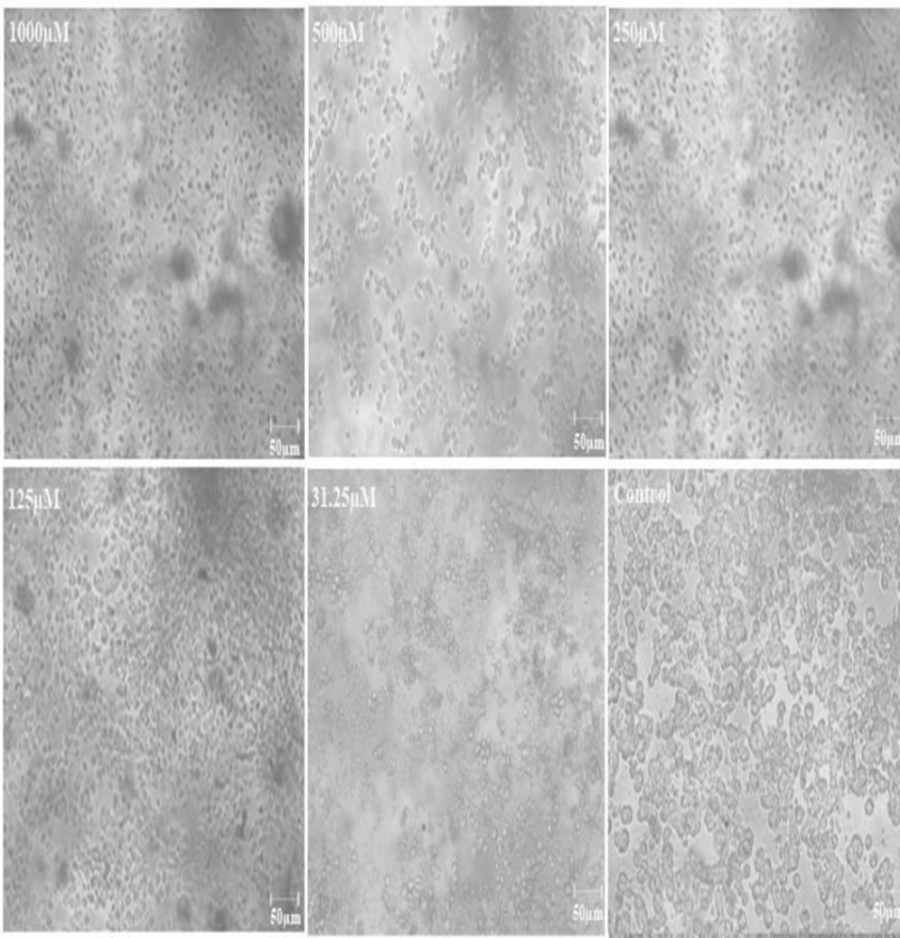
Figure 10: Cytotoxicity effect of Apocynin-Hyaluronic acid conjugate on MCF-7 cell line
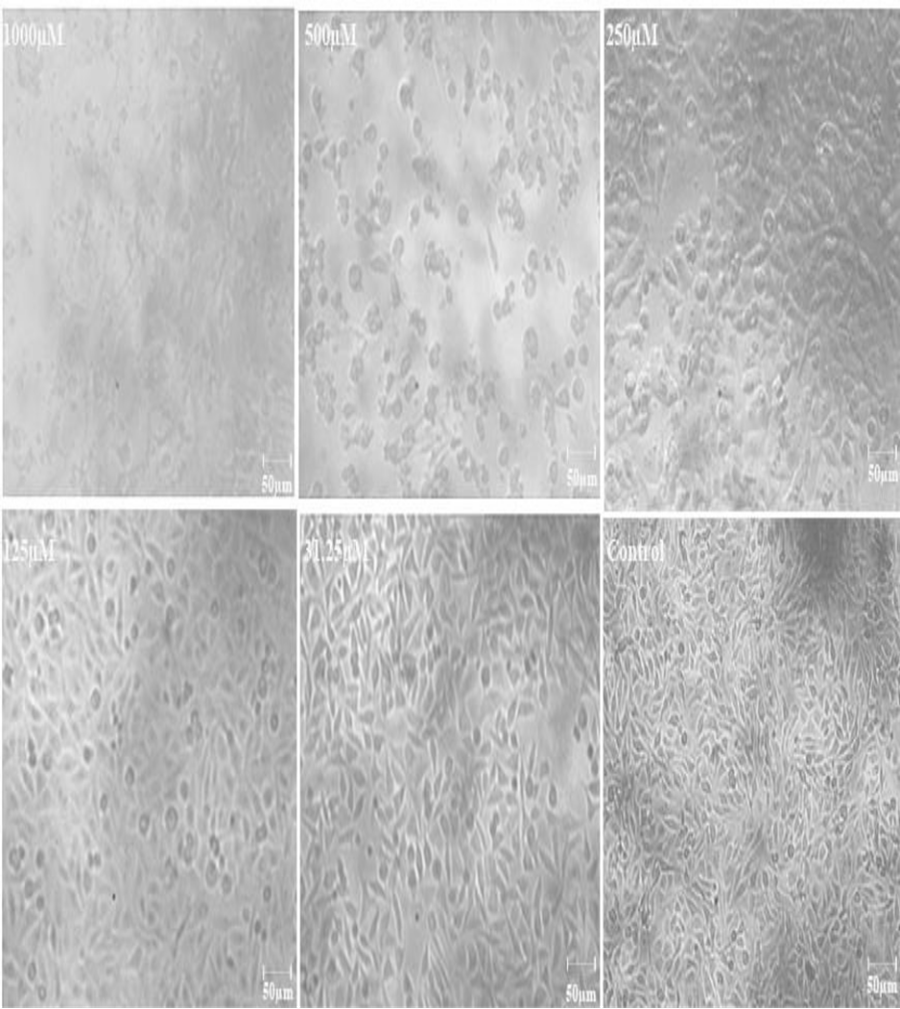
Figure 11: Cytotoxicity effect of Apocynin-Hyaluronic acid conjugate on HBL-100 cell line
Expression of apoptotic genes:
DNA Estimation using NanoDrop:
The effect of APO-HA conjugate on expression of apoptotic gene TNF-α is given in Table 10 and Figure 12. 1 µl of sterile Milli Q water was used to initialize the instrument. Once the instrument has been initialized, 1 µl of sterile filtered Tris-EDTA buffer was used as blank and subsequent reactions were performed. The results obtained were collated below:
Table 10: Effect of Apocynin-Hyaluronic acid conjugate on expression of appoptic gene TNF-α
|
Sample |
260/280 ratio |
260/230 ratio |
Yield (ng/ul) |
|
DMSO control |
2.09 |
1.7 |
805.5 |
|
APO (65 mg/kg) |
2.03 |
1.80 |
46.6 |
|
APO-HA (65 mg/kg) |
2.06 |
1.67 |
908.7 |
In lane 2, where a negative control was loaded, nothing can be seen. Where as in the lane 3, 4 and 5, where samples DMSO control, APO and APO-HA conjugate are loaded, faint amplification can be seen. lane 5 of G3 (APO-HA conjugate)
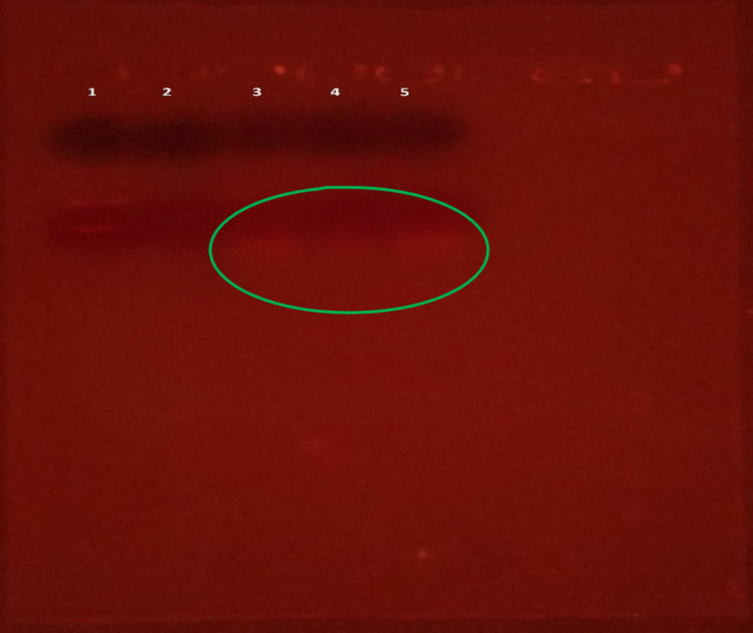
Figure 12: Effect of Apocynin-Hyaluronic acid on expression of appoptic gene TNF-α
Gel loading Pattern
Effect of Apocynin-Hyaluronic acid conjugate on hematological parameters:
Effect of Apocynin-Hyaluronic acid conjugate on hemoglobin:
The effect of APO, APO-HA conjugate and 5-FU on hemoglobin in EAC induced mice are given in Table 11 and Figure 13. The result shown decrease in Hb level in the cancer control, i.e 8.76 ± 0.17 gm/dL. The Hb of normal group was 14.30 ± 0.63 gm/dL. The APO-HA conjugate contributed to increase the Hb level towards normal. With the dose of 65 mg/kg, it has raised Hb to 41.09 %, i.e 12.36 ± 0.28 gm/dL P < 0.001. With 5-FU, the level of Hb was found to be increased by 38.12 % significantly (12.1 ± 0.11 gm/dL) (P < 0.001).
Table 11: Effect of Apocynin-Hyaluronic acid conjugate on hemoglobin
|
Compounds |
Hb (g/dl) |
|
Control 10% DMSO (4ml/kg) |
8.76 ± 0.17 |
|
APO (65mg/kg) |
10.36 ± 0.28* |
|
APO-HA (65mg/kg) |
12.36 ± 0.28*** |
n=3 and values were expressed as Mean ± SEM. Data analyzed by one-way ANOVA followed Dunnett’s t-test for multiple comparisons. P < 0.05 (*), P < 0.01 (**), P< 0.001(***) were taken as significant. SEM = Standard Error Mean.
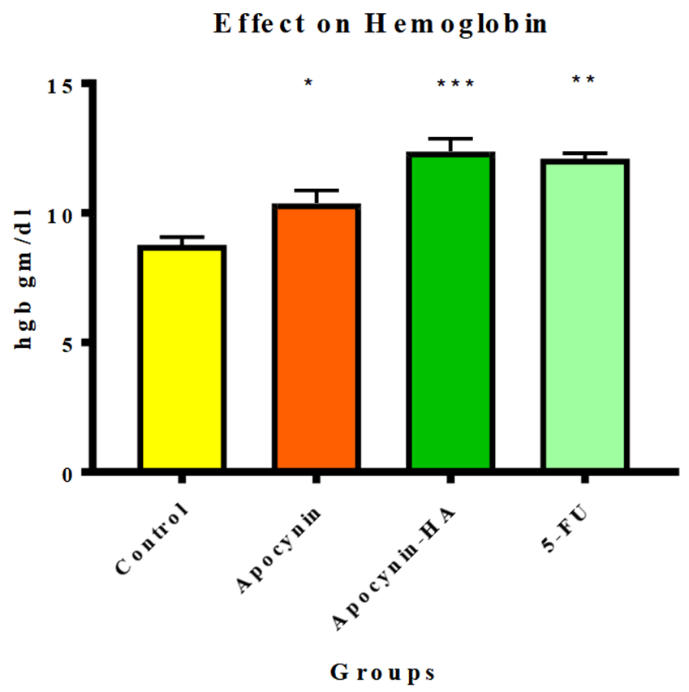
Figure 13: Effect of Apocynin-Hyaluronic acid conjugate on hemoglobin
n=3 and values were expressed as Mean ± SEM. Data analyzed by one-way ANOVA followed Dunnett’s t-test for multiple comparisons. P < 0.05 (*), P < 0.01 (**), P< 0.001(***), were taken as significant. SEM = Standard Error Mean
Effect of Apocynin-Hyaluronic acid conjugate on red blood cells:
The effect of APO, APO-HA conjugate and standard 5-FU on red blood cells in EAC bearing mice are given in Table 12 and Figure 14. Treatment with APO-HA conjugate (65 mg/kg) showed an extremely significant (P < 0.001) increase (48.35 %) of RBC count compared to EAC control group, while less significant (P < 0.01) increase (35.52 %) of RBC count on administration of 5-FU (20 mg/kg).
Table 12: Effect of Apocynin-Hyaluronic acid conjugate on red blood cells
|
Compounds |
RBC 1×10⁶ /mm3 |
|
Control 10 % DMSO (4 ml/kg) |
7.01 ± 0.42 |
|
APO (65 mg/kg) |
9.33 ± 0.26** |
|
APO-HA (65 mg/kg) |
10.4 ± 0.05*** |
n=3 and values were expressed as Mean ± SEM. Data analyzed by one-way ANOVA followed Dunnett’s t-test for multiple comparisons. P < 0.01 (**), P< 0.001(***) were taken as significant. SEM = Standard Error Mean.
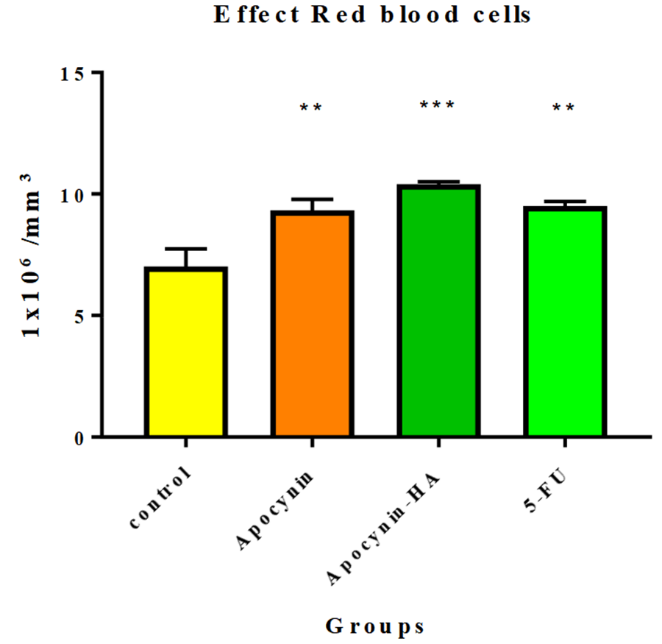
Figure 14: Effect of Apocynin-Hyaluronic acid conjugate on red blood cells
n=3 and values were expressed as Mean ± SEM. Data analyzed by one-way ANOVA followed Dunnett’s t-test for multiple comparisons. P < 0.01 (**), P< 0.001(***) were taken as significant. SEM = Standard Error Mean.
Effect of Apocynin-Hyaluronic acid conjugate on white blood cells:
The effect of APO, APO-HA conjugate and standard 5-FU on white blood cells in EAC induced mice are given in Table 13 and Figure 15. The result shown that the level of WBC was increased in EAC control mice (25.23 ± 1.19 × 10³ / ul) when compared to the normal mice (5.76 ± 1.85 × 10³ / ul). On treatment with APO-HA conjugate of (65 mg/kg) showed an extremely significant (P < 0.001) decrease (50.88 %.) of WBC count compared to EAC control group ,while less significant (P < 0.01) decrease (40.87 %,) of WBC count on administration of 5-FU (20 mg/kg).
Table 13: Effect of Apocynin-Hyaluronic acid conjugate on white blood cells
|
Compounds |
WBC 1 × 10³ /mm3 |
|
Control 10 % DMSO (4 ml/kg) |
25.23 ± 1.19 |
|
Apocynin (65 mg/kg) |
17.5 ± 0.34** |
|
Apocynin-HA (65 mg/kg) |
12.6 ± 0.05*** |
n=3 and values were expressed as Mean ± SEM, Data analyzed by one-way ANOVA followed Dunnett’s t-test for multiple comparisons. P < 0.01 (**), P< 0.001(***) were taken as significant. SEM = Standard Error Mean.
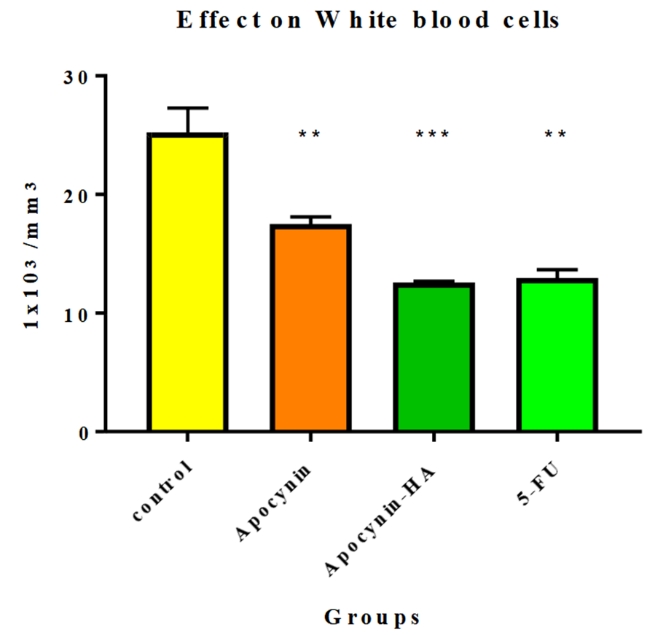
Figure 15: Effect of Apocynin-Hyaluronic acid conjugate on white blood cells
n=3 and values were expressed as Mean ± SEM. Data analyzed by one-way ANOVA followed Dunnett’s t-test for multiple comparisons. P < 0.01 (**), P< 0.001(***) , were taken as significant. SEM = Standard Error Mean
Effect on differential leukocytes count:
The effect of APO, APO-HA conjugate and standard 5-FU on % DLC in EAC induced mice given in Table 14 and Figure 16
Table 14: Effect of Apocynin-Hyaluronic acid conjugate on differential leukocytes count
|
Compounds |
Differential count % |
||
|
Lymphocytes |
Neutrophils |
Monocytes |
|
|
Control 10 % DMSO (4 ml/kg) |
14.9 ± 7.45 |
63.60 ± 4.49 |
14.20 ± 3.30 |
|
APO (65 mg/kg) |
28.8 ± 1.13 |
55.40 ± 1.90 |
15.80 ± 0.81 |
|
APO-HA (65 mg/kg) |
21.33 ± 1.34 |
57.87 ± 1.73 |
20.80 ± 0.49 |
|
5-FU (20 mg/kg) |
77.07 ± 5.24 |
21.00 ± 4.98 |
1.93 ± 0.27 |
n=3 and values were expressed as Mean ± SEM
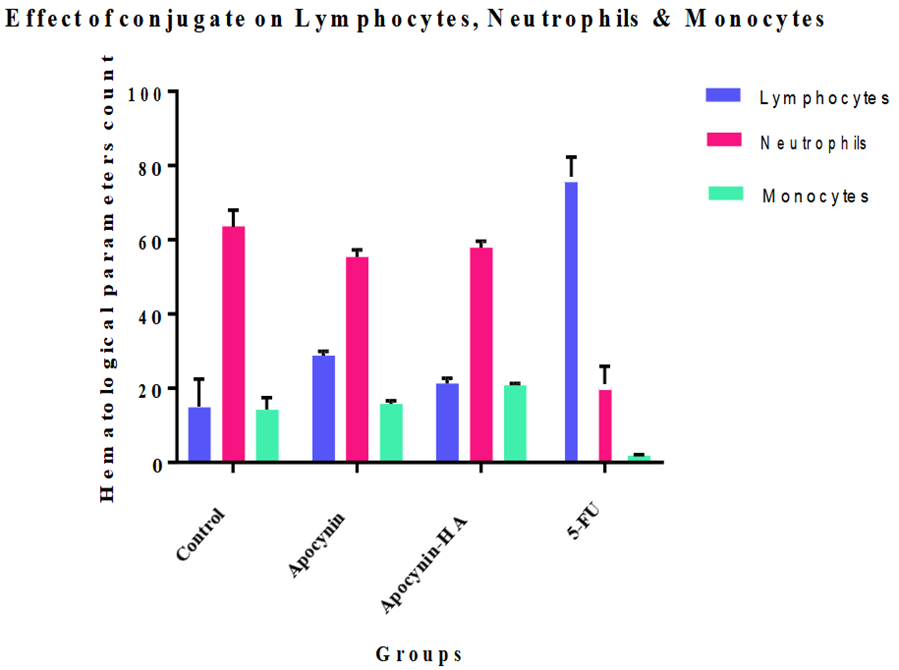
Figure 16: Effect of Apocynin-Hyaluronic acid conjugate on differential leukocytes count
Effect of Apocynin-Hyaluronic acid conjugate on mean survival time and percentage increase in life span:
The effect of APO, APO-HA conjugate and standard 5-FU on MST and % ILS in EAC bearing mice are given in Table 15 and Figure 15. The result showed that the MST was 14.44 ± 2.24 days in EAC control mice. Whereas, it was significantly increased when compared with cancer control mice after 15 days when treated with 65 mg/kg of APO-HA acid conjugate by 100.06 % (28.89 ±7.13 days) (P < 0.001) and increased by 46.32 % (21.13 ± 4.18 days) with a dose of 65 mg/kg of APO (P < 0.1). Therefore, treatment with 65 mg / kg APO-HA conjugate and 65 mg/kg of APO increased the life span of EAC bearing mice by 100.06 % 46.32 % respectively. Whereas, treatment with the standard drug, 5-FU, increased the life span by 61.55 % and increased the MST significantly by 23.33 ± 1.58 days (P < 0.01).
Table 15: Effect of Apocynin-Hyaluronic acid conjugate on mean survival time on percentage increase in life span
|
Groups |
MST (Days) |
% ILS (%) |
|
Control 10 % DMSO (4 ml/kg) |
14.44 ± 2.24 |
--- |
|
APO (65 mg/kg) |
21.13 ± 4.18* |
46.32 |
|
APO-HA (65 mg/kg) |
28.89 ± 7.13*** |
100.06 |
|
5-FU (20 mg/kg) |
23.33 ± 1.58** |
61.55 |
n=3 and values were expressed as Mean ± SD. Data analyzed by one-way ANOVA followed Dunnett’s t-test for multiple comparisons. P < 0.05 (*), P < 0.01 (**), P< 0.001 (***) were taken as significant. SD = Standard deviation
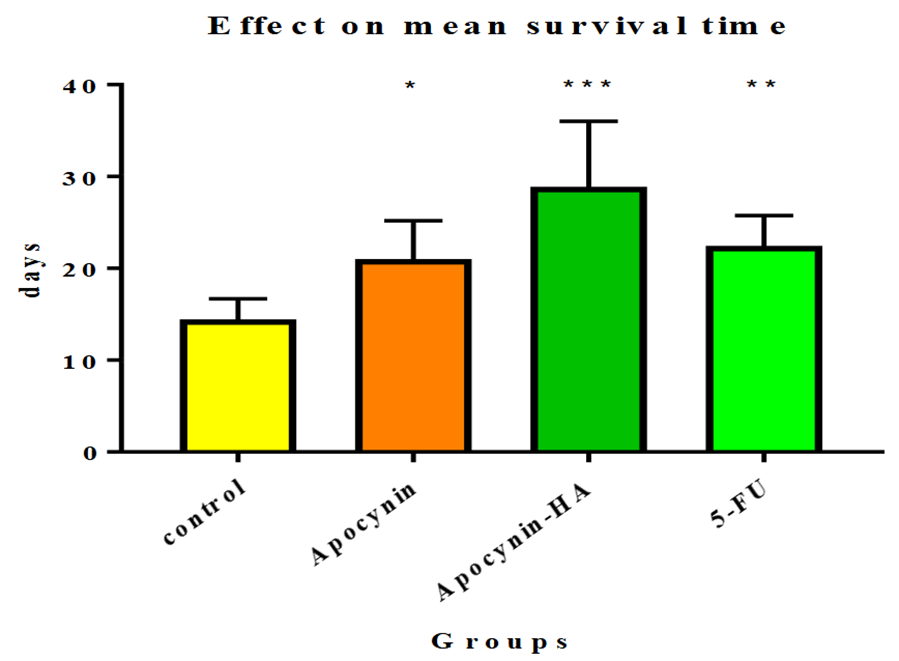
Figure 17: Effect of Apocynin-Hyaluronic acid conjugate on mean survival time and percentage increase in life span
n=3 and values were expressed as Mean ± SD. Data analyzed by one-way ANOVA followed Dunnett’s t-test for multiple comparisons. P < 0.05 (*), P < 0.01 (**), P< 0.001(***), were taken as significant. SD = Standard deviation.
Percentage decrease in the body weight:
The effect of APO, APO-HA conjugate and standard 5-FU on body weight in EAC induced mice are given in Tables 16 and 17.
Table 16: EAC induced mice weekly body weight
|
Groups |
Gain in body weight (Mean ± SEM) (mg) |
% Decrease in body weight (%) |
|
Control 10 % DMSO (4 ml/kg) |
20.6 ± 1.38 |
---- |
|
APO (65 mg/kg) |
16.3 ± 1.41** |
20.873 |
|
APO-HA (65 mg/kg) |
13.32 ± 0.82*** |
35.436 |
|
5-FU (20 mg/kg) |
18.59 ± 0.85* |
10.194 |
n=3 and values were expressed as Mean ± SEM. Data analyzed by one-way ANOVA followed Dunnett’s t-test for multiple comparisons. P < 0.05 (*), P < 0.01 (**), P< 0.001(***) were taken as significant. SEM = Standard Error Mean.
Table 17: Effect of Apocynin-Hyaluronic acid conjugate on body weight
|
Animal |
Body weight Group-I |
Body weight Group-II |
Body weight Group-III |
Body weight Group-IV |
||||||||||||
|
Inital |
After1 week |
After2 weeks |
After3 weeks |
Initial |
After 1 week |
Aft er 2 weeks |
Aft er 3 wee ks |
Initial |
Aft er 1 week |
Aft er 2 weeks |
Aft er 3 wee ks |
Initial |
After 1 week |
After 2 weeks |
Aft er 3 weeks |
|
|
1 |
25.4 |
33.3 |
47.2 |
D |
21.6 |
25.5 |
29.4 |
33.4 |
23.2 |
31.6 |
40.1 |
43.2 |
22.2 |
29.6 |
42.1 |
45.2 |
|
2 |
26.7 |
30.1 |
39.4 |
D |
30.7 |
39.7 |
44.2 |
46.3 |
24.5 |
30.3 |
32.7 |
37.5 |
26.5 |
32.3 |
38.7 |
41.5 |
|
3 |
26.9 |
35.8 |
48.3 |
D |
22.4 |
27.9 |
35.1 |
37.7 |
21.7 |
21.7 |
21.7 |
D |
23.7 |
29.7 |
36.7 |
39.4 |
|
4 |
30.2 |
42.7 |
51.1 |
D |
27.5 |
28.8 |
33.4 |
39.5 |
25.6 |
32.2 |
36.1 |
37.4 |
24.6 |
35.2 |
44.1 |
46.4 |
|
5 |
33.9 |
42.5 |
48.9 |
D |
26.2 |
38.2 |
42.3 |
45.1 |
22.7 |
30.1 |
34.8 |
40.2 |
25.7 |
33.1 |
40.8 |
44.2 |
|
6 |
31.5 |
38.2 |
52.5 |
D |
27.4 |
37.4 |
41.1 |
44.3 |
26.4 |
29.1 |
30.3 |
37.8 |
23.4 |
28.1 |
39.3 |
45.8 |
|
7 |
28.9 |
37.5 |
53.1 |
D |
26.2 |
33.7 |
37.8 |
41.2 |
23.3 |
27.4 |
33.7 |
37.9 |
26.3 |
29.4 |
41.7 |
43.9 |
|
8 |
25.1 |
30.1 |
46.2 |
D |
26.4 |
35.7 |
37.8 |
43.2 |
22.1 |
26.2 |
32.3 |
42.1 |
27.1 |
28.2 |
38.3 |
42.1 |
|
9 |
31.5 |
43.1 |
49.8 |
D |
23.6 |
34.7 |
39.8 |
45.1 |
24.4 |
29.1 |
32.8 |
37.8 |
28.4 |
31.1 |
36.8 |
39.8 |
D=Death
DISCUSSION:
The present study was carried out to evaluate the antitumor effect of APO-HA conjugate. Presence of tumor in the human body or in the experimental animals is known to affect many functions, altered hematological parameters and downfall of life span.30,31
Cultured mammalian cells provide an important tool for evaluating the cytotoxicity. Cytotoxicity potential on tumor cell lines is required to identify bioactive molecules. In the present work, we investigated the cytotoxic effects of the APO-HA on HBL-100 and MCF7 cell lines. The cytotoxic effect of APO-HA conjugate was measured using MTT assay. Evaluation of the effects of the APO-HA conjugate on the viability of HBL-100 and MCF-7 cell lines was performed after 48 h in a dose dependent manner.32
The generation of free radicals in-vivo is a constant phenomenon either due to physiological metabolism or pathological alterations. These generated free radicals can be the main cause of cancer. In the resting state, the balance between antioxidants and oxidants is sufficient to prevent the disruption of normal physiologic functions; however, either increase or decrease in antioxidants can disrupt this balance giving rise to elevated levels of reactive oxygen species. Cells have developed enzymatic systems like SOD, catalase and glutathione which convert oxidants into non-toxic molecules, thus protecting the organism from the deleterious effects of oxidative stress. Glutathione is a principal tripeptide thiol involved in the antioxidant cellular defence. Glutathione neutralizes free radical before they cause damage to the cells and involve in regulating the genes of cell proliferation, differentiation and apoptosis. A higher level of glutathione is important for normal cellular functions, signal transduction and protection against certain carcinogens. On the other hand, when intracellular glutathione levels are low, the cells are more vulnerable to reactive oxygen species attacks which activate different intracellular oncogenic pathways or mutate a tumor suppressor gene pathway, which will activate a tumorigenesis process.33
The reliable criterion for judging the value of any anticancer drug is the prolongation of lifespan of the animal and maintenance of blood parameters. Ascites fluid is the direct nutritional source for tumor cells and a rapid increase in ascites fluid with tumor growth would be a means to meet the nutritional requirement of tumor cells.34 The APO-HA conjugate decreased the ascites fluid volume and increased the percentage of life span and mean survival time. The anemia encountered in tumor bearing mice is mainly due to the reduction in RBC and Hb percentage, and this may occur either due to iron deficiency and haemolytic anemia. As RBCs die out, which they do naturally every 120 days or so, the body isn't able to replace them, and the RBC count drops. Lymphoma affects the blood and bone marrow, damages the production of RBCs and thereby causes haemolytic anaemia. A hormone called erythropoietin tells the body when to make more RBCs but cancers affect the bone marrow directly.
Cancers that have spread to the bone or bone marrow lowers the production of erythropoietin contributing anaemia. Packed cell volume and Hb also falls as RBC count drops.35 After repeated treatment, APO-HA conjugate reverses the changes in hematological parameters near to normal levels. This indicates that APO-HA conjugate shows protective action on the hemopoietic system. Thus APO-HA conjugate succeeded to exhibit significant anticancer activity in Ehrlich EAC bearing mice.
CONCLUSION
In the current study, APO has been selected apart from a variety of anticancer drugs, to be the prospective entity for cancer therapy due to its antioxidant property.
The present study concluded that the APO-HA conjugate exhibited anticancer potential. MTT assay showed decrease in cell viability of on HBL-100 and MCF-7 cell lines in a dose dependent manner. In-vivo studies showed that 65 mg/kg dose of APO-HA conjugate showed significant activity when compared with the 65 mg/kg dose of APO and standard. A significant improvement of MST and % ILS were observed in the tumor induced animals when treated with APO-HA conjugate. Hematological parameters of tumor bearing mice showed significant changes when compared with normal control. APO-HA treatment changed the altered parameters of hemopoietic system to normal levels in cancer bearing mice. The possible mechanism of anticancer activity may be due to its antioxidant effect. APO-HA conjugate showed to have antioxidant properties. All these data confirmed that the APO-HA conjugate can be used as a potential agent in the area of cancer chemotherapy. Hence, it can be concluded that the APO-HA conjugate has the antineoplastic effect comparable with standard drug 5-FU’s efficacy and thereby maintain normal physiological profile in mice.
REFERENCES

Jyotsna Shankar, Manjunath Mudagal, Uday Raj Sharma, Surendra Vada, Haribabu T, Ranjith Muniswamy, Nageena Taj, Gayathri S V, Tejaswini G, Apocynin-Hyaluronic Acid Bioconjugate as Potential Prodrug for Anticancer Therapy, Int. J. of Pharm. Sci., 2026, Vol 4, Issue 3, 856-878. https://doi.org/10.5281/zenodo.18925217
 10.5281/zenodo.18925217
