Maharaja Agrasen School of Pharmacy, Maharaja Agrasen University, Baddi, Himachal Pradesh, India.
Lopinavir is a BCS Class II drug exhibiting poor bioavailability due to P-gp efflux and limited permeation. The aim of this research was to formulate and characterize co-crystals of lopinavir using tartaric acid as coformer to improve its solubility and dissolution. The co-crystals were prepared successfully using tartaric acid coformer by neat dry grinding and liquid assisted grinding methods. For lopinavir, co-crystal L5 (lopinavir:tartaric acid 1:2) prepared by liquid assisted grinding method showed better solubility and dissolution. The dissolution study of lopinavir showed 96% drug release in 60 minutes. This indicates that the L5 co-crystals showed faster drug release compared to the pure drug which can be attributed to the formation of a new crystalline species with weaker crystallinity due to possible hydrogen bond interactions with the coformer. The interaction between lopinavir and tartaric acid was further investigated using Fourier transform infrared, differential scanning calorimetry, and X-ray diffraction studies. The cocrystallization of lopinavir with the water-soluble conformer tartaric acid prepared by the solvent assisted dry grinding method might be considered a promising approach with improved solubility and dissolution rate.
The protease inhibitor lopinavir has been used extensively for many years as a treatment for HIV infection in both adults and children.1,2 Lopinavir also showed promise as a treatment for fungal infections by inhibiting the proliferation of some fungal cells.3 Furthermore, lopinavir has been researched as a possible therapy for certain parasitic infections.4 Lopinavir has recently been evaluated for treating COVID patients either by itself or in conjunction with ritonavir, although with limited success.5,6.

The enzyme cytochrome P450 3A4 extensively metabolizes lopinavir in the liver and gastrointestinal (GI) tract, and P-glycoprotein efflux has a major impact. In addition, lopinavir's poor oral bioavailability is due to its sluggish dissolution and poor water solubility.7-9 As a result, the blood concentration of lopinavir falls short of the therapeutic level. To address this bioavailability issue, fixed-dose combinations of ritonavir and lopinavir are now commercially available. However, as lopinavir is ten times more effective than ritonavir, the in vivo action of ritonavir has been found to be insignificant. This suggests that lopinavir is primarily responsible for the in vivo action of the lopinavir-ritonavir combination.10 Additionally, the lopinavir-ritonavir oral solution has a very bitter taste and contains large quantities of alcohol, which might produce gastrointestinal side effects.11,12 To increase the oral bioavailability of lopinavir, a formulation free of ritonavir is required. Tartaric acid has been used extensively as a coformer and is generally regarded as a safe chemical.13-16 Because of its high aqueous solubility, which promotes the formation of co-crystals with a high solvation capacity, tartaric acid is a coformer that is frequently utilized in co-crystals intended to boost the aqueous solubility of drugs. Moreover, tartaric acid is inexpensive. The literature review revealed that while certain lopinavir co-crystals have been published thus far, there has not, to the best of our knowledge, been a systematic synthesis and characterization of a lopinavir-tartaric acid co-crystal.17-21 Moreover, lopinavir has both hydrogen bond donor and hydrogen bond acceptor sites, resulting in a high probability of co-crystal formation with co-formers.14 Therefore, the present proposal aimed to develop co-crystals of the poorly water-soluble antiviral drug lopinavir to increase the solubility and bioavailability of lopinavir by using co-crystallization with tartaric acid as a conformer and confirmation of co-crystal formation by solid-state characterization (Fourier transform infrared (FTIR), differential scanning calorimetry (DSC), and X-ray diffraction (XRD)).
MATERIALS AND METHODS:
MATERIALS
Pure lopinavir was obtained as a gift sample from Glaxo Smithkline, India. Tartaric acid was obtained from HiMedia (Mumbai, India). Both were used as received. All the required solvents and excipients were obtained from Loba Chemie Pvt. Ltd.
Preparation of co-crystals of lopinavir and tartaric acid prepared by dry grinding method:
Co-crystals of lopinavir were prepared by dry mixing using tartaric acid as a conformer.16 Lopinavir and tartaric acid were used in the following ratios: 1:1 (L1), 1:2 (L2), and 2:1 (L3). Lopinavir and tartaric acid were triturated in a mortar and pestle for approximately 60 min in a clockwise direction until a homogenous mixture was obtained. The mixture was then transferred to an airtight container and stored at room temperature.
Preparation of co-crystals of lopinavir and tartaric acid prepared by Liquid assisted grinding method:
This method used a methanol-assisted kneading process to create the co-crystals.22 Lopinavir and tartaric acid were weighed and ground in a mortar and pestle for ten minutes in specific ratios of 1:1 (L4), 1:2 (L5), and 2:1 (L6). Methanol was then added dropwise while the mixture was continuously ground to create a smooth paste. The paste was continuously ground until the methanol evaporated and a flowable powder was formed. After formation, the co-crystals were kept at room temperature (25°C) overnight. The mass was then placed in an airtight container after passing through a sieve with a mesh size of 60.
Determination of drug content:
An equivalent quantity of the formulations (L1, L2, L3, L4, L5, and L6) containing 10 mg of lopinavir was taken, dissolved in 10 mL of methanol, shaken for 10-15 min, and the volume was adjusted to 100 mL using the dissolution medium 0.01 M phosphate buffer (pH 6.8) to determine the drug content in the preparation. The samples were examined at λmax 256 nm using a UV-Visible spectrophotometer (Systronics, India). All observations were perofrmed in triplicate, and the average and standard deviation were calculated. The drug content was calculated as the percentage of the theoretical amount expected in the formulation.
Solubility study:
The saturation solubility of lopinavir and its formulations (L1, L2, L3, L4, L5, and L6) was determined in distilled water using the shake-flask method. To 250 mL conical flasks containing 100 mL of distilled water, an excess amount of lopinavir and its equivalent amounts of different formulations were introduced separately. The flasks were shaken for 12 h at 37±0.5°C using an orbital shaker (REMI Instruments, India) at a stirring speed of 150 rpm. After passing through a 0.45μm filter, UV spectrophotometry was used to measure the concentration at 256 nm. The tests were conducted in triplicate for each case.
Construction of calibration curve:
The primary stock solution (1 mg/mL) of lopinavir was prepared. To do this, 100 mg of precisely weighed lopinavir was added to a 100 mL volumetric flask, and the volume was adjusted to 100 mL by diluting it with the pH 6.8 phosphate buffer. From this stock solution, various dilutions ranging from 2 to 10 µg/mL were prepared for the analysis. The absorbance of these dilutions was assessed using a double-beam UV spectrophotometer (Systronics, India) at 256 nm and plotted against the concentrations to create a standard curve. The standard plot of lopinavir demonstrated high linearity with a regression coefficient of 0.997 in phosphate buffer, indicating that it complies with Beer-Lambert's law.
In vitro dissolution studies of lopinavir:
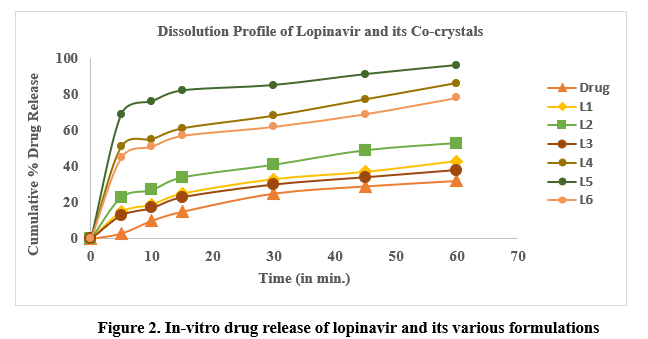
Dissolution studies of lopinavir and its various formulations (L1, L2, L3, L4, L5, and L6) were carried out using a USP type II paddle apparatus (Electrolab India Pvt. Ltd., India). The dissolution medium consisted of 900 mL of 0.01 M phosphate buffer (pH 6.8). The temperature of the dissolving medium was set at 37 ± 0.5oC while the paddle rotated at 50 rpm. Pure drug (100 mg) and co-crystal formulations (equivalent to 100 mg of the drug) were added to the dissolving vessel containing 900 mL of the dissolution medium. Five milliliter samples were taken out and filtered using a 0.45 µm Millipore filter at predetermined intervals of 5, 10, 15, 30, 45, and 60 min. To maintain sink conditions, an equivalent volume of fresh dissolving medium was added once the sample was removed. UV spectrophotometry at 256 nm was used to determine the amount of dissolved drug in aliquots collected at various intervals. Each dissolution study was conducted in triplicate.13. To create dissolution profiles, the cumulative amount of dissolved lopinavir was plotted against time. The amount of drug dissolved in the first five minutes (Q5) was then recorded.
Statistical analysis:
In the dissolution test, all data are presented as the mean of 12 individual observations with the standard deviation of the mean. In order to evaluate the impact of co-processing lopinavir with tartaric acid on the dissolution rate, the in vitro data were subjected to statistical analysis using two different statistical methods: the dissolution efficiency (D.E.) model and the fit factors f1 (difference factor) & f2 (similarity factor).23 Using the generated profiles, the dissolution efficiency (DE) was determined from the area under the dissolution curve up to time t, estimated using the nonlinear trapezoidal rule. It can be calculated using the Equation 123:
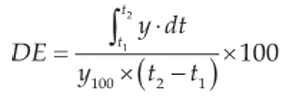
where y is a function of the percentage of drug dissolved at time t D.E. is the area under the dissolution curve between time points t1 and t2 expressed as a percentage of the curve at maximum dissolution, y100, over the same time period. The integral of the numerator, that is, the area under the curve, is calculated using a model-independent method, the trapezoidal method. The area under the curve is the sum of all trapeziums defined by Equation 2:
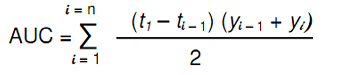
Where ti is the ith time point, yi is the percentage of dissolved product at time ti
The similarity factor was calculated using the following equation 323:
f2= 50. log 1+1nt=1nRt-Tt2-0.5.100
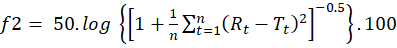
where f2 denotes the similarity factor, ‘n’ represents the number of data points, Rt represents the percentage of drug dissolved from the reference formulation (pure drug lopinavir) at time t, and Tt is the percentage of drug dissolved from the test sample (co-crystal formulation) at the same time point. For the dissolution profiles to differ significantly, the f2 value must be less than 50%.24 The f2 value is sensitive to the number of time points, and a reliable dissolution pro?le comparison in terms of the similarity factor requires at least three to four more points. The factor, f1, is the average % difference over all time points in the amount of test brand dissolved compared to the reference formulation (pure drug lopinavir). The difference factor (f1) was calculated using the following equation 423:
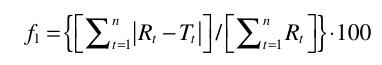
where n is the number of time points, Rt and Tt are the dissolution values of the reference and test batches at time t. For curves to be considered similar, f1 values should be close to 0 (<15).24
Fourier-transform infrared spectroscopy (FTIR):
Using an FTIR spectrophotometer (IRTracer-100, Shimadzu Analytical India Pvt. Ltd., India), IR spectroscopy was used to analyze the potential interactions between the drug and coformer in the solid state for the co-crystal formulation L5 (a formulation with the best drug release profile). The KBr pellet technique was used to prepare the sample.
Differential scanning calorimetry (DSC):
DSC analysis of the pure drug, tartaric acid, and co-crystal formulation L5 was performed to assess the molecular state of the drug in the co-crystal formulation. A differential scanning calorimeter (Mettler DSC 823e, Mettler-Toledo, Germany) was used to obtain the DSC curves of the samples. The average sample weight (5 ± 2 mg) was heated in an aluminum pan between 50°C and 300°C while maintaining a steady 30 mL/min argon gas flow and heating at a rate of 10°C/min.
Powder X-ray diffraction (PXRD):
Powder X-ray examination was performed on samples that included pure lopinavir, a coformer (tartaric acid), and formulation L5. An X-ray diffractometer (D8 Advance, Bruker, USA) operating at 40 kV and 40 mA was used to obtain the diffractogram. Cu was employed as the X-ray source with a wavelength of 1.5406 Å.
RESULTS:
Drug content determination:
For each formulation, the drug content was ascertained in triplicate (Table 1).
Table 1: Drug content of co-crystal formulations.
|
Co-crystal Formulation |
Percent Drug Content* ± S.D. |
|
L1 |
86.7±0.6 |
|
L2 |
87.4±0.5 |
|
L3 |
87.7±0.6 |
|
L4 |
85.4±0.9 |
|
L5 |
87.9±0.8 |
|
L6 |
85.7±0.9 |
*Average of three determinations
Solubility study:
The results of the solubility studies for lopinavir and its co-crystal formulations L1, L2, L3, L4, L5, and L6 are shown in Figure 1.

Drug dissolution study:
Dissolution studies were conducted to investigate the impact of co-processing with tartaric acid using dry grinding and liquid-assisted dry grinding on the dissolution rate of lopinavir. The resulting dissolution profiles are shown in Figure 2. The dissolution profile of pure untreated lopinavir showed sluggish and incomplete dissolution, with 3% of the drug dissolved in the first five minutes and the calculated percentage drug release after 60 min was only 32%. These values are unacceptable for immediate release. For the co-crystals L1, L2, and L3, the calculated Q5 values were 15%, 23%, and 13%, respectively, and the calculated drug release after 60 min was 43%, 53%, and 38%, respectively, whereas the dissolution analysis with co-crystals L4, L5, and L6 revealed 86%, 96%, and 78% drug release, respectively. The calculated percentage Q5 values were 46%, 67%, and 39% for the co-processed mixtures L4, L5, and L6, respectively.
Statistical Analysis:
Liponavir-tartaric acid cocrystals prepared by the liquid-assisted dry grinding method had significantly enhanced dissolution efficiency than liponavir and the co-crystals prepared by dry grinding (Table 2). Analysis of the difference/similarity factors (Table 2) when the dissolution profile of different formulations was compared with that of pure drug lopinavir suggested that the dissolution profiles of liponavir were different from those of cocrstals.24
Table 2: Q5, dissolution efficiency, difference factor and similarity factor of dissolution profiles.
|
Formulation |
Q5 (%) ± S.D. |
DE (%) ± S.D. |
f1 |
f2 |
|
Lopinavir |
3 ± 0.3 |
20.96 ± 1.3 |
- |
- |
|
L1 |
15 ± 0.5 |
29.25 ± 0.9 |
50.88 |
50.37 |
|
L2 |
23 ± 0.8 |
38.0 ± 0.8 |
99.12 |
36.13 |
|
L3 |
13 ± 0.4 |
26.54 ± 1.2 |
35.96 |
57.35 |
|
L4 |
51 ± 1.2 |
63.88 ± 1.7 |
249.12 |
16.18 |
|
L5 |
69± 1.5 |
78.88 ± 1.3 |
337.72 |
9.62 |
|
L6 |
45 ± 1.04 |
58.13 ± 1.8 |
217.54 |
19.13 |
Fourier transform infrared (FTIR) studies:
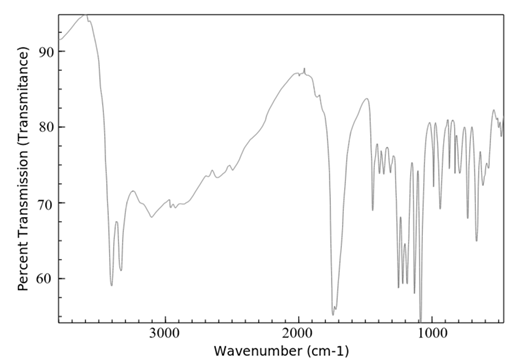
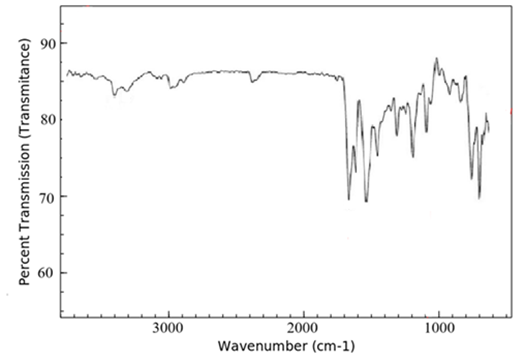
FTIR spectra of lopinavir, tartaric acid, and the co-crystal L5 are shown in Figure 3. The FTIR spectra of lopinavir revealed peaks at 3460 cm-1 and 3350 cm-1, which correspond to the -OH and N-H stretching bands, respectively, as shown in Figure 3a. The C-H frequency for aromatic and aliphatic carbons was observed from 2850 cm-1 to 3080 cm-1. The frequency of the C=O amide functional group was noted at 1660 cm-1 and 1530 cm-1. The stretching peak of C–N was evident at 1450 cm-1. Similar FTIR spectrum for lopinavir was reported by various investigators.19,21. The FTIR spectrum of tartaric acid (Figure 3b) showed the stretching vibration of a hydroxyl function group by wave number 3400 cm-1, followed by the C=O carboxylic acid bond at wave number 1750 cm-1 and the C-O bond at wave number 1090 cm-1.25

(c) Co-crystal L5
(b) Tartaric acid
(a) Pure lopinavir
Figure 3. FTIR spectra of (a) pure lopinavir, (b) tartaric acid and (c) co-crystal L5
Differential scanning calorimetry (DSC):
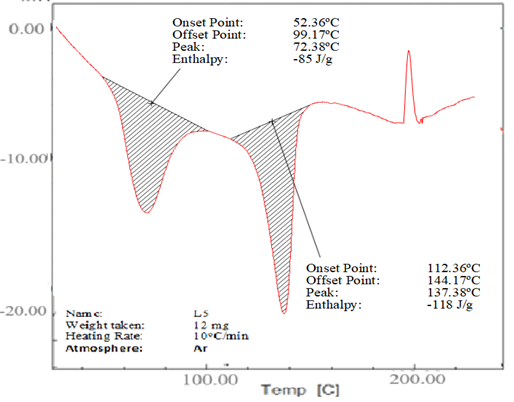
The DSC thermograms of lopinavir, tartaric acid, and their co-crystal L5 are shown in Figure 4. The purity and crystallinity of lopinavir were demonstrated by a single endotherm with an onset temperature of 115.25°C and Tmax of 126.32°C (Figure 4a).26 However, tartaric acid also showed a single endothermic peak at 172.48°C, which was ascribed to its melting transition (Figure 4b).25 Two endothermic peaks at 72.38°C and 137.38°C were shown by co-crystal L5 (Figure 4c).
(c) Co-crystal L5
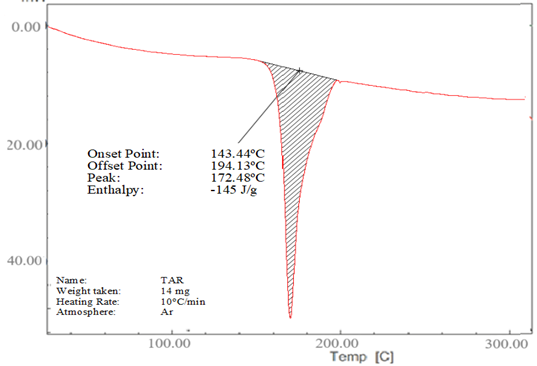
(b) Tartaric acid
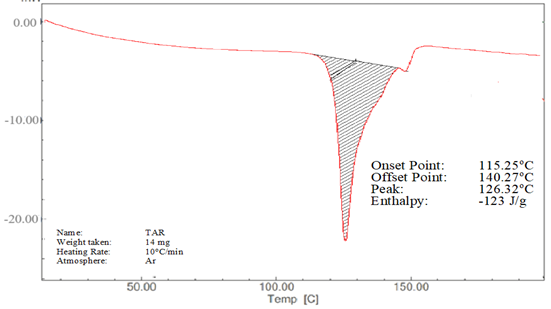
(a) Lopinavir
Figure 4. (a) DSC thermogram of lopinavir, (b) tartaric acid and (c) co-crystal L5
Powder X-Ray diffraction:
The diffraction patterns of pure lopinavir, tartaric acid, and co-crystal L5 are shown in Figure 5. The diffraction pattern of pure lopinavir (Figure 5a) showed high-intensity peaks at 2-theta values of 4.9°, 7.4°, 8.5°, 9.7°, 12.4°, 12.8°, 14.8°, 16.3°, 17.4°, 18.3°, 20.9°, and 21.8°, suggesting its crystalline nature. The diffraction pattern of tartaric acid (Figure 5b) showed peaks at 20.7°, 21.2°, 28.2 °, 29.8 °, 32.8 °, and 33.4 o whereas in diffraction pattern of co-crystal L5 (Figure 5c), some peaks were displaced and some were absent.
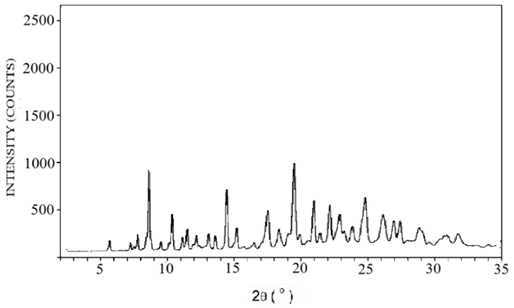
(c) Co-crystal L5
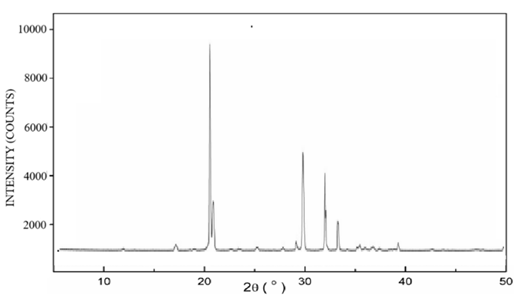
(b) Tartaric acid
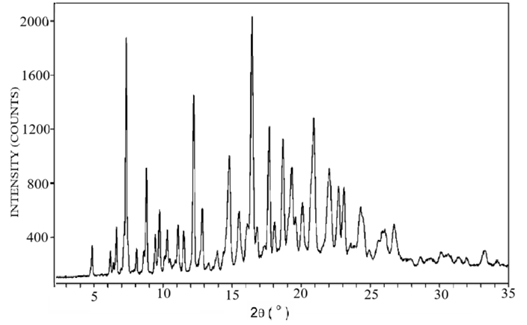
(a) Pure lopinavir
Figure 5. X-ray diffractogram of (a) pure lopinavir, (b) tartaric acid and (c) cocrystal L5
DISCUSSION:
Drug content determination:
The values exceeded 85% in all the co-crystals, indicating that all the co-crystal formulations had good content uniformity.
Solubility study:
Pure lopinavir showed poor solubility of 2.8 µg/mL, which is a known limitation for the drug’s bioavailability.20,27 Poor solubility directly impacts dissolution, leading to slow dissolution rates and potentially hindering drug absorption. This can result in low bioavailability, meaning that the drug does not reach sufficient concentrations in the blood to exert its therapeutic effect. The co-crystals L1, L2, and L3 prepared by the dry grinding method showed an increase in solubility, as shown in Figure 1. The slight increase in the solubility of these co-crystals is due to the reduction in particle size, which increases the available surface area for interaction with the dissolution medium. However, it does not inherently increase the drug's ability to dissolve in solution. Solid-state modifications are often required for significant solubility enhancement. In comparison to pure lopinavir (2.8 µg/mL), the formulations L4, L5, and L6 prepared by the liquid-assisted grinding method exhibited a dramatic increase in solubility. Formulation L5 exhibited the maximum solubility in water (94.24 µg/mL), which was 33.7 times higher than that of the pure drug. This enhanced solubility may be due to the formation of tiny cocrystal seeds within the solvent during the grinding process, which can increase the rate of cocrystallisation. Cocrstallization may also alter the crystalline structure of lopinavir, lowering its lattice energy and facilitating an improved water interaction leading to faster and more complete dissolution.28-30
Drug dissolution study:
The hydrophobic properties of lopinavir are reflected in its slow dissolution rate. There was not much significant enhancement in the dissolving rate of lopinavir co-crystals prepared by dry grinding method (Figure 2). This result confirms the recorded solubility data. But, the dissolution rate of lopinavir was significantly increased by co-crystals of lopinavir and tartaric acid made using a liquid-assisted grinding technique which was dependent on the molar ratio of tartaric acid to lopinavir. It could be inferred that increasing the quantity of tartaric acid in L5 had achieved a significant impact on the dissolution rate but dissolution rate decreased on increasing the quantity of drug in cocrystal L6.30,31 This suggests that L5 co-crystals exhibited a quicker release of the drug in comparison to L4, L6, and pure drug. The remarkable increase in the dissolution rate could be explained by the modification in the crystal habit where molecules might be arranged in less packed crystalline arrays via intermolecular H-bonding compared to the parent drug molecules. This explanation is strongly supported by the data obtained from FTIR, DSC and PXRD implying the production of new crystalline states. A higher dissolution rate also might be attributed to the fact that the coformers used in the study are highly soluble in the aqueous medium, which leads to dissociation of the cocrystals to its components and thereby allowing fast dissolution.29,32
Fourier transform infrared (FTIR) studies:
FTIR is an outstanding method for providing insight into the type of investigation into the chemical and physical changes in a substance's molecular structure. FTIR spectroscopy is used to verify co-crystal formation because it may identify variations in chemical structures of sample that point to the production of hydrogen bonding. In the case of co-crystal, peak broadening after 3000 cm-1 (Figure 3c) and decrease in intensity of C=O ketone group of tartaric acid indicates intermolecular hydrogen bond formation that confirms the formation of co-crystals. Similar results were obtained by Varma et al. during the formation of co-crystals of zoledronic acid with tartaric acid.16
Differential scanning calorimetry (DSC):
The drug's thermotropic behaviour and physical condition in the co-crystal were assessed by using DSC analysis. Important details concerning co-crystals, including their melting temperature, enthalpy of fusion, thermal transition temperature, and crystallinity, can be obtained via differential scanning calorimetry. Nevertheless, two endothermic peaks at temperatures below the melting points of tartaric acid and lopinavir alone were seen in the distinctive endotherm of co-crystal L5 (Figure 4c). At 72.38oC, the first endothermic peak appeared, possibly as a result of the eutectic mixture melting. Co-crystal melting was shown by the second endothermic peak, which was located at 137.38°C. The depression in melting point with co-crystal was caused by the decrease in particle size and increase in surface area. Co-crystals of lopinavir showed a decrease in its melting point, suggesting an interaction between lopinavir and tartaric acid. This shift in melting point was due to change in crystal lattice of lopinavir in the presence of co-former, forming a comparatively distinct crystal lattice in co-crystals. Jassim et al. found similar results in the DSC scan of dextromethorphan HBr co-crystals with tartaric acid.25 Reduced melting events have a positive influence on the solubility of the product.
Powder X-Ray diffraction:
The formation of lopinavir–tartaric acid co-crystal was confirmed by the displacement of some peaks and the absence of others in the PXRD diffractogram obtained for the co-crystal L5 (in comparison to their positions seen for individual components) (Figure 5c). These results are in accordance with the results of co-crystals of meloxicam with tartaric acid prepared by Macasoi et al.33 and cocrystals of tinidazole with tartaric acid prepared by Madan et al.13
CONCLUSION:
The co-crystals were prepared successfully using tartaric acid coformer by neat dry grinding and liquid assisted grinding methods indicated by good content uniformity. For lopinavir, co-crystals L5 showed better solubility and dissolution. The dissolution study of lopinavir showed 96% drug release in 60 minutes in the co-crystal L5. The computed % Q5 values for this co-processed mixture was 67% and the calculated DE for the same tested formulation was 78.88%. This indicates that L5 co-crystals showed faster drug release compared to other co-crystals as well as pure drug. This enhancement in lopinavir dissolution rate in case of the formulations containing lopinavir and tartaric acid can be accredited to formation of a new crystalline species with weaker crystallinity due to possible hydrogen bond interaction with coformer. The interaction between lopinavir and tartaric acid was further confirmed by FTIR, DSC and XRD studies. In conclusion, the cocrystallization of lopinavir with water-soluble conformer tartaric acid prepared by solvent assisted dry grinding method might be considered as a promising approach with improved solubility and dissolution rate.
REFERENCES


Ajay Kumar, Amit Kumar Aggarwal*, Cocrystallization Technique to Improve the Solubility and Dissolution Rate of Lopinavir, Int. J. of Pharm. Sci., 2025, Vol 3, Issue 8, 2452-2466 https://doi.org/10.5281/zenodo.16931281
 10.5281/zenodo.16931281
