Noble Pharmacy College, Noble University, Junagadh- Bhesan Road, Via.Vadal Nr. Bamangam, Junagadh - 362310, Gujarat, INDIA.
A robust, accurate, and stability-indicating RP-HPLC method was developed and validated for the simultaneous estimation of Atazanavir and Cobicistat in their tablet dosage form using a Quality by Design (QbD) approach. A fractional factorial design was applied to screen critical method parameters, including flow rate, mobile phase pH, and injection volume. Analysis of variance (ANOVA) confirmed that these three factors significantly impacted method performance. Chromatographic separation was achieved on a Hypersil BDS C18 column (250 × 4.6 mm, 5 ?m) using a mobile phase of phosphate buffer (pH 4.0) and methanol in a 50:50 ratio, at a flow rate of 1.0 mL/min. Detection was carried out at 240 nm. Retention times were 3.750 min for Atazanavir and 6.084 min for Cobicistat. The method was validated as per ICH Q2(R1) guidelines and showed good linearity, accuracy, precision, and specificity, with no interference from degradation products. The developed method is simple, reliable, and suitable for routine quality control analysis of Atazanavir and Cobicistat in fixed-dose combination tablets.
HIV (Human Immunodeficiency Virus) is primarily transmitted through the exchange of bodily fluids such as blood, semen, vaginal secretions, and breast milk. Common routes of transmission include unprotected vaginal or anal sex, sharing of contaminated needles, and from an infected mother to her child during pregnancy, childbirth, or breastfeeding (1). HIV compromises the immune system by destroying specific white blood cells, increasing susceptibility to infections and cancers. Initial symptoms may include fever, rashes, swollen lymph nodes, and fatigue, which can subside, leading to a long asymptomatic phase. Without treatment, HIV progresses to AIDS (acquired immunodeficiency syndrome), marked by severe infections and malignancies. Diagnosis is confirmed through blood tests that detect antibodies or measure the viral load. While tears, urine, and saliva may contain trace amounts of the virus, transmission through these fluids is extremely rare (2). Sexual contact remains the most common method of HIV transmission, especially in the absence of condom use. Risk increases with the presence of genital sores or high viral loads. In healthcare settings, needle-stick injuries can pose a transmission risk, though post-exposure treatment significantly reduces it. Vertical transmission from mother to child can occur during all stages of childbirth and through breastfeeding. In medical settings, HIV can be transmitted through transfusions with contaminated blood or unsterilized instruments (3). Regarding antiretroviral therapy, the fixed-dose combination drug EVOTAZ includes Atazanavir and Atazanavir is a protease inhibitor with antiviral activity against HIV. It is metabolized primarily through CYP3A pathways (2,4). Cobicistat acts as a pharmacokinetic enhancer by inhibiting CYP3A enzymes, thereby increasing Atazanavir’s effectiveness without possessing antiviral properties itself (5,6). Both drugs have well-defined physicochemical properties, including high molecular weights and low aqueous solubility (Figure 1).
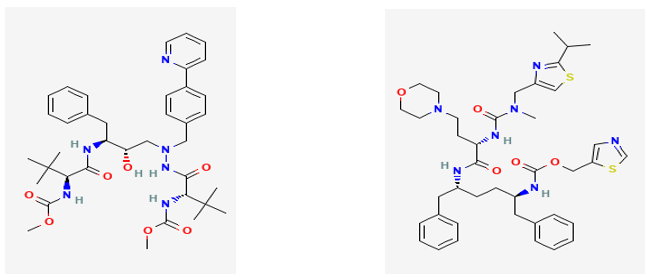
Figure 1 Structure of Atazanavir and Cobicistat
In the pharmaceutical field, quality assurance is vital for ensuring drug safety and efficacy. Analytical methods, particularly High-Performance Liquid Chromatography (HPLC), play a crucial role in drug analysis, standardization, and quality control. HPLC is favored for its high sensitivity, selectivity, and precision. There are two primary modes of HPLC used in pharmaceuticals: Normal Phase and Reverse Phase. Reverse Phase HPLC is most common, where non-polar stationary phases are used, and polar compounds elute first. It is ideal for analyzing the mostly polar pharmaceutical compounds. HPLC methods must be validated according to ICH guidelines, covering parameters like accuracy, precision, specificity, detection limits, quantitation limits, linearity, range, and robustness. Method validation ensures reliability and accuracy in drug testing. Forced degradation studies are critical in developing stability-indicating methods. These studies expose drug substances to stress conditions such as heat, light, pH extremes, and oxidation to understand degradation pathways and product stability. However, no Stability indicating RP-HPLC method have been reported with Greenness assessment for simultaneous estimation of ATZ and CBC utilizing the Analytical Quality by Design approach (7–20). The concept of Quality by Design (QbD) in analytical development emphasizes a systematic approach that integrates risk assessment, process understanding, and control strategies. QbD enhances method robustness, reduces variability, and facilitates smoother regulatory compliance and technology transfers (21,22). In conclusion, effective HIV management involves understanding transmission, employing reliable diagnostic and analytical methods, and using optimized drug formulations. Scientific rigor in analytical development ensures drug quality, safety, and therapeutic efficacy, with drugs like Atazanavir and Cobicistat forming essential components of modern HIV treatment regimens.
MATERIALS AND METHODS
Chemicals
Atazanavir and Cobicistat Standard gift samples were provided by Zydus LifeScience. Water, Methanol, Acetonitrile and Ortho Phosphoric Acid (HPLC grade) was used for development purpose. (Merck). EVOTAZ formulation was obtained from Local Market.
Instrumentation and chromatographic conditions
A Shimadzu high-performance liquid chromatography (HPLC) system was used to create the approach. This system was managed by LC Solution software and had a PDA detector, sample manager, solvent degasser, and quaternary solvent manager. It also had a column oven to regulate the analytical column's temperature and a cooling auto-sampler. Weighing was done precisely with a Shimadzu analytical balance. Using a reverse-phase Hypersil BDS C18 (250 X 4.6 mm) (5μm), chromatographic separation was accomplished. A mobile phase consisting of Phosphate Buffer pH 4 (adjusted with ortho phosphoric destructive): Methanol (65: 35) v/v % in a v/v ratio was used in the isocratic elution process. The flow rate was maintained at 0.95 ml/min, and the eluents were monitored with a PDA detector set at 257 nm. Design Expert 13.0 trial version was used for designing the experiments.
Preparation of standard solution
To prepare the standard stock solution of Atazanavir (ATZ), approximately 300 mg of the working standard was accurately weighed and transferred into a 100 mL volumetric flask, followed by the addition of methanol. The solution was sonicated for 5 minutes and then diluted to volume with methanol. From this solution, 1 mL was pipetted into another 100 mL volumetric flask and diluted to volume with diluent, then mixed well. Similarly, for the Cobicistat (CBC) stock solution, about 150 mg of the working standard was accurately weighed and transferred into a 100 mL volumetric flask. Methanol was added, the solution was sonicated for 5 minutes, and the volume was made up with methanol. From this, 1 mL was transferred into a separate 100 mL volumetric flask, diluted to volume with diluent, and mixed thoroughly.
Preparation of sample solution
Accurately weigh 2 mg powder to be examined in 100 ml volumetric flasks. Add about 50 ml of diluents and sonicated to dissolve it completely and make volume up to the mark with diluents. From above solution 1 ml aliquot was transferred in 10 ml volumetric flask and diluted up to the mark with diluents.
Selection of detection wavelength
To determine wavelength for measurement, standard spectra of ATZ and CBC were scanned between 200-400 nm against. The wavelength was selected for analysis of both the drugs was 240 nm.
Method Development and Optimization through QbD approach
Identification of ATP, CMAs, and Risk Assessment
The Analytical Target Profile (ATP) is essential for determining the critical variables needed to guarantee the quality attributes and method goals during the development of analytical methods. The ATP includes elements including the sample's properties, the analyst's experience, and the analytical methods used. All of these elements work together to effectively design and optimize the analytical procedure. Identification of ATP was made after literature search and initial risk assessment in which were followed studies that present different methods for determining HPLC, respectively, the implementation of QbD principles in the development of HPLC methods. The selected CMPs were related to a Flow Rate, pH of Mobile phase- Buffer (pH 4) and Injection Volume. An Ishikawa (fishbone) diagram was employed to identify potential risks and root causes that could impact the performance of the RP-HPLC method.
Design of experiment (DOE)
For decades HPLC development was based on a trial and error methodology, but employing a time-consuming trial-and-error approach resulting only in an apparent optimum and information concerning the sensitivity of the factors on the analytes separation and interaction between factors is not available. To achieve this objective, any one of the Chemometrics methods which includes the overlapping resolution maps, factorial design and response surface methodology can be applied. The best experimental design approach for the purpose of modeling and optimization are the response surface design. CCD (Central Composite Design) is chosen due to its flexibility and can be applied to optimize an HPLC separation by gaining better understanding of factor’s main and interaction effects. CCD is more advantageous than Box-Behnken design because in CCD, design space is larger due to axial point. The selection of key factors examined for optimization was based on preliminary experiments. The factors selected for optimization process were Flow Rate (A), pH of Mobile phase- Buffer (pH 4) (B) and Injection Volume (C). Retention times of both drugs and Resolution between them were selected as Response. All experiments were conducted in randomized order to minimize the effects of uncontrolled variables that may introduce a bias on the measurements. A three factor CCD requires 19 experiments, including four center points using rotatable CCD design.
Force Degradation
In order to demonstrate the stability of both the standard and sample solutions during analysis, both solutions were analyzed over a period of 24 h at room temperature. The results indicated that for both the solutions, the retention time and peak area of ATZ and CBC did not show much% difference. There was no significant degradation within the indicated period. Hence, it was concluded that both the solutions were stable for 24 h at room temperature
Analytical method development
Linearity
Linearity is expressed in teams of correlation co-efficient of liner regression analysis. Standard calibration curves were constructed using five standard calibration solutions in a concentration range 15- 120 μg/ml of ATZ and 7.5-60 μg/ml of CBC. Each solution was chromatographed using spinchrom software and scanned between 200-400 nm and spectra were recorded.
Precision
The precision of the method was confirmed through repeatability, inter-day, and intra-day studies by analyzing different concentrations of Atazanavir (ATZ) and Cobicistat (CBC). Results showed consistent % RSD values, indicating that the method is reliable and reproducible for accurate quantification of both drugs.
Recovery studies
The accuracy of the method was determined by calculating recovery of ATZ and CBC by standard addition method. The known amount of standard solutions of ATZ (15, 30, 60) and CBC (7.5, 15, 30 μg/ml) and were added to a pre-determined sample solution of ATZ (30 μg/ml) and CBC (15 μg/ml). Each response was average of three determinations. The percentage recovery was calculated by measuring the absorbance and fitting these values into the regression equation of respective calibration curves.
Limit of quantification (LOQ) & Limit of detection (LOD)
From the set of 6 calibration curves that were used to assess the linearity of the procedure, the LOQ & LOD was estimated. The LOQ & LOD could be computed as
LOQ = 10 σ/s, LOD = 3.3 σ/s
Where, σ = the SD of the response. S = the slope of the calibration curve
Specificity
The analytical method for specificity was evaluated by injecting the following solutions. Diluent was prepared and inject into the HPLC system in triplicate. Sample solution was prepared with appropriate levels of excipients as a placebo sample and inject into the HPLC system in triplicate for all the dosage strengths. Placebo was prepared by mixing all excipients without active ingredients. Standard and sample solutions were prepared for assay (100% Conc.) and inject into the HPLC system in triplicate.
Robustness
The robustness study was conducted to assess the effect of small, intentional variations in chromatographic conditions on method performance. Parameters such as flow rate (±0.2 mL/min) and pH (±0.2 units) were slightly altered. Following each change, the sample solution was injected, and the assay results along with system suitability parameters were evaluated to ensure the method remained reliable and consistent under varied conditions.
RESULTS AND DISCUSSION
Method development studies
Using a reverse-phase Hypersil BDS C18 (250 X 4.6 mm) (5μm), chromatographic separation was accomplished. A mobile phase consisting of Phosphate Buffer pH 4 (adjusted with ortho phosphoric destructive): Methanol (65: 35) v/v % in a v/v ratio was used in the isocratic elution process. The flow rate was maintained at 0.95 ml/min, and the eluents were monitored with a PDA detector set at 257 nm.
Utilization of CCD method for Optimization of RP-HPLC method
Central Composite Design (CCD) was selected for its flexibility and ability to effectively evaluate both main and interaction effects of variables in HPLC optimization. CCD is preferred over the Box-Behnken design due to its larger design space, made possible by axial points. Based on preliminary studies, three critical factors were chosen: Flow Rate (A), pH of the Mobile Phase Buffer (B), and Injection Volume (C). The responses selected were the retention times of both drugs and the resolution between them. A total of 19 randomized experiments were conducted using a rotatable CCD model, including four center points, to ensure robustness and minimize bias from uncontrolled variables. The design matrix and results are detailed in which also includes chromatograms corresponding to selected experimental conditions.
Model Selection and statistical parameters obtained from ANOVA
The selection of model was done which have lowest PRESS value and r2 value was nearer to 1 as shown in Table 2. Investigation of the associated probability revealed that for response 1 (Retention time (Rt) of ATZ), 2 (Retention time (Rt) of CBC) and 3 (Resolution between ATZ and CBC (Rs)) Quadratic models resulted in the best fitted. In this work, the following quadratic model was used to describe the response surface for response 1-3 respectively. 3D- response surface plots for each variable in explain effect of the CMPs on CAAs. Critical parameters such as Flow Rate, pH of the Mobile Phase Buffer, and Injection Volume are significant interaction on peak area. The curve graphs indicate the significant effect of all three parameters over retention time and resolution. Retention time (Rt) of ATZ (Y1): +3.65 + 0.0131 A+ 0.0639 B + 0.1269 C + 0.0273 AB + 0.0233 AC - 0.0605 BC +0.1026 A² - 0.1679 B² -0.1034 C². The positive coefficient of factor A, B and C suggests that the Retention time of ATZ is directly proportional to Flow Rate (A), Mobile phase- Buffer (pH 4) (B) and Injection Volume (C) (Figure 2).
Retention time (Rt) of CBC (Y2): +6.05 - 0.0095 A+ 0.0218 B + 0.0714 C + 0.0186 AB + 0.0079 AC - 0.0159 BC + 0.0320 A² + 0.0200 B² + 0.0483 C². The positive coefficient of factor B and C suggests that the Retention time of FOR is directly proportional to Mobile phase- Buffer (pH 4) (B) and Injection Volume (C). The negative value of Flow Rate (A) factor indicates less or no significant effect of A. Hence Retention time of CBC increases with increase in Mobile phase- Buffer (pH 4) (B) and Injection Volume (C) (Figure 3). Resolution between ATZ and CBC (Rs) (Y3): +11.23 - 0.0679 A+ 0.1040 B +0.1029 C -0.0912 AB -0.0512 AC +0.0738 BC - 0.0419 A² - 0.0472 B² + 0.2055 C².
 The positive coefficient of factor B and C suggests that the Resolution between ATZ and CBC is directly proportional to Mobile phase- Buffer (pH 4) (B) and Injection Volume (C). The negative value of Flow Rate (A) factor indicates less or no significant effect of A. Hence Resolution between ATZ and CBC increases with increase in Mobile phase- Buffer (pH 4) (B) and Injection Volume (C) (Error! Reference source not found.).
Table 1 Central Composite rotatable design arrangement and responses
|
|
|
Factor 1 |
Factor 2 |
Factor 3 |
Response 1 |
Response 2 |
Response 3 |
|
Std |
Run |
A: Flow rate |
B: Buffer (pH 4) |
C: Injection volume |
Retention time (Rt) of ATZ |
Retention time (Rt) of CBC |
Resolution between ATZ and CBC (Rs) |
|
|
|
mL/min |
|
mL |
Min |
Min |
|
|
11 |
1 |
1 |
3.1591 |
20 |
3.025 |
6.098 |
10.99 |
|
3 |
2 |
0.8 |
4.5 |
15 |
3.298 |
6.123 |
11.36 |
|
2 |
3 |
1.2 |
3.5 |
15 |
3.132 |
6.025 |
11.12 |
|
17 |
4 |
1 |
4 |
20 |
3.75 |
6.084 |
11.18 |
|
6 |
5 |
1.2 |
3.5 |
25 |
3.789 |
6.198 |
11.25 |
|
4 |
6 |
1.2 |
4.5 |
15 |
3.541 |
6.125 |
11.22 |
|
1 |
7 |
0.8 |
3.5 |
15 |
3.256 |
6.031 |
11.23 |
|
10 |
8 |
1.33636 |
4 |
20 |
3.852 |
6.089 |
11.11 |
|
16 |
9 |
1 |
4 |
20 |
3.652 |
6.036 |
11.14 |
|
12 |
10 |
1 |
4.8409 |
20 |
3.295 |
6.122 |
11.21 |
|
8 |
11 |
1.2 |
4.5 |
25 |
3.698 |
6.301 |
11.31 |
|
19 |
12 |
1 |
4 |
20 |
3.298 |
6.025 |
11.11 |
|
5 |
13 |
0.8 |
3.5 |
25 |
3.562 |
6.239 |
11.23 |
|
9 |
14 |
0.663641 |
4 |
20 |
3.998 |
6.199 |
11.12 |
|
20 |
15 |
1 |
4 |
20 |
3.696 |
6.054 |
11.21 |
|
13 |
16 |
1 |
4 |
11.591 |
3.256 |
6.089 |
11.65 |
|
18 |
17 |
1 |
4 |
20 |
3.798 |
6.059 |
11.36 |
|
14 |
18 |
1 |
4 |
28.409 |
3.429 |
6.291 |
11.98 |
|
15 |
19 |
1 |
4 |
20 |
3.693 |
6.069 |
11.36 |
|
7 |
20 |
0.8 |
4.5 |
25 |
3.62 |
6.201 |
11.99 |
Table 2 Summary of results of regression analysis for models and responses
|
|
Source |
Std. Dev. |
R-Squared |
Adjusted R-Squared |
Predicted R-Squared |
%CV |
P-value |
Precision (Adequate) |
|
Y1 |
Quadratic |
0.1682 |
0.7909 |
0.6027 |
0.1000 |
4.76 |
0.0176 |
7.5199 |
|
Y2 |
0.0361 |
0.9084 |
0.8260 |
0.3801 |
0.58 |
0.0004 |
11.805 |
|
|
Y3 |
0.1307 |
0.8761 |
0.7645 |
0.2585 |
1.16 |
0.0017 |
11.497 |
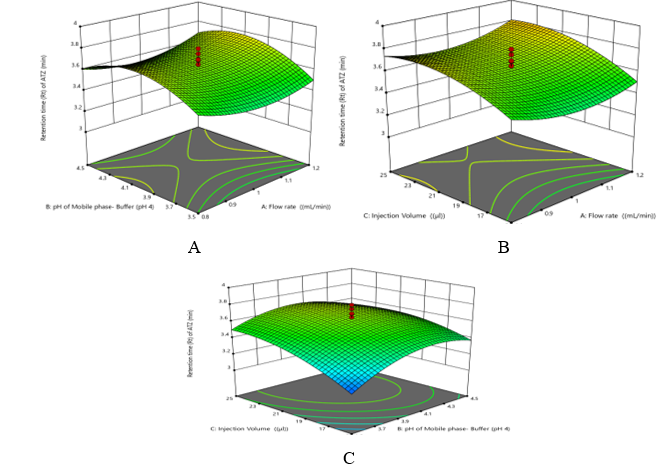
Figure 2 Three-dimensional plots of (A) Variation in Retention time (Rt) of ATZ as function of A and B while fixed factor C, (B) Variation in Retention time (Rt) of ATZ as function of A and C while fixed factor B (C) Variation in Retention time (Rt) of ATZ as function of C and B while fixed factor A
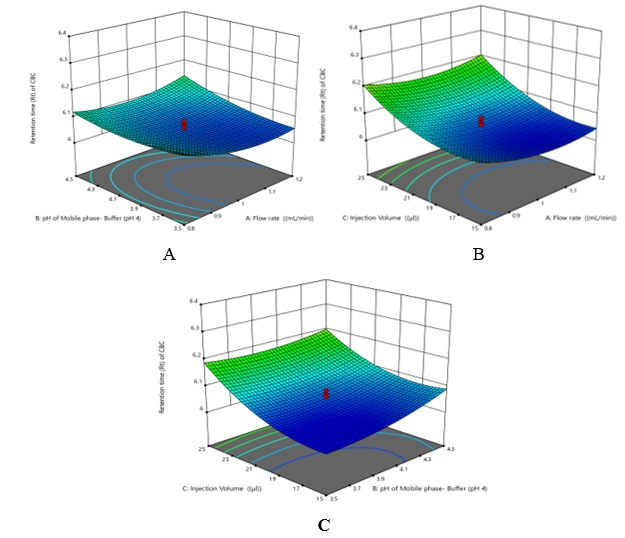
Figure 3 Three-dimensional plots of (A) Variation in Retention time (Rt) of CBC as function of A and B while fixed factor C, (B) Variation in Retention time (Rt) of CBC as function of A and C while fixed factor B, (C) Variation in Retention time (Rt) of CBC as function of C and B while fixed factor A
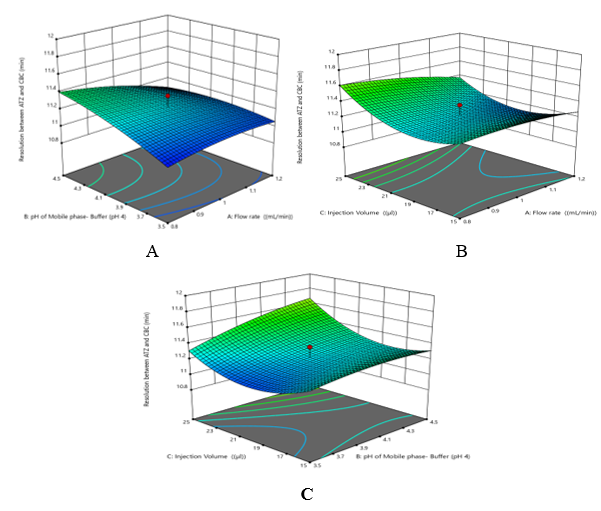
Table 3 Comparison of experimental and predictive value of different experimental runs under optimum conditions
|
Optimum Conditions |
Response
|
Responses (predicted) |
Responses (observed) |
Predicted error % |
|
1 |
Retention time (Rt) of ATZ |
3.721 |
3.750 |
0.779 |
|
Retention time (Rt) of CBC |
6.068 |
6.084 |
0.263 |
|
|
Resolution between ATZ and CBC |
11.15 |
11.18 |
0.269 |
From the %predicted error, it is concluded that a set of coordinates producing high desirability value (D = 1) at condition 1. Hence, Condition 1 had been proposed for selecting an optimum experimental condition for analyzing. The optimized solution showed the mobile phase composition containing Phosphate Buffer pH 4 (adjusted with ortho phosphoric destructive): Methanol (65: 35) v/v % in a v/v ratio, detection 257 nm and flow rate 1 ml/min yielded desirability close to 1.0 along with all the CAAs in the desired range. Under the chromatographic condition employed standard ATZ and CBC have shown sharp peaks and good separation show in Figure 5.
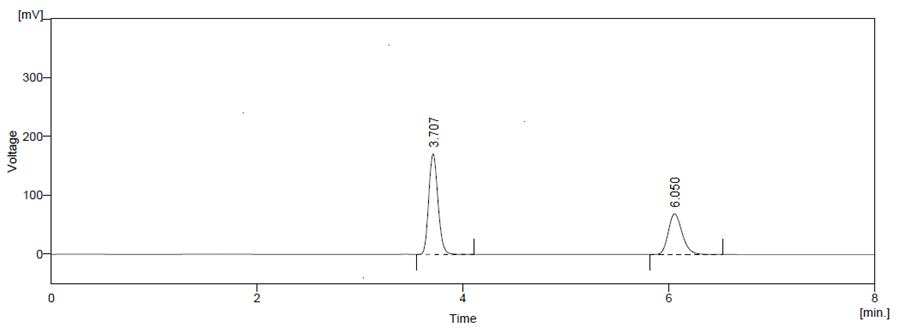
Figure 5 Final Optimized Chromatogram of High-performance liquid chromatography of standard
Table 4 Optimized Chromatographic condition for the estimation of ATZ and CBC by HPLC
|
Parameter |
ATZ |
CBC |
||||
|
|
Mean |
± SD (n=3) |
RSD |
Mean |
± SD (n=3) |
RSD |
|
Retention time (Rt) |
3.750 |
0.01 |
0.05 |
6.084 |
0.01 |
0.02 |
|
Tailing Factor |
1.327 |
0.02 |
1.83 |
1.206 |
0.02 |
1.43 |
|
Number of theoretical plates |
9511 |
31.88 |
0.47 |
7645 |
51.12 |
0.60 |
|
Resolution (Rs) |
11.18 |
0.01 |
0.07 |
11.18 |
0.01 |
0.07 |
Force Degradation study
Optimized method was found to be stability indicating as it is able to separate all the degradation products in the presence of active ingredient. (Figure 6, Figure 7, Figure 8, Figure 9, Figure 10) No degradation product found to interfere with estimation of ATZ and CBC in stressed samples. Even the stress given found to be optimum as % degradation observed was predictive in nature (below 15%)
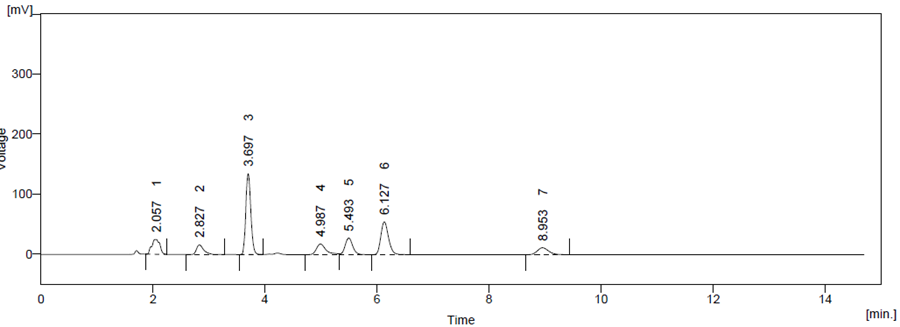
Figure 6 Acid Degradation
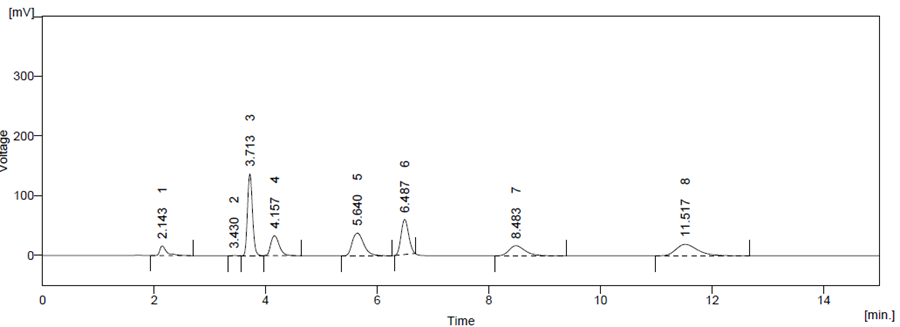
Figure 7 Base Degradation
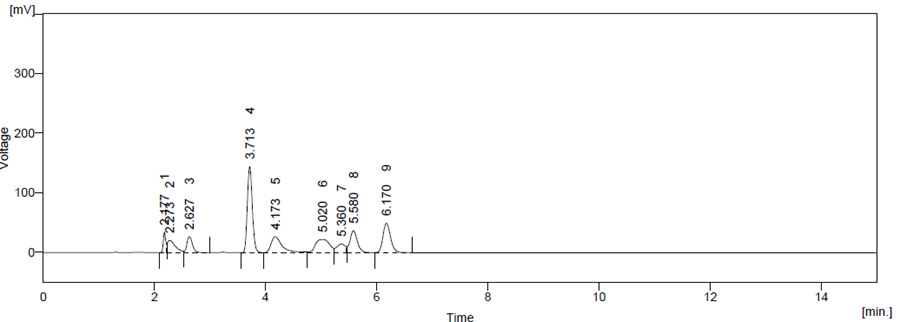
Figure 8 Oxidation Degradation

Figure 9 Photo Degradation
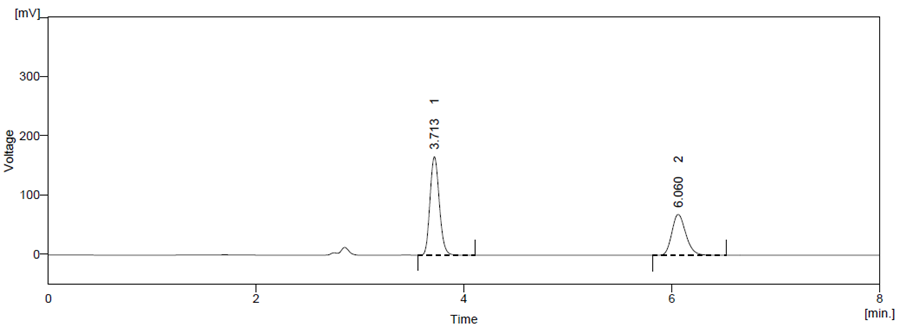
Figure 10 Thermal Degradation
Table 5 Evaluation of Forced Degradation Studies
|
Stress Condition |
Content |
Area |
No. of extra Peaks |
% Degradation |
|
0.1 N HCl |
Std ATZ |
219553 |
5 |
25.53 |
|
Std CBC |
134204 |
3 |
20.24 |
|
|
Sample ATZ CBC |
220148 133896 |
5 |
26.13 19.70 |
|
|
0.1 N NaOH |
Std ATZ |
219098 |
4 |
26.23 |
|
Std CBC |
131489 |
3 |
18.25 |
|
|
Sample ATZ CBC |
220553 129911 |
6 5 |
24.89 15.96 |
|
|
3 H2O2 |
Std ATZ |
219461 |
4 |
21.26 |
|
Std CBC |
133245 |
7 |
18.14 |
|
|
Sample ATZ CBC |
220143 136514 |
1 1 |
22.12 17.65 |
|
|
Photo |
Std ATZ |
219258 |
1 |
21.56 |
|
Std CBC |
133149 |
1 |
12.36 |
|
|
Sample ATZ CBC |
219896 131489 |
2 2 |
20.21 13.96 |
|
|
Thermal |
Std ATZ |
218963 |
1 |
20.36 |
|
Std CBC |
132589 |
1 |
14.14 |
|
|
Sample ATZ CBC |
219865 132589 |
2 2 |
19.56 15.65 |
Method validation
Linearity
The linearity of ATZ and CBC were found between 15-120 μg/ml and 7.5-60 μg/ml respectively. The calibration data is presented in Table 6 and the overlain chromatogram of standard ATZ and CBC chromatogram are presented in Figure 11.
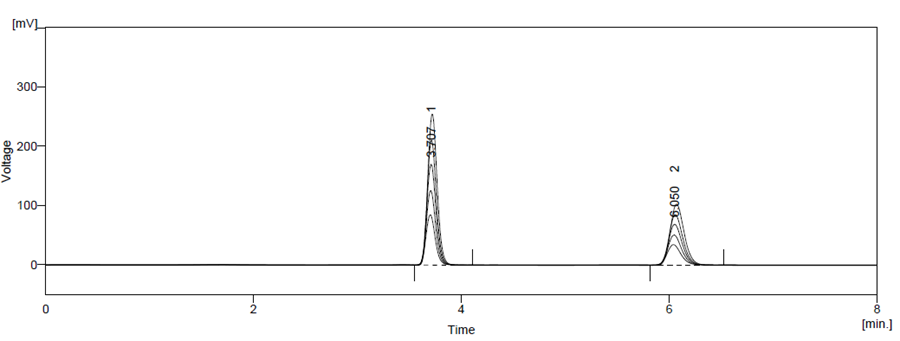
Figure 11 Overlain Chromatogram of Overlain linearity spectra of ATZ (15-120 μg/ml) and CBC (7.5-60 μg/ml)
Precision
The % RSD for repeatability was found is 0.248 for ATZ and 0.609 for CBC. The %RSD for inter-day precision was 0.831-0.940 % for ATZ and 0.553-0.739 % for CBC. The %RSD for inter-day precision was 0.319-0.683 % for ATZ and 0.300-0.349 % for CBC
Recovery studies
The recovery study demonstrated the accuracy of the analytical method for Atazanavir (ATZ) and Cobicistat (CBC). The percentage recovery for ATZ ranged from 99.95% to 100.76%, and for CBC, it ranged from 98.66% to 101.77%, indicating high method accuracy. Recovery was assessed at four levels (0%, 50%, 100%, and 150%) by spiking known amounts of standard into pre-analyzed samples. The mean recovered amounts were consistent with the expected values, and the standard deviations were within acceptable limits, as presented in This confirms that the method is reliable for accurate quantification of both drugs in the given concentration range.
Limit of detection and limit of quantification
The Limit of Detection and Limit of Quantification were established to determine the sensitivity of the analytical method for ATZ and CBC. The LOD for ATZ was found to be 0.045 μg/mL and the LOQ 0.138 μg/mL, while for CBC, the LOD was 0.016 μg/mL and the LOQ 0.050 μg/mL.
Specificity
The analytical method for specificity was evaluated by injecting the following solutions. Diluent was prepared and inject into the HPLC system in triplicate. Sample solution was prepared with appropriate levels of excipients as a placebo sample and inject into the HPLC system in triplicate for all the dosage strengths. Placebo was prepared by mixing all excipients without active ingredients. Standard and sample solutions were prepared for assay (100% Conc.) and inject into the HPLC system in triplicate.
Robustness
The robustness was studied by the slight but deliberate change in parameters such as pH of mobile phase and flow rate. The % RSD of all parameters were found to be within limit, i.e. less than 2%.
Applicability of developed method
The developed analytical method was successfully applied to the evaluation of a commercially available tablet formulation, EVOTAZ, containing 300 mg of Atazanavir (ATZ) and 150 mg of Cobicistat (CBC). The percentage assay results were found to be 99.72 ± 0.449% for ATZ and 100.53 ± 1.12% for CBC. These values are within acceptable limits and closely match the label claims, confirming the method's accuracy and reliability for routine quality control of the marketed product.
Table 6 Method validation parameters for the estimation of ATZ and CBC by HPLC
|
Regression Analysis |
ATZ |
CBC |
|
Concentration Range |
15 -120 μg/ml |
7.5 – 60 μg/ml |
|
Regression equation |
y = 1136.4x + 95263 |
y = 1845.8x + 66446 |
|
Correlation co-efficient |
0.9987 |
0.9987 |
|
LOD (n = 5) (µg/mL) |
0.045 |
0.016 |
|
LOQ (n = 5) (µg/mL) |
0.138 |
0.050 |
Table 7 Accuracy data for ATZ and CBC.
|
Drug |
Level of Recovery |
Amount of Sample (μg/ml) |
Amount of Std. added (μg/ml) |
Amount recovery mean ± (μg/ml) SD* |
% Recovery (n=3) |
|
ATZ |
0 |
30 |
0 |
30.23 ± 0.826 |
100.76 |
|
50 |
30 |
15 |
44.98 ± 0.460 |
99.95 |
|
|
100 |
30 |
30 |
60.21 ± 0.546 |
100.35 |
|
|
150 |
30 |
60 |
89.98 ± 1.025 |
99.97 |
|
|
CBC |
0 |
15 |
0 |
15.2 ± 0.185 |
101.33 |
|
50 |
15 |
7.5 |
22.9 ± 1.050 |
101.77 |
|
|
100 |
15 |
15 |
29.6 ± 0.766 |
98.66 |
|
|
150 |
15 |
30 |
45.09 ± 0.849 |
100.2 |
CONCLUSION
A robust, simple, and selective RP-HPLC method was developed and validated for the simultaneous estimation of Atazanavir and Cobicistat in tablet dosage form using a Design of Experiments approach. Optimization was performed using Central Composite Design, with flow rate, pH, and injection volume identified as significant factors. The method showed excellent linearity, accuracy (99.95–101.77%), precision, and robustness. LOD/LOQ were 0.045/0.138 μg/mL for ATZ and 0.016/0.050 μg/mL for CBC. Retention times were 3.750 and 6.084 min. The method is suitable for routine quality control and stability studies, as per ICH Q2(R1) guidelines.
REFERENCES

Hetal Pateliya*, Dhirendra Kumar Tarai, Khyati Bhupta, Dr. Santosh Kirtane, Development and Validation of Stability Indicating RP-HPLC Method For the Simultaneous Estimation of Atazanavir and Cobicistat with Doe Approach in Their Tablet Dosage From, Int. J. of Pharm. Sci., 2025, Vol 3, Issue 6, 611-626. https://doi.org/10.5281/zenodo.15592597
 10.5281/zenodo.15592597
