School of Pharmacy, Maharaja Agrasen University, Baddi, Solan, H.P.
Ornidazole, a nitroimidazole derivative used for protozoal and anaerobic infections, suffers from poor aqueous solubility and low oral bioavailability, limiting its therapeutic effectiveness. To overcome these challenges, an Ornidazole nanosuspension was developed and characterized to enhance solubility, dissolution, and patient compliance. Pre-formulation studies confirmed identity and purity, with a melting point of 81.8 ± 0.475 °C, UV ?max at 310 nm, and log P of 1.6, indicating moderate lipophilicity. Solubility profiling revealed high solubility in methanol (49.132 mg/mL) but limited solubility in water (0.689 mg/mL), underscoring the need for formulation intervention. Ten nanosuspension formulations (F1–F10) were prepared by antisolvent precipitation using soya lecithin as stabilizer. All batches produced homogeneous dispersions with pH values between 5.0 and 6.6. Saturation solubility studies demonstrated significant enhancement, with the optimized batch F7 achieving 4.2571 mg/mL compared to 0.2508 mg/mL for pure drug. Additional evaluations showed F7 had the highest percentage yield (87.91%), drug content (87.25%), viscosity (3.675 cP), and favourable micromeritic properties. Particle size analysis confirmed a hydrodynamic diameter of 211.1 nm with polydispersity index 26.7%, while zeta potential (?36.9 mV) indicated excellent colloidal stability. In vitro dissolution studies revealed rapid and extensive release from F7, reaching 96.18% at 60 minutes versus 23.80% for pure Ornidazole. Kinetic modeling showed drug release followed first-order kinetics (R² = 0.9823), consistent with anomalous non-Fickian diffusion mechanisms. These findings demonstrate that nanosuspension is an effective strategy for improving solubility, dissolution, and bioavailability of poorly soluble drugs. The optimized Ornidazole nanosuspension (F7) offers promising potential as a patient-friendly oral dosage form for paediatric and adult populations, combining enhanced therapeutic efficiency with improved stability.
Oral drug delivery has long been recognized as the most convenient, widely accepted, and patient-friendly route of drug administration. It offers several advantages, including ease of administration, non-invasiveness, cost-effectiveness, and the potential for improved patient compliance. More than 60% of marketed pharmaceutical products are formulated for oral delivery, demonstrating the dominance of this route in modern therapeutics. Despite its popularity, the oral administration of drugs is associated with a variety of challenges, particularly in relation to the physicochemical properties of active pharmaceutical ingredients (APIs), gastrointestinal (GI) physiology, and the formulation’s ability to ensure adequate bioavailability. For a drug to achieve therapeutic efficacy via the oral route, it must undergo several crucial steps: dissolution in gastrointestinal fluids, permeation across the intestinal epithelium, and subsequent transport into systemic circulation. Any inefficiency in these steps can significantly limit the drug’s bioavailability. A large proportion of new chemical entities (NCEs) identified through drug discovery pipelines belong to the Biopharmaceutical Classification System (BCS) Class II or IV, characterized by low solubility and/or poor permeability. As a result, improving solubility and absorption has become a central focus of pharmaceutical formulation science [1].
In addition to solubility concerns, physiological barriers within the gastrointestinal tract further complicate oral delivery. Variations in pH, enzymatic degradation, first-pass metabolism in the liver, and the presence of efflux transporters such as P-glycoprotein can drastically reduce the effective concentration of a drug reaching systemic circulation. Moreover, patient-related factors, such as dysphagia (difficulty in swallowing), add another dimension to the problem. Dysphagia is common among paediatric and geriatric populations, as well as patients with neurological disorders or chronic illnesses. Conventional solid dosage forms like tablets and capsules may therefore not be suitable for these groups, necessitating the development of more versatile and patient-friendly alternatives [2].
To overcome these limitations, several formulation strategies have been developed to enhance drug solubility, dissolution, and bioavailability. These include particle size reduction, solid dispersions, lipid-based delivery systems, and the incorporation of solubilizers or surfactants. Each of these approaches offers specific advantages, but they are not universally applicable across all drug classes. Among these strategies, nanosuspension technology has emerged as one of the most promising solutions for poorly water-soluble drugs. Nanosuspensions are submicron colloidal dispersions of pure drug particles, stabilized with surfactants or polymers, with particle sizes typically below 1 µm. By reducing particle size to the nanometer scale, nanosuspensions significantly increase surface area and saturation solubility, thereby accelerating dissolution and improving bioavailability [3]. This phenomenon is well explained by the Noyes–Whitney and Ostwald–Freundlich equations, which highlight how smaller particles enhance dissolution kinetics and solubility through increased dissolution pressure. Additionally, nanosuspensions can alter the crystalline state of a drug, with amorphous fractions displaying higher solubility compared to crystalline counterparts. The advantages of nanosuspensions extend beyond solubility enhancement. They offer versatility in administration, as they can be delivered orally, intravenously, ocularly, dermally, or via pulmonary routes. This flexibility makes them particularly attractive for drugs with poor aqueous solubility or those requiring site-specific delivery. Moreover, nanosuspensions enable dose reduction while maintaining therapeutic efficacy, minimize food-related variability in absorption, and offer opportunities for controlled or sustained release formulations [4]. From a patient perspective, nanosuspensions can mask unpleasant tastes, improve ease of administration, and enhance compliance—features that are especially beneficial for vulnerable populations such as children and the elderly. Several successful case studies have demonstrated the potential of nanosuspension technology in clinical practice. For example, nanosized formulations of fenofibrate, itraconazole, danazol, and paclitaxel have shown remarkable improvements in dissolution rates, oral absorption, and therapeutic outcomes compared to their conventional formulations. Likewise, nanosuspensions of antibiotics, antifungal agents, and anticancer drugs have been developed to address critical limitations in bioavailability and solubility. These examples validate the applicability of nanosuspensions in improving treatment outcomes across diverse therapeutic classes [5].
However, the development of nanosuspension systems is not without challenges. The physical stability of nanoparticles must be carefully maintained to prevent aggregation, crystal growth (Ostwald ripening), or chemical degradation. Stabilizers such as surfactants and polymers are essential for maintaining dispersion stability and ensuring reproducibility. The choice of preparation method—such as high-pressure homogenization, media milling, or precipitation techniques—also influences particle size, stability, and scalability of production. Post-production processing, including spray drying or lyophilization, is often required to transform liquid nanosuspensions into stable solid dosage forms without compromising drug performance [6].
Despite these limitations, nanosuspensions continue to attract significant attention due to their ability to provide solutions where conventional approaches fail. Regulatory agencies have also shown growing acceptance of nanosuspension-based formulations, acknowledging their potential to address the persistent problem of poor solubility and bioavailability in drug development. Furthermore, advances in nanotechnology and material science are continuously refining nanosuspension preparation techniques, stabilizer selection, and large-scale manufacturing processes, paving the way for their broader clinical adoption [7]. In light of these considerations, nanosuspension technology offers a transformative platform for the formulation of poorly soluble drugs. By addressing the critical challenges associated with oral drug delivery—namely solubility, dissolution, permeability, and patient compliance—nanosuspensions represent a significant step forward in pharmaceutical innovation. Their adaptability across multiple administration routes, ability to improve therapeutic efficacy, and potential to enhance patient outcomes underscore their importance in modern drug delivery research [8].
The present research focuses on the development and characterization of an Ornidazole nanosuspension as a novel approach to improve solubility, dissolution, and bioavailability. Ornidazole, a nitroimidazole derivative, is widely used for the treatment of protozoal infections and anaerobic bacterial infections. Despite its clinical relevance, Ornidazole suffers from poor aqueous solubility, limiting its absorption and therapeutic effectiveness [9]. Conventional oral formulations often fail to deliver adequate systemic levels, especially in patients requiring rapid onset of action or long-term therapy. Incorporating Ornidazole into a nanosuspension system provides an opportunity to overcome these limitations, offering improved dissolution, enhanced bioavailability, and better patient compliance. Therefore, this work seeks to investigate the potential of nanosuspension-based formulation strategies for Ornidazole, with the goal of enhancing its solubility and therapeutic efficacy [10-12]. The study encompasses formulation development, optimization, characterization, and evaluation of nanosuspension systems. Through this research, an attempt is made to contribute to the broader field of oral drug delivery technologies by demonstrating how nanosuspensions can be employed as a practical solution for the formulation of poorly soluble drugs.
2. MATERIALS AND METHODS
2.1 Materials and Instrument used in study
2.1.1 Materials
All chemicals and reagents used in this study were of analytical grade and utilized as received without further purification. Double-distilled water was used throughout the experimental work [13-15].
2.1.2 Instruments
Table 1. Instruments used in the study
|
Sr. No. |
Instrument |
Manufacturer |
|
1 |
UV–Visible Spectrophotometer |
Shimadzu, Japan |
|
2 |
Analytical Weighing Balance (CY220) |
Shimadzu, Japan |
|
3 |
Magnetic Stirrer |
Torsons, Spinot |
|
4 |
Vortex Mixer (SLM-VM-3000) |
Remi, Bangalore |
|
5 |
Microscope |
Biolux-CTX(2), Kyowa |
|
6 |
Digital pH Meter |
Ohaus, USA |
|
7 |
Melting Point Apparatus |
Remi Equipment, Mumbai |
|
8 |
FTIR Spectrophotometer |
Perkin Elmer, Chandigarh |
|
9 |
Dissolution Apparatus (USP-II) |
Lab India, Chandigarh |
2.2 Pre-formulation Study
Pre-formulation studies were carried out to characterize the physicochemical properties of Ornidazole, which directly influence the formulation design and performance of nanosuspension systems [16-19].
2.2.1 Organoleptic Characteristics
The drug sample was evaluated visually for its appearance, color, and odor to establish primary identity.
2.2.2 Melting Point Determination
The melting point was determined using a melting point apparatus. A small amount of Ornidazole was placed in a capillary tube sealed at one end. The capillary was attached to a thermometer and heated gradually, and the temperature at which the drug transitioned from solid to liquid was recorded.
2.2.3 UV Absorption Maximum (λmax)
The λmax of Ornidazole was determined using a double-beam UV-Visible spectrophotometer. A 25 µg/mL solution of Ornidazole in methanol was scanned within 200–400 nm, and the absorption maximum was recorded at 310 nm.
2.2.4 Estimation of Ornidazole by UV–Vis Spectrophotometry
A calibration curve was prepared by dissolving 10 mg of Ornidazole in 100 mL methanol to obtain a stock solution (100 µg/mL). From this, dilutions ranging from 5–25 µg/mL were prepared, and absorbance was measured at 310 nm. A standard calibration curve was plotted to determine slope, intercept, and correlation coefficient.
2.2.5 Solubility Studies
Solubility of Ornidazole was determined in various solvents (ethanol, methanol, DMSO, DMF, ethyl acetate, and water) using the shake-flask method. Excess drug (150 mg) was added to 10 mL of each solvent, vortexed, and agitated at room temperature for 24 h in a water-bath shaker. The solutions were centrifuged at 15,000 rpm for 15 min, filtered, and analyzed spectrophotometrically after appropriate dilution [20].
2.2.6 Partition Coefficient Determination
The lipophilicity of Ornidazole was determined by shake-flask method using n-octanol and water as solvents. Ten milligrams of Ornidazole were dissolved in 10 mL of n-octanol–water (1:1) mixture and shaken for 24 h. The phases were separated, centrifuged, and analyzed spectrophotometrically to calculate the partition coefficient (P = Cn-octanol / Cwater).
2.2.7 FTIR Analysis of Drug and Excipients
Drug-excipient compatibility was assessed using FTIR spectroscopy. FTIR spectra of Ornidazole and physical mixtures with soya lecithin were recorded between 4000–400 cm?¹ to evaluate possible interactions.
2.3 Preparation of Nanosuspensions
Ten different formulations (F1–F10) were prepared using high-shear homogenization followed by probe sonication. Drug-to-stabilizer ratios and homogenization parameters were optimized. Each batch was evaluated for appearance, pH, and preliminary solubility. The nanosuspension was formulated using the antisolvent precipitation method. Nanosuspensions were prepared by nanoprecipitation technique.
Formulation batches (F1–F6 and F7–F10) were designed using different ratios of drug, lecithin, and methanol volumes (Tables 2 and 3).
Table 2. Formulation design with varying lecithin concentration (F1–F6)
|
Formulation |
Drug (mg) |
Soya lecithin (% w/v) |
Methanol (mL) |
|
F1 |
500 |
0.5 |
10 |
|
F2 |
500 |
1.0 |
10 |
|
F3 |
500 |
1.5 |
10 |
|
F4 |
500 |
2.0 |
10 |
|
F5 |
500 |
2.5 |
10 |
|
F6 |
500 |
3.0 |
10 |
Table 3. Formulation design with varying methanol volumes (F7–F10)
|
Formulation |
Drug (mg) |
Soya lecithin (% w/v) |
Methanol (mL) |
|
F7 |
500 |
2.0 |
5 |
|
F8 |
500 |
2.0 |
15 |
|
F9 |
500 |
2.0 |
20 |
|
F10 |
500 |
2.0 |
25 |
2.4 Evaluation of Nanosuspensions
2.4.1 Visual Appearance and pH
Formulations were visually inspected for color, uniformity, and clarity. pH was determined using a digital pH meter.
2.4.2 Saturation Solubility
Solubility of pure Ornidazole and nanosuspension formulations was evaluated by shake-flask method in distilled water at 25 °C. Samples were filtered (0.22 µm), diluted, and analyzed at 310 nm using UV spectrophotometer [21].
2.4.3 Viscosity
Viscosity was measured using a Brookfield viscometer with spindle L-4 at 50 rpm. Measurements were made in triplicate.
2.4.4 Freeze Drying of Nanosuspensions
To improve stability, nanosuspensions were lyophilized using 0.5% w/v mannitol as cryoprotectant. Samples were frozen at −70 °C for 3 h and subjected to lyophilization at −30 °C for 24 h. Freeze-dried nanosuspension powders were stored in glass vials.
2.5 Evaluation of Freeze-Dried Nanosuspension Powder
2.5.1 Visual Appearance and Optical Microscopy
Powders were inspected visually and under optical microscopy for uniformity and particle aggregation.
2.5.2 Percentage Yield
The percentage yield was calculated as:
Percentage yield = Experimental Yield X 100
Theoretical yield
a. Angle of repose (flowability) determined by funnel method. It is described as the largest angle that can be formed between a powder pile's surface and the horizontal. The funnel method was used to determine the blend's angle of repose. A carefully measured powder mixture was poured into the funnel. The funnel's height was adjusted such that its tip just touched the top of the powder mixture. The powder mixture was permitted to flow freely through the funnel and onto the surface.
The powder cone's diameter was measured, and the following equation was used to the angle of repose.
θ = tan-1 (h/r)
Where: θ = angle of repose, h = height in cm, r = radius in cm.
b. Bulk and tapped density measured in a graduated cylinder. Blended powder is weighed out and put into a 100 ml measuring cylinder. Without moving the cylinder, the powder's volume was measured, and the following equation can be used to calculate bulk density:
Bulk Density (BD)=Mass of blendVolume of blend
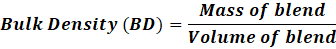
Blended powder is weighed out and put into a 100 ml measuring cylinder. After that, until the mix powder bed volume reaches the minimum level, the cylinder is tapped a predetermined number of times (about 100 times). The final volume is measured, and the tapped density is determined using the equation below:
Tapped Density (TD)=Mass of blendVolume of blend after tapping
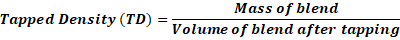
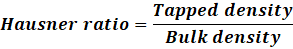
c. Hausner’s ratio and Carr’s index calculated to assess compressibility. Hausner ratio of the blend was found out by using the following formula:
Hausner ratio=Tapped densityBulk density
2.5.4 Percentage Drug Content
Freeze-dried powders (500 mg) were dissolved in methanol and assayed at 310 nm by UV spectrophotometry in triplicate [22].
2.5.5 Particle Size and Zeta Potential
Measured by photon correlation spectroscopy (PCS) and electrophoretic mobility using a Zetasizer Nano after dilution [24].
2.5.6 Fourier Transform Infrared Spectroscopy (FTIR)
FTIR spectra were recorded for optimized formulation to assess compatibility between Ornidazole and excipients [25].
2.5.7 Scanning Electron Microscopy (SEM)
Particle morphology and surface characteristics were analyzed using SEM after gold–palladium coating [26].
2.5.8 In vitro Dissolution Study
Dissolution studies were performed using USP type II apparatus (paddle method). Test medium: 900 mL of 0.1 N HCl at 37 ± 0.5 °C, paddle speed 100 rpm. Samples (5 mL) were withdrawn at 5, 10, 15, 20, 25, and 30 min, filtered, and analyzed at 310 nm. An equal volume of fresh dissolution medium was replaced each time. Experiments were conducted in triplicate [27-30].
2.5.9 Drug Release Kinetics
In vitro release data were fitted to mathematical models:
The best-fit model was determined based on regression coefficient (R²) values, to elucidate release mechanism.
3. RESULTS AND DISCUSSION
3.1 Pre-formulation Studies
3.1.1 Organoleptic Properties
The organoleptic evaluation of Ornidazole revealed key physical characteristics essential for preliminary identification and quality control. The drug was found to be white, odorless, and in powder form, aligning with pharmacopeial standards (Table 4).
Table 4: Organoleptic properties of Ornidazole
|
Property |
Observation |
|
Colour |
White |
|
Odour |
Odourless |
|
Form |
Powder |
3.1.2 Melting Point
The melting point of Ornidazole, determined by capillary method, was found to be 81.8 ± 0.475 °C, consistent with reported values, confirming purity of the drug (Table 5).
Table 5: Melting point of Ornidazole
|
Parameter |
Value (± SD) |
|
Melting point |
81.8 ± 0.475 °C |
3.1.3 UV Spectroscopy
3.1.3.1 Absorption Maximum
The absorption maximum (λmax) of Ornidazole in methanol was found to be 310 nm (Figure 1).
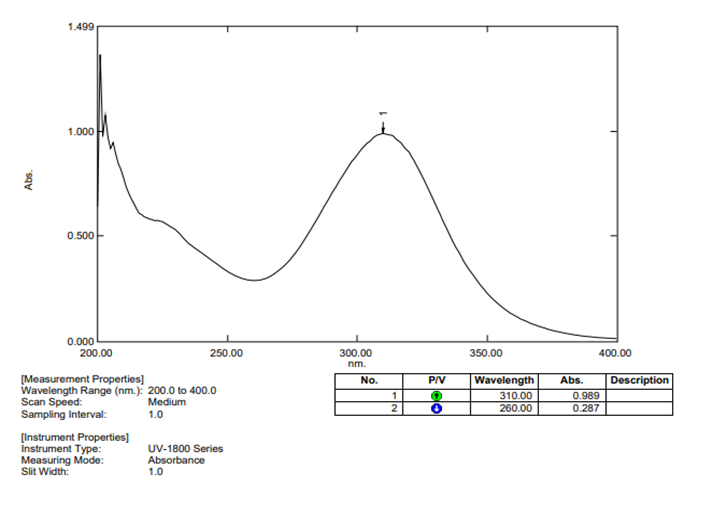
Figure 1: UV Spectrum of Ornidazole in Methanol
3.1.3.2 Calibration Curve
A standard curve was prepared in the concentration range 5–25 µg/mL. The regression equation obtained was Y = 0.0385x + 0.0291 with R² = 0.997, indicating excellent linearity (Table 6, Figure 2).
Table 6: Calibration curve of Ornidazole in methanol (λmax = 310 nm)
|
Concentration (µg/mL) |
Absorbance (mean) |
|
5 |
0.242 |
|
10 |
0.428 |
|
15 |
0.616 |
|
20 |
0.798 |
|
25 |
0.989 |
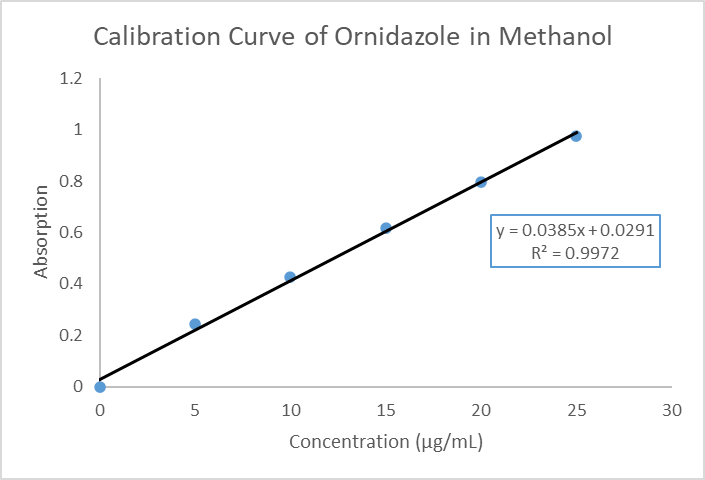
Figure 2: Standard calibration curve of Ornidazole in Methanol
3.1.4 Solubility Studies
Ornidazole showed highest solubility in methanol (49.132 mg/mL) and ethanol (45.847 mg/mL), while it was least soluble in water (0.689 mg/mL). This highlights its poor aqueous solubility (Table 7, Figure 3).
Table 7: Solubility studies of Ornidazole in different solvents
|
Solvent |
Solubility (mg/mL) |
|
Methanol |
49.132 |
|
Water |
0.689 |
|
Dimethylformamide |
23.594 |
|
DMSO |
24.804 |
|
Ethanol |
45.847 |
|
Ethyl acetate |
11.210 |
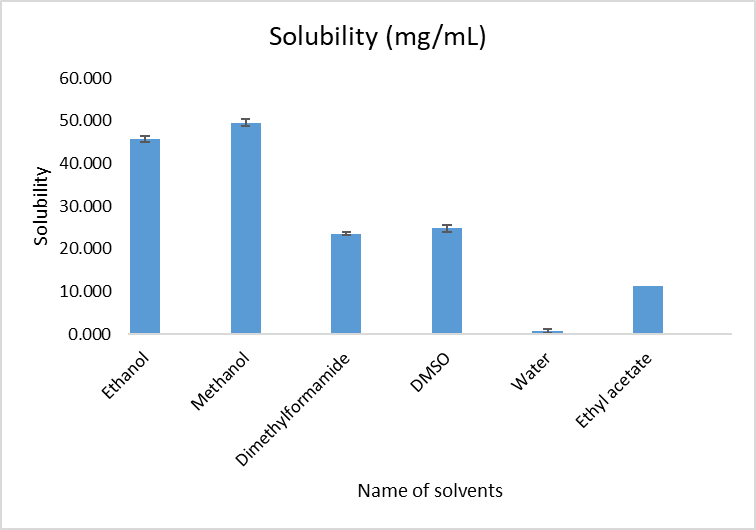
Figure 3: Solubility of Ornidazole in different solvents
3.1.5 Partition Coefficient
Partition coefficient (n-octanol/water) of Ornidazole was found to be log P = 1.6 ± 0.009, confirming moderate lipophilicity.
3.2 Evaluation of Formulations (F1–F10)
3.2.1 Appearance and pH
All formulations appeared yellowish, homogeneous, with no phase separation. pH values ranged between 5.0 (F8) and 6.6 (F4) (Table 8).
Table 8: Appearance and pH of formulations (F1–F10)
|
Formulation |
Appearance |
pH (mean) |
|
F1 |
Yellowish solution |
6.2 |
|
F2 |
Yellowish solution |
6.4 |
|
F3 |
Yellowish solution |
6.5 |
|
F4 |
Yellowish solution |
6.6 |
|
F5 |
Yellowish solution |
6.1 |
|
F6 |
Yellowish solution |
5.5 |
|
F7 |
Yellowish solution |
5.7 |
|
F8 |
Yellowish solution |
5.0 |
|
F9 |
Yellowish solution |
6.0 |
|
F10 |
Yellowish solution |
6.3 |
3.2.2 Saturation Solubility
Nanosuspensions improved solubility significantly compared to pure drug (0.2508 mg/ml). F7 showed the highest solubility (4.2571 mg/ml).
3.2.3 Viscosity
Viscosity values ranged from 0.955 cP (F3) to 3.675 cP (F7). Increased viscosity correlates with improved stability.
3.2.4 Percent Yield
Percentage yield varied from 63.62% (F1) to 87.91% (F7), confirming efficient recovery.
3.2.5 Micromeritic Properties
Powder characteristics (angle of repose, bulk density, tapped density, Hausner’s ratio, Carr’s index) indicated acceptable flowability and compressibility across all formulations.
3.2.6 Drug Content
Drug content ranged from 44.48% (F1) to 87.25% (F7), showing effective entrapment in optimized batch.
3.3 Optimized Formulation (F7)
3.3.1 Particle Size & Zeta Potential
F7 showed a mean hydrodynamic diameter of 211.1 nm with PDI = 26.7%. Zeta potential was -36.9 mV, indicating strong colloidal stability.
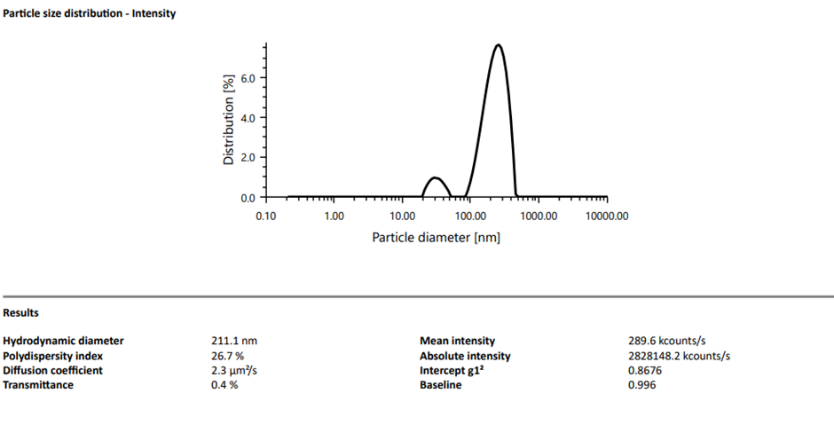
Figure 4: Particle size of Formulation F7
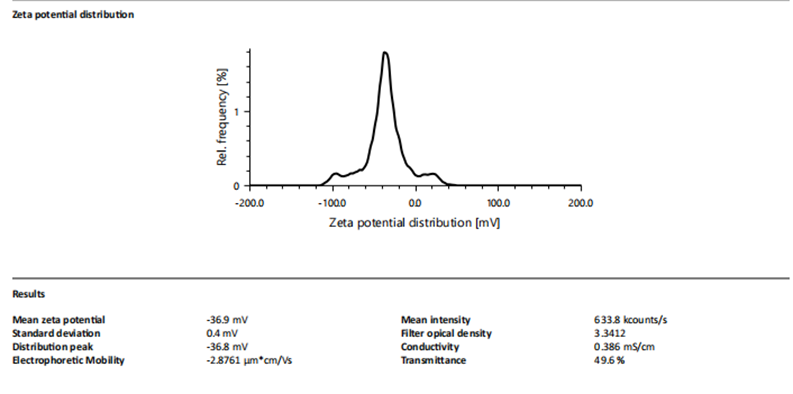
Figure 5: Zeta potential of Formulation F7
3.3.2 In-vitro Dissolution Study
F7 exhibited a marked enhancement in dissolution compared to pure drug. At 60 minutes, F7 released 96.18% of drug, whereas pure Ornidazole released only 23.80% (Table 9, Figure 8).
Table 9: Dissolution profile of F7 vs pure drug
|
Time (min) |
% In vitro Release (F7) |
% In vitro Release (Pure drug) |
|
5 |
22.63 |
3.61 |
|
10 |
44.75 |
6.86 |
|
15 |
57.78 |
9.94 |
|
20 |
74.92 |
15.87 |
|
40 |
90.46 |
19.29 |
|
60 |
96.18 |
23.80 |
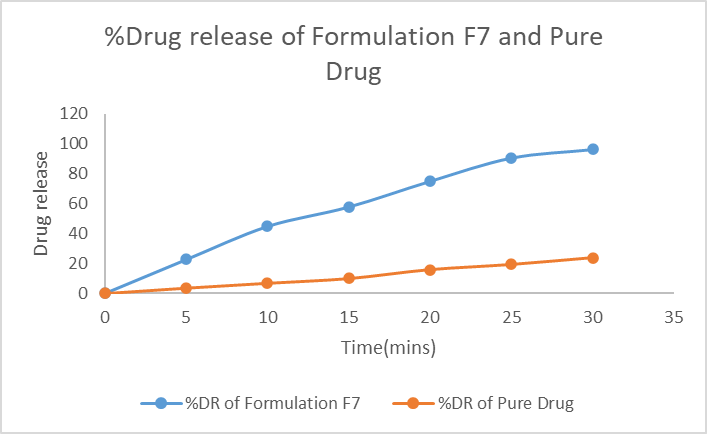
Figure 6: Dissolution profile of F7 vs Pure Ornidazole
3.4 Drug Release Kinetics
Release data for F7 was fitted to various kinetic models:
Zero-order: The zero-order plot of cumulative % drug release versus time showed a high correlation coefficient (R² = 0.976), indicating a nearly constant release rate throughout the dissolution period.
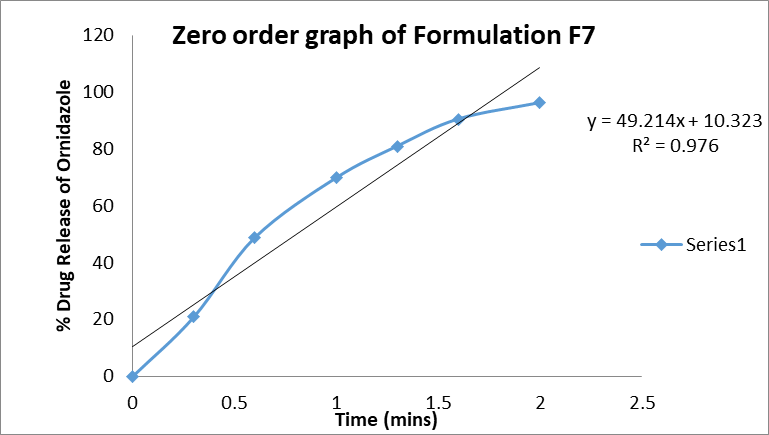
Figure 7: Zero order graph of formulation F7
First-order: The first-order plot of log % drug remaining versus time produced the highest correlation coefficient (R² = 0.9823), suggesting that the dissolution process was primarily concentration-dependent. This indicates that the release rate decreased proportionally with the reduction of drug concentration in the formulation.
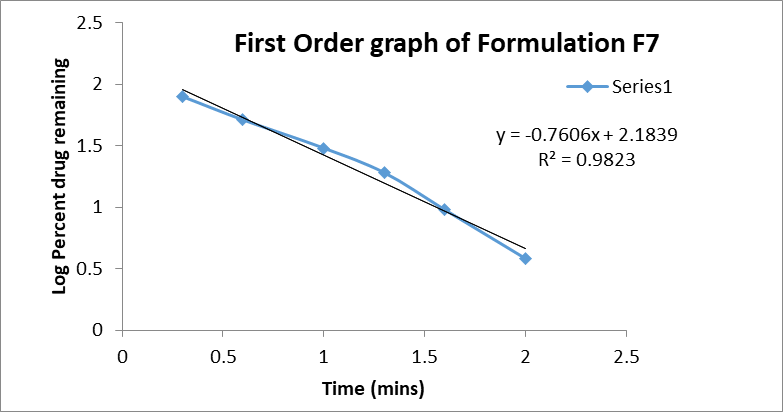
Figure 8: First order graph of formulation F7
a. Higuchi: The Higuchi model plot of cumulative % drug release versus square root of time gave an R² value of 0.9088, confirming that the release mechanism was largely diffusion-controlled. This implies that the nanosuspension matrix allows drug diffusion into the dissolution medium in a manner proportional to the square root of time.
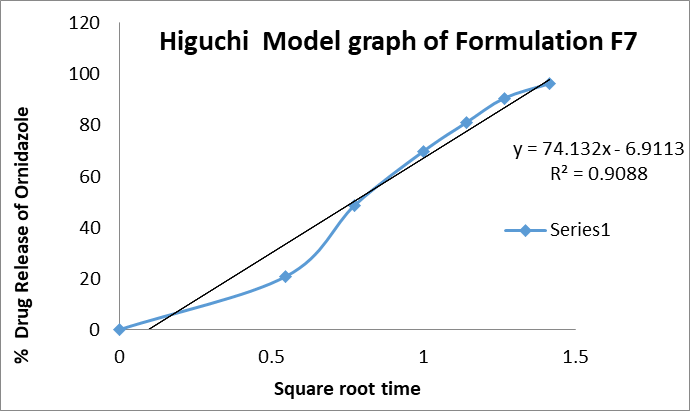
Figure 9: Higuchi graph of formulation F7
b. Korsmeyer-Peppas: The Korsmeyer–Peppas model yielded an n value of 0.8035 with an R² of 0.8559, indicating a non-fickian (anomalous) transport mechanism. This suggests that the drug release from the nanosuspension was governed by a combination of diffusion through the hydrated matrix and erosion/relaxation of the polymeric stabilizer layer.
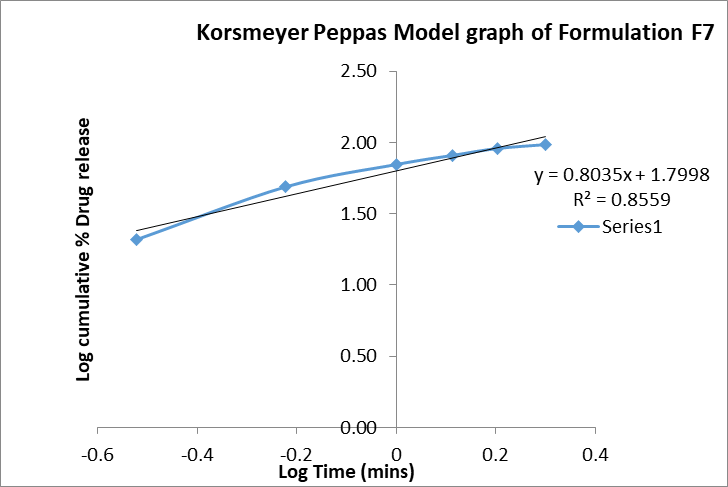
Figure 10: Korsmeyer peppas graph of formulation F7
This indicates that drug release followed first-order kinetics with an anomalous non-Fickian diffusion mechanism.
CONCLUSION
The results demonstrate that nanosuspension formulation substantially improved the solubility and dissolution of Ornidazole. Among all formulations, F7 was identified as the optimized batch, showing highest solubility, drug content, yield, and superior dissolution profile. Release kinetics confirmed that the mechanism was primarily first-order, governed by a combination of diffusion and erosion.
REFERENCES


Khushal Mittal, Rishu Yadav, Pankaj Bhateja, Mona Piplani, Development and Characterization of Ornidazole Nanosuspension for Enhanced Solubility and Bioavailability in Pediatric and Adult Formulations, Int. J. of Pharm. Sci., 2025, Vol 3, Issue 9, 687-701. https://doi.org/10.5281/zenodo.17064200
 10.5281/zenodo.17064200
