A. R. College of Pharmacy & G. H. Patel Institute of Pharmacy, Vallabh Vidyanagar
Methylprednisolone is a medication for the management and treatment of allergic conditions, arthritis, asthma exacerbations, long term asthma maintenance and as an anti-inflammatory and immunosuppressive agent. A systematic DoE approach was utilized for the development and validation of a Stability indicating GREEN-HPTLC method for estimation of Methylprednisolone in bulk and formulation. The Box-Behnken design was utilized for the optimization of chromatographic conditions in HPTLC. ANOVA results and Contour plot indicates that Glacial acetic acid and Cyclohexane had more impact than Ethyl acetate on retardation factor. The method utilized aluminium HPTLC plate precoated with silica gel G60 F254 as a stationary phase along with Ethyl acetate: Cyclohexane: Glacial acetic acid (7.9: 1.9: 0.2 v/v/v) as a mobile phase. The retardation factor was found to be 0.50. The densitometric analysis was carried out on the absorbance mode 243 nm. The linearity was found to be in the range of 200-1200 ng/band with a correlation coefficient 0.995. The detection and quantification limit were found to be 1.794 and 5.436 ng/band. No interference was observed from excipients and mobile phase solvents in the formulation, indicating specificity of the method. The proposed method was validated as per ICH Q2 (R1) guidelines. Forced degradation study was carried out using acidic, basic, oxidative, thermal and photolytic condition. HPTLC method was found to be simple, accurate, and precise according to acceptance criteria given in ICH guidelines. The results indicate that the DoE approach is effectively applied to optimize the retardation factor, and the method is appropriate for routine laboratory analysis.
1.1 Introduction to Analytical Chemistry
The branch of chemistry known as analytical chemistry is said to be responsible for describing the composition of matter, both qualitatively (what's there) and quantitatively (how much is present) [1].
1.2 Introduction to Analytical Method Development
Analytical method development and validation plays an important role in the discovery, development, and manufacture of pharmaceuticals. Method development is defined as development, revision of the validated, standardized, and official method of analysis [2].
1.3 Introduction to Chromatography
Chromatography is a method used for the separation of the components of a sample, in which the components are distributed between two phases, one of which is stationary phase while the other is mobile phase. The stationary phase may be a solid or a liquid supported on a solid or a gel, and may be packed in column, spread as a layer or distributed as a film. The mobile phase may be gaseous or liquid. High Performance Thin Layer Chromatography: As HPTLC uses smaller particles and has a 100 µm thicker sorbent layer than TLC, its efficiency is much higher. It is a separation technique that breaks down the mixture into its constituent parts with the assistance of the stationary phase and mobile phase. HPTLC can be used to identify chemicals, determine their purity, and identify the components in a mixture [3-9].
1.4 Introduction to Analytical Method Validation
As per the ICH Q2 (R1)20 guidelines, the objective of validation of an analytical procedure is to demonstrate that it is suitable for its intended purpose. Typical validation characteristics which should be considered are - Specificity, Accuracy, Precision (Repeatability, Intermediate Precision, Reproducibility), Linearity, Range, Limit of Detection, Limit of Quantitation and Robustness [10-13].
1.5 Design of Experiment (DOE)
Design of Experiment (DoE) is part of AQbD used for optimization of the method. By using DoE different factors during method development & their interactions are assessed with maximum efficiency. The effects of these factors are mostly measured at varying levels & results can be applied to a broad range of conditions [14-16].
1.6 Introduction to Stability Study
The term "Drug Stability" refers to "the extent to which a drug substance or product retains, within specified limits throughout its period of storage and use, the same properties and characteristics that is possessed at the time of its manufacture [7, 8]. Performed stressed degradation studies through the effects of acid, base, H2O2, light and thermal conditions [9-12].
1.7 Introduction to Green TLC/HPTLC Method
Nowadays pharmaceutical analysis of medicines presupposes the use of chemical substances, solvents and reagents, which, of course, have a negative impact on both the laboratory personnel and the environment. An important issue of choosing a solvent is the assessment of its environmental friendliness. Water, Ethyl acetate, Ethanol, n-butanol, n-butyl acetate, Ethylene Glycol etc., are the green solvents that can be used as a solvent in TLC.
1.8 Drug Profile
Methylprednisolone belongs to the category of corticosteroids, used to reduce inflammation in many conditions. These include endocrine diseases, severe allergies, ulcerative colitis, and multiple sclerosis. It’s also used to treat rheumatic diseases, such as rheumatoid arthritis and osteoarthritis. Methylprednisolone belongs to a class of drugs called glucocorticoids. Methylprednisolone works by decreasing inflammation and changing your body’s immune response [17-21].
Methylprednisolone was obtained from reputed pharmaceutical industry, Gujarat, India. The AR grade of solvents like Methanol, Ethyl acetate, Glacial acetic acid and cyclohexane obtained from LOBA chemicals, Mumbai, Maharashtra. Medrol tablet was purchased from local market and each tablet of Medrol contains 4 mg of Methylprednisolone.
The samples were applied in the form of a band of width 6 mm with a Hamilton 100 μL sample syringe using Camag Linomat 5 (CAMAG, Switzerland) sample applicator on precoated silica gel aluminum plate 60 F254 (10 cm x 10 cm with 0.2 mm thickness, Merck, Germany). Camag TLC scanner was used for the densitometric scanning of the developed chromatogram. HPTLC system was controlled using Camag winCATS software, Version 1.4.8.
10 mg of Methylprednisolone was accurately weighed and was transformed into a 10 ml clean, dried volumetric flask, the volume was made up to the mark with methanol to obtain a concentration of 1000 μg/ml Methylprednisolone. 1ml of Methylprednisolone standard stock solution (1000 µg/ml) was transferred to 10ml volumetric flask and the volume was made up to the mark with methanol to obtain concentration of 100 µg/ml Methylprednisolone.
Application of standard and sample solution of Methylprednisolone was done on TLC plate in form of narrow bands of 6 mm length, 15 mm of bottom and left edge, with 10 mm distance between two bands. Along with this, sample continues observed dry stream of nitrogen gas.
Plates were developed using a mobile phase contain ethyl acetate: cyclohexane: glacial acetic acid (8:2:0.2 v/v/v). Linear ascending preparation was carried out in a twin-trough glass chamber saturated with the mobile phase vapors for 20 min at 25 ± 2ºC. 10 mL of the mobile phase (5 mL in the trough containing the plate and 5 mL in the other trough) was used for each development and was allowed to migrate at distance of 70 mm. After development, the HPTLC plates were dried with hair drier.
Densitometry scanning was performed in the absorbance mode under control by winCATS planar chromatography 1.4.8 software. Deuterium lamp was source of radiation, and bands were scanned at 243 nm. The slit dimensions were 4 mm length and 0.30 mm width, with a scanning rate of 20 mm/s. Concentrations of the compound chromatographed were determined from the intensity of diffusely reflected light and evaluated as peak areas against concentrations using a linear regression equation (Figure 1).
Validation of the developed HPTLC method was carried out according to International Council for Harmonization (ICH) of Technical Requirements for Pharmaceuticals for Human Use guidelines Q2 (R1) for the specificity, sensitivity, accuracy, precision, repeatability and robustness.
The specificity of the method was established by analyzing Perindopril erbumine, Indapamide and Amlodipine besylate in presence of excipients in marketed tablet formulation. The band of Methylprednisolone were confirmed by comparing Rf values, area and respective spectra of sample with those of standards.
Linearity of the method was evaluated by constructing curves at seven concentration levels over a range of 200– 1200 ng/band for Methylprednisolone from stock solution have been applied on pre coated TLC plate using sample applicator. The calibration curves were developed by plotting peak area versus concentration (n=6) with the help of the winCATS 1.4.8 software.
The sensitivity of the method was determined with respect to LOD and LOQ. These two parameters were determined from linearity study by a linear regression model calculated from the slope (a) and the intercept (b) SD of calibration curves. LOD was calculated as 3 times the noise level and LOQ was calculated 10 times the noise level
Precision was evaluated in terms of intraday and interday precision. Working standard solution of 400 ng/band of Methylprednisolone were prepared and used for the precision study. Intraday precision was determined by analyzing solution of Methylprednisolone at three levels converting lower, medium and higher proposing of the calibration curve three times on the same day. Interday precision was determined by analyzing sample solution of Methylprednisolone at three levels covering lower, medium and higher concentration period of three days. The peak area obtain were used to calculate mean and %RSD value
The accuracy of the method was determined by calculating recoveries of Methylprednisolone by method of standard addition at 80, 100 and 120% levels. Known amount of Methylprednisolone (0, 600, 800, 1000 ng/band) were taken from working standard of 400 ng/band. It was added to pre quantified sample, and the amount of Methylprednisolone were estimated by measuring the peak area and by fitting this value to the straight line equation of calibration curve.
Small deliberate changes in the chamber saturation time, change in temperatures, change in wavelength and mobile phase composition were introduced and the effects on the results were examined. Robustness of the method was determined in triplicate at a concentration level of 400 ng/band for Methylprednisolone. The mean and %RSD of peak area were calculated.
Twenty tablets were weighed and finely powdered. The powder equivalent to 10 mg of methylprednisolone was accurately weighed and transferred into a 10 mL volumetric flask. 5 mL of methanol added to the above flask and sonicated for 5 min. The volume was adjusted to the mark with the methanol. An aliquot of 1 mL was transferred into a 10 mL volumetric flask and the volume was made up to the mark with methanol to obtain 100μg/mL of Methylprednisolone. 6μL of solutions were applied to precoated TLC plates with the help of Hamilton syringe under a continuous stream of nitrogen gas to obtain a spot containing 600 ng/band for Methylprednisolone and analyzed it by the proposed method. The amount of Methylprednisolone computed using regression equation.
Accurately weighed 5mg of Methylprednisolone was transferred in 10ml volumetric flask and dissolved in methanol to obtain 500µg/ml. 2ml aliquot from this solution was taken in 10ml volumetric flask and mixed with 2ml of 0.01N HCl and refluxed for 5 hours at 80ºC. The flask solution was then neutralized with 0.01 N NaOH and then made up to the mark with methanol. A chromatogram was obtained using 6µl of the resultant solution (600ng/band) and recorded at 243 nm. The quantity of drug affected by acid was calculated.
Accurately weighed 5mg of Methylprednisolone was transferred in 10ml volumetric flask and dissolved in methanol to obtain 500µg/ml. 2ml aliquot from this solution was taken in 10ml volumetric flask and mixed with 2ml of 0.01N NaOH and refluxed for 2 hours at 80ºC. The flask solution was then neutralized with 0.01 N HCl and then made up to the mark with methanol. A chromatogram was obtained using 6µl of the resultant solution (600ng/band) and recorded at 243 nm. The quantity of drug affected by base was calculated.
Accurately weighed 10mg of drug was transferred into 10ml volumetric flask and dissolved in methanol to obtain 1000µg/ml, from this 2ml of aliquot was taken in 10ml volumetric flask and 2ml of 3% H2O2 solution was added and allowed to set for 6hrs at room temperature. After the completion of 6hrs, the flask was made up to the mark and the chromatogram was obtained by spotting 6µl solution from the flask at 243 nm. The quantity of drug affected by the peroxide was calculated.
Accurately weighed 10mg API was allowed to degrade under UV light at short wavelength for 24 hours. After completion of 24 hours, 1mg of drug was dissolved using methanol in 10ml volumetric flask (100µg/ml). From this solution chromatogram was obtained by spotting 6µl at 253 nm. The quantity of drug affected by UV light was calculated.
Accurately weighed 10mg API was allowed to degrade in hot air oven at 80oC for 24 hours. After completion of 24 hours, 1mg of drug was dissolved using methanol in 10ml volumetric flask (100µg/ml). From this solution chromatogram was taken by spotting 6µl at 243 nm. The quantity of drug affected by temperature was calculated.
The powdered tablet was equivalently weighed 5mg and transferred in 10ml volumetric flask and dissolved in methanol to obtain 500µg/ml. The solution then sonicated for 15 minutes and filtered using Whatmann filter paper (0.45µm). 2ml aliquot from this solution was taken in 10ml volumetric flasks and mixed with 2ml of 0.01N HCl and refluxed for 5 hours at 80oC. The flask solution was then neutralized with 0.01N NaOH and made up to the mark. A chromatogram was obtained using 6 µl of the resultant solution (600ng/band) and recorded at 243 nm. The quantity of drug affected by acid was calculated.
The powdered tablet was equivalently weighed 5mg and transferred in 10ml volumetric flask and dissolved in methanol to obtain 500µg/ml. The solution then sonicated for 15 minutes and filtered using Whatmann filter paper (0.45µm). 2ml aliquot from this solution was taken in 10ml volumetric flask and mixed with 2ml of 0.01N NaOH and refluxed for 2 hours at 80o C. The flask solution was then neutralized with 0.01N HCl and made up to the mark with methanol. A chromatogram was created using 6 µl of the resultant solution (600ng/band) and recorded at 243 nm. The quantity of drug affected by base was calculated.
The powdered tablet was equivalently weighed 5mg and transferred in 10ml volumetric flask and dissolved in methanol to obtain 500µg/ml. The solution then sonicated for 15 mins and filtered using Whatmann filter paper (0.45µm). 2ml aliquot from this solution was taken in 10ml volumetric flasks and 2ml of 3% H2O2 solution was added in the flask and allowed to set for 6hrs at room temperature. After the completion of 6hrs, the flask was made up to the mark with methanol and chromatogram was obtained by spotting 6µl solution from each flask at 243 nm. The quantity of drug affected by the peroxide was calculated.
The powdered tablet was equivalently weighed 5mg and allowed to degrade under UV light at short wavelength for 24 hours. After completion of 24 hours, 1mg of drug was dissolved in methanol in 10ml volumetric flask and made up to the mark (100µg/ml). From this solution chromatogram was taken by spotting 6µl at 243 nm. The quantity of drug affected by UV light was calculated.
The powdered tablet was weighed equivalent to 5mg and allowed to degrade in hot air oven at 80oC for 24 hours. After completion of 24 hours, 1mg of drug was dissolved in methanol in 10ml volumetric flask and made up to the mark (100µg/ml). From this solution chromatogram was taken by spotting 6µl at 243 nm. The quantity of drug affected by temperature was calculated.
RESULTS AND DISCUSSION
Selection of the mobile phase was carried out on the basis of polarity. A mobile phase that would give a dense and compact band with an appropriate Rf value for Methylprednisolone was desired Various mobile phases such as methanol: toluene, toluene: ethyl acetate, methanol: ethyl acetate, methanol: toluene: ethyl acetate: ammonia, dichloromethane: toluene, dichloromethane: methanol: toluene was tried in different proportions. A mobile phase consisting of Ethyl acetate: cyclohexane: Glacial acetic acid (8:2:0.2 v/v/v) gave good separation of Methylprednisolone. These chromatographic conditions produced a well-defined, compact band of Methylprednisolone with optimum migration at Rf 0.50 ± 0.05, respectively. The method was optimized using the DoE approach and the design selected is Box-Behnken design with the 16 DoE based trials, which increases the design space of the working area. The sensitivity of HPTLC method that uses UV detection depends upon proper selection of detection wavelength. An ideal wavelength is the one that gives good response for the drugs that are to be detected. In the present study individual drug solution of 10μg/ml was prepared in methanol. The drug solutions were then scanned in the UV region of 200 – 400 nm and the overlay spectra were recorded. All three graphs are shown appreciable absorption at 243 nm (shown in figure 1).
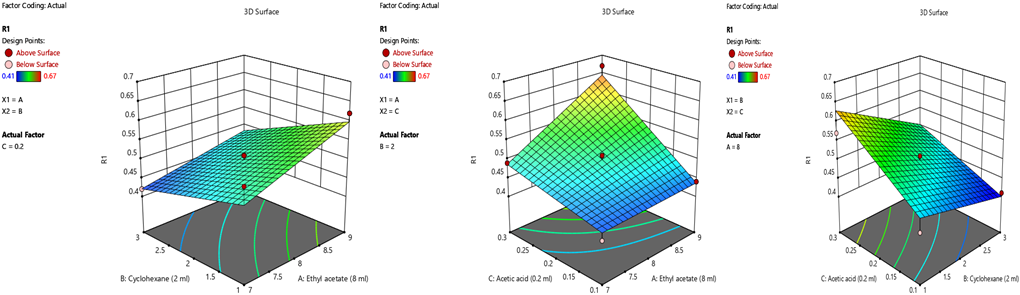
Figure 1: 3D graphs placed using DoE of AB, AC & BC.
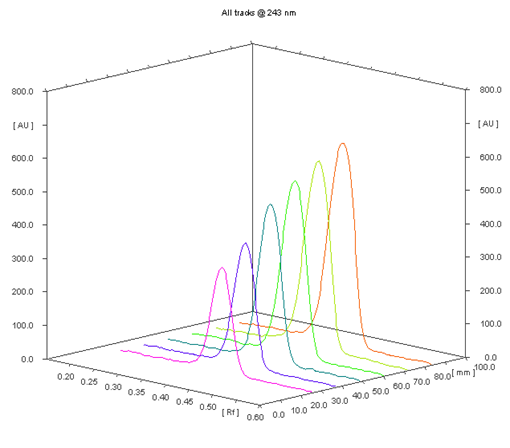
Figure 2 Calibration curve of Methylprednisolone
The calibration curves were obtained by plotting the peak area versus concentration over the range of 200-1200 ng/band Methylprednisolone, respectively in mix standard. Three dimensional overlays of densitogram are shown in Figure 2. The statistical data of regression analysis of the calibration curves are shown in Table 1.
Instrument precision was determined by performing scanner and injection repeatability test. The % RSD values were found to be less than 3. Intra-day and inter-day precision studies were carried out. For the intra-day precision study % RSD values were found to be 0.021-0.049 for Methylprednisolone, and for the inter-day precision study % RSD values were found to be 0.104-0.253 for Methylprednisolone. The low % RSD values indicate that the method is precise. The summary of validation parameters are shown in Table 2.
TABLE 1 Regression analysis of Calibration curve
|
Parameters |
Methylprednisolone |
|
Linearity range |
200-1200 ng/band |
|
Slope |
11.39 |
|
Standard deviation of slope |
1.36 |
|
Intercept |
2570 |
|
Standard deviation of intercept |
18.38 |
|
Regression Co-efficient (r2) |
0.995 |
TABLE 2 Summary of validation parameters
|
Parameters |
Methylprednisolone |
|
Rf |
0.5±0.05 |
|
LOD (µg/ml) |
1.794 |
|
LOD (µg/ml) |
5.436 |
|
Accuracy (%) |
98.53-101.80 |
|
Repeatability (RSD, %) Scanning (n=6) Sporting (n=6) |
0.094 0.182 |
|
Precision (RSD, %) Intraday (n=3) Interday (n=3) |
0.021-0.049 0.104-0.253 |
|
Robustness |
%RSD<2 |
|
Specificity |
No interference |
The accuracy of the method was determined by calculating recoveries of Methylprednisolone by standard addition method. The % recoveries were found to be 98.53-101.80 for Methylprednisolone, respectively. The values indicate that the method is accurate. The detection limits (LOD) for Methylprednisolone were found to be 1.794 µg/ml respectively. While quantitation limits (LOQ) were found to be 5.436 µg/ml, respectively. The above data shows that a nanogram quantity of both the drugs can be accurately and precisely determined. The system-suitability tests are used to verify that the resolution and reproducibility of the chromatographic system are adequate for analysis to be done. The tests are based on the concept that the equipment, electronics, analytical operations, and sample to be analyzed constitute an integral system that can be evaluated as such. The system suitability parameters like Rf values and peak purity index were calculated.
The specificity study was carried out to check the interference from the excipients used in the formulations by preparing synthetic mixture containing all three the drugs and excipients. The densitogram showed peaks for Methylprednisolone without any interfering peak.
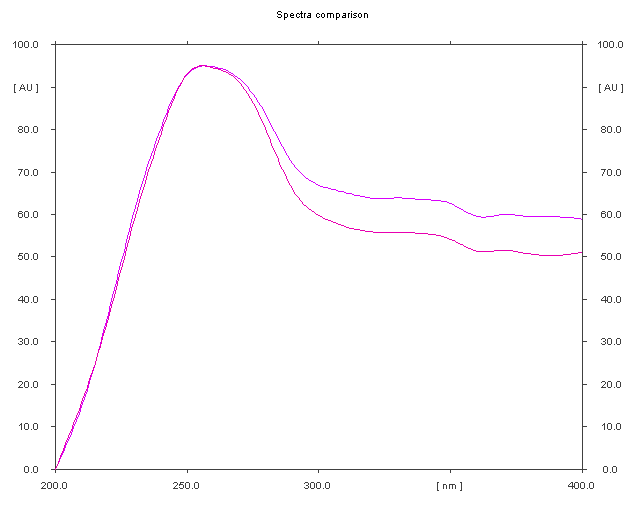
Figure 3: Overlain spectrum of Methylprednisolone API and Formulation (λmax = 243nm)
The method was found to be robust, as small but deliberate changes in method parameters have no detrimental effect on the method performance as shown in Table 2. The % RSD relative standard deviation indicates that the method is robust.
Stability study of the API and Formulation of Methylprednisolone was performed and the percentage amount of both was found to be satisfactory as shown in table 3.
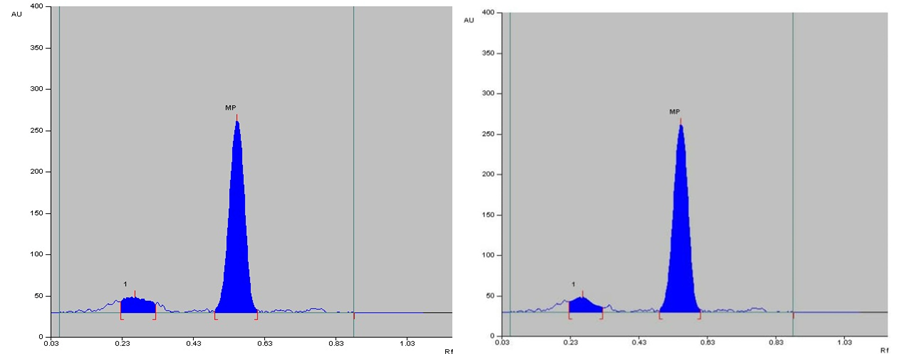
Figure 4: Densitogram of API and Formulation of Methylprednisolone for Acid degradation (0.01N HCl)
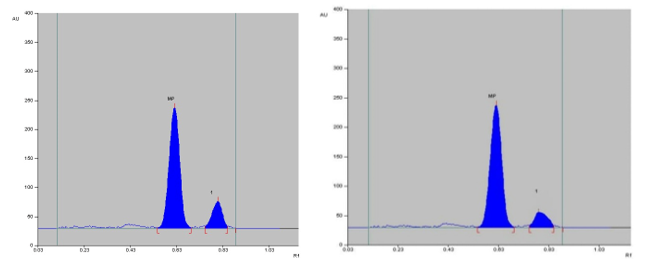
Figure 5: Densitogram of API and Formulation of Methylprednisolone for Base degradation (0.01N NaOH)
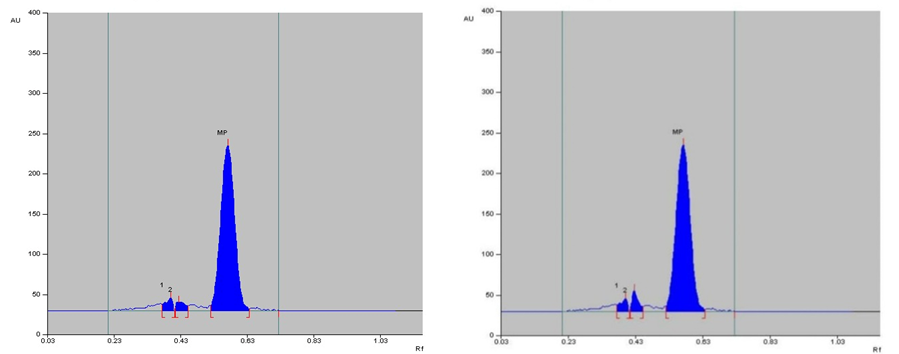
Figure 6: Densitogram of API and Formulation of Methylprednisolone for Oxidative degradation (3% H2O2)
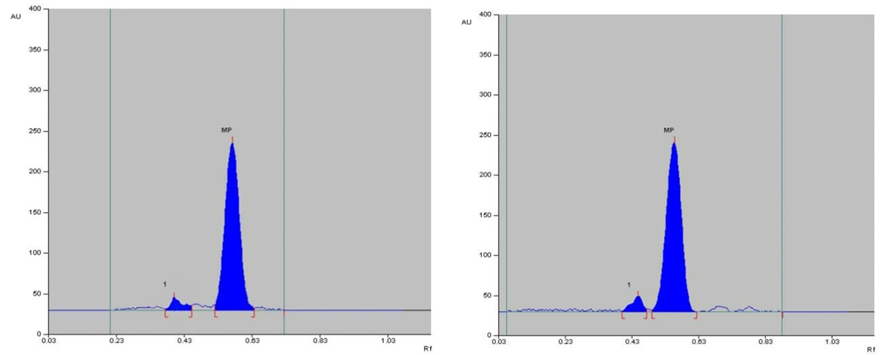
Figure 7: Densitogram of API and Formulation of Methylprednisolone for Photolytic degradation (in UV light)
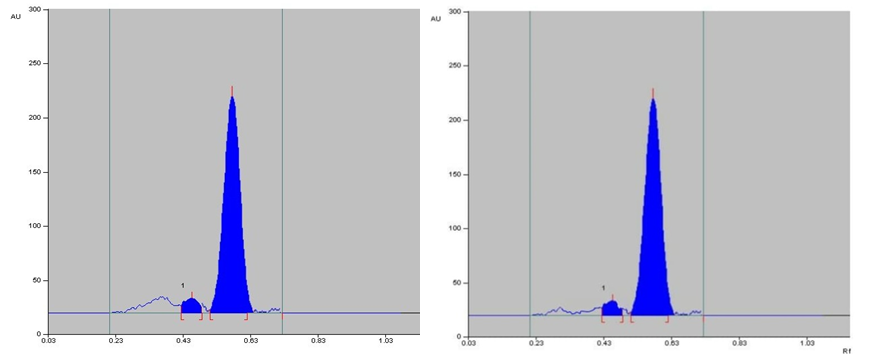
Figure 8: Densitogram of API and Formulation of Methylprednisolone for Photolytic degradation (in UV light)
TABLE 3 Stability study of Methylprednisolone API and Formulation
|
Sr no |
Applied degradation condition |
No. of degradation products |
% degradation based on area |
|
|
API (%) |
Formulation (%) |
|||
|
1. |
Acid (Refluxed for 5hrs at 80ºC in 0.01 N HCl) |
1 |
16.10 |
14.08 |
|
2. |
Base (Refluxed for 2hrs at 80ºC in 0.01 N NaOH |
1 |
19.34 |
19.52 |
|
3. |
Peroxide (For 6hrs at room temp. in 3% H2O2) |
2 |
15 |
17.91 |
|
4. |
Photolytic (For 24hrs Under UV light) |
1 |
12.11 |
13.23 |
|
5. |
Thermal (For 24hrs at 80ºC in hot air oven) |
1 |
16.09 |
15.10 |
CONCLUSIONS
DECLARATION OF INTEREST
All authors associated with this research work declared that there is no conflict of interest for publication of work. This research did not receive any specific grant from funding agencies in the public, commercial, or not-for-profit sectors.
REFERENCES


Bhakti Chapla*, Vaishali Karkhanis, Yash Pokiya, Payal Panchal, Development and Validation of Stability Indicating Green-Hptlc Method for The Estimation of Methylprednisolone in Bulk and Tablet Dosage Form Using DoE Approach, Int. J. of Pharm. Sci., 2025, Vol 3, Issue 2, 1909-1919. https://doi.org/10.5281/zenodo.14916905
 10.5281/zenodo.14916905
