
We use cookies to ensure our website works properly and to personalise your experience. Cookies policy
Adarsh College of Pharmacy, (Affiliated to DBAT University) Vita. 415311
UV-Visible Spectrophotometry is widely used in pharmaceutical, chemical, and environmental analysis due to its simplicity, cost-effectiveness, and sensitivity. However, method validation is crucial to ensure the accuracy, reliability, and consistency of the results generated by this technique. The UV-Visible Spectroscopic method for Bempedoic acid in bulk and tablet formulation was successfully validated as per ICH guidelines. The method demonstrated excellent linearity (r² = 0.998), accuracy (98–102% recovery), and precision (%RSD < 0.5%). LOD and LOQ were within acceptable limits, and the method proved robust and reliable for routine quantitative analysis within the 500–1000 µg/mL range. The maximum absorbance (?max) of Bempedoic acid was observed at ?max = 211 nm in ethanol. The implication of this research is that the validated UV-Visible spectroscopic method provides a reliable, accurate, and cost-effective analytical tool for routine quality control in pharmaceutical and chemical industries. It ensures consistent product quality, supports regulatory compliance, and enhances confidence in analytical results for both research and commercial applications.
UV-Visible spectroscopy is an analytical technique used to measure the absorbance or transmittance of a substance in the ultraviolet (200–400 nm) and visible (400–800 nm) regions of the electromagnetic spectrum. It is based on the principle that molecules absorb light at specific wavelengths, causing electronic transitions. The amount of light absorbed is directly proportional to the concentration of the analyte, according to Beer-Lambert’s law. This technique is widely used in pharmaceuticals, chemistry, biology, and environmental science for qualitative and quantitative analysis due to its simplicity, sensitivity, and rapid results. [1, 2] In research, UV-Visible spectroscopy plays a crucial role in the qualitative and quantitative analysis of compounds. It is widely applied to study molecular structure, concentration, reaction kinetics, and purity of substances. The technique is valued for its simplicity, speed, and non-destructive nature, making it ideal for routine analysis and monitoring of chemical and biological processes. In pharmaceutical and chemical research, it supports drug development, stability studies, and formulation analysis. By providing accurate absorbance data, UV-Visible spectroscopy contributes significantly to the reliability and efficiency of experimental outcomes. [3] Bempedoic acid is a novel lipid-lowering agent that acts by inhibiting ATP-citrate lyase, an enzyme upstream of HMG-CoA reductase in the cholesterol biosynthesis pathway. It is primarily used as an adjunct treatment for hypercholesterolemia. Given its recent approval and therapeutic importance, developing a simple analytical method for its quantification in bulk and tablet forms is essential. This study aims to develop and validate a UV-visible spectrometric method for Bempedoic Acid in accordance with ICH guidelines. [4]
METHODOLOGY
Materials
The following materials and chemicals were procured and utilized during the study. Bempedoic acid, as the active pharmaceutical ingredient (API), was obtained from Enaltec Labs Pvt. Ltd., while Bempesta tablets (Bempedoic acid formulation) were procured from Exemed Pharmaceuticals. Ethanol and methanol were purchased from Mahalaxmi Scientific, Kolhapur. Distilled water was supplied by Adarsh College of Pharmacy, Vita. All materials used were of analytical grade and were used without further purification unless otherwise specified.
Identification by IR Interpretation
Approximately 1–2 mg of Bempedoic acid was accurately weighed and mixed thoroughly with about 100 mg of dry potassium bromide (KBr) using a mortar and pestle to ensure uniform distribution of the drug within the KBr matrix. The finely ground mixture was then transferred into a pellet holder and compressed using a hydraulic press to form a thin, transparent pellet. The FTIR spectrometer was switched on and allowed to warm up to ensure optimal functioning. A background scan was performed using a clean KBr pellet to eliminate any interference from atmospheric moisture or carbon dioxide. The prepared sample pellet was then placed in the sample holder of the spectrometer, and the infrared (IR) spectrum was recorded over a scanning range of 4000 to 400 cm?¹. [5, 6]
Selection of solvent and determination of λmax
A solution of Bempedoic acid (100 µg/mL) was prepared using various solvents such as methanol, ethanol, and water. These solutions were scanned in the UV region (200-400 nm) to evaluate their absorbance characteristics. The purpose of this analysis was to determine the most suitable solvent for Bempedoic acid based on its UV absorbance profile. [7]
UV Spectrophotometric Method for Bempedoic acid
The UV-visible spectrophotometer was operated in spectrum mode, with the measuring mode set to absorbance. The wavelength range for the scan was set from 200 nm to 400 nm. [8]
Preparation of Stock Solutions
A primary stock solution of Bempedoic acid was prepared 1000 µg/ml by dissolving 100mg drug in 100 ml ethanol. From this stock solution, a series of standard solutions were prepared through appropriate serial dilutions using ethanol as the diluent, to obtain the desired concentrations for analytical study. [9]
Validation of a UV-Visible Spectrophotometric Method for the Estimation of Bempedoic Acid
1. Linearity
An accurately weighed quantity of 100 mg of Bempedoic acid was transferred into a 100 mL volumetric flask. The powder was dissolved in ethanol, and the volume was made up to 100 mL to obtain a stock solution with a concentration of 1000 µg/mL. This solution was labeled as the stock solution. From this stock, 5 mL, 6 mL, 7 mL, 8 mL, 9 mL, and 10 mL aliquots were transferred into six separate 10 mL volumetric flasks. Each was diluted to the mark with ethanol to obtain final concentrations of 500, 600, 700, 800, 900, and 1000 µg/mL, respectively. Ethanol was used as a blank throughout the analysis. The UV-visible spectrophotometer was set to a wavelength of 211 nm. The absorbance of each prepared solution was measured, and a calibration curve was constructed by plotting concentration against absorbance. [11, 12]
2. Range
The range of the analytical method was determined based on the span between the lower and upper concentrations of the calibration curve, as established through the linearity study. [13]
3. Accuracy
Twenty tablets of Bempesta were individually weighed, and the average tablet weight was calculated. The label claim of Bempedoic acid per tablet was verified from the product packaging. The twenty tablets were then powdered using a mortar and pestle, and a quantity of powder equivalent to 0.22 g of Bempedoic acid was accurately weighed. This was transferred to a volumetric flask and initially dissolved in a small amount of ethanol. The mixture was shaken for 15 minutes to ensure complete dissolution, and the volume was made up to 100 mL with ethanol to obtain a solution with a concentration of 1000 µg/mL. This solution was designated as the stock solution of the tablet formulation. From this tablet stock solution, 1 mL was withdrawn and transferred to a 10 mL volumetric flask. The volume was adjusted to 10 mL with ethanol to obtain a final concentration of 10 µg/mL. Simultaneously, a standard stock solution of pure Bempedoic acid was prepared by dissolving an appropriate amount of pure drug in ethanol to achieve a concentration of 1000 µg/mL. From this, 1 mL was withdrawn and diluted to 10 mL with ethanol in a volumetric flask to prepare a 10 µg/mL standard solution.[14, 15] For recovery studies, different concentrations (80%, 100%, and 120%) were prepared as follows:
The absorbances of all prepared solutions were measured using a UV-Visible spectrophotometer. The percentage recovery of Bempedoic acid was calculated using the standard formula:
% Recovery = [(Amount found – Original amount) / Amount added] × 100
4. Precision
An accurately weighed 100 mg of Bempedoic acid was transferred into a 100 mL volumetric flask. The drug was dissolved in ethanol, and the volume was made up to 100 mL to obtain a stock solution with a concentration of 1000 µg/mL. This solution was labeled as the stock solution. From the stock solution, 6 mL, 7 mL, and 8 mL aliquots were transferred into separate 10 mL volumetric flasks and diluted to 10 mL with ethanol to obtain final concentrations of 600 µg/mL, 700 µg/mL, and 800 µg/mL, respectively. Ethanol was used as the blank for the spectrophotometric analysis. The UV-Visible spectrophotometer was set to a wavelength of 211 nm, and the absorbance of each prepared solution was measured. [16, 17]
a) Repeatability
Six replicate reading was taken of same concentration at same time, under the same condition. For each concentration calculated the mean, standard deviation, and percentage relative standard deviation (% RSD). [18]
b) Intra-day
Triplicate reading was taken of same concentration at three different interval section of time (i.e. morning, afternoon and evening). For each concentration calculated the mean, standard deviation and percentage standard deviation (% RSD).
c) Inter-day
Triplicate reading was taken of same concentration at three different days. For each concentration calculated the mean, standard deviation and percentage standard deviation (% RSD).[19, 20]
3.5 Limit of Detection (LOD)
LOD = 3.3 × (σ / S)
Where,
• σ is the standard deviation of the response,
• S is the slope of the calibration curve constructed from the standard solutions of Bempedoic acid.
5. Limit of Quantitation (LOQ)
The quantitation limit of an individual analytical procedure is the lowest amount of analyte in a sample which can be quantitatively determined with suitable precision and accuracy. The quantitation limit is a parameter of quantitative assays for low levels of compounds in sample matrices and is used particularly for the determination of impurities and/or degradation products. [22, 23] The LOQ was then determined using the following formula:
LOQ = 10 × (SD / S)
Where,
SD = Standard deviation of response,
S = Slope of the calibration curve.
7. Robustness
The robustness of the method was evaluated by performing the analysis under slightly varied conditions, specifically at two different temperatures: (26°C) and (36°C). The absorbance values obtained under both conditions were recorded. The impact of the temperature variation on the method’s performance was assessed by calculating the % Relative Standard Deviation (%RSD) of the results. A low %RSD indicates that the method is robust and not significantly affected by minor temperature changes. [24, 25]
8. Assay of Bempedoic acid in marketed tablet formulation
An accurately weighed quantity of powdered equivalent to about 100 mg of Bempedoic acid in 100 ml ethanol. Sonicated for 15 min and then filtered through Whatman filter paper No.41. 1ml of this solution was diluted to 10ml with ethanol. The absorbance of this solution was determined to calculate the amount of Bempedoic acid in tablet formulation. [25]
RESULT AND DISCUSSION
1. FTIR Study
The FTIR spectrum of Bempedoic acid revealed several characteristic absorption peaks corresponding to various functional groups. A broad peak observed at 3431.70 cm?¹ was attributed to the -OH stretching vibration of the carboxylic acid group. Peaks at 2916.43 cm?¹ and 2852.13 cm?¹ indicated the presence of C-H stretching vibrations from alkyl groups. A sharp and intense peak at 1705.18 cm?¹ corresponded to the C=O stretching of the carboxylic acid group. Peaks at 1458.52 cm?¹ and 1391.57 cm?¹ were assigned to CH?/CH? bending vibrations. Additional peaks at 1169.07 cm?¹ and 1002.41 cm?¹ represented C–O stretching vibrations, typically seen in alcohols and ethers. Lastly, absorption bands at 827.30 cm?¹ and 757.77 cm?¹ were attributed to aromatic C–H out-of-plane bending vibrations, indicating the presence of aromatic moieties in the structure.
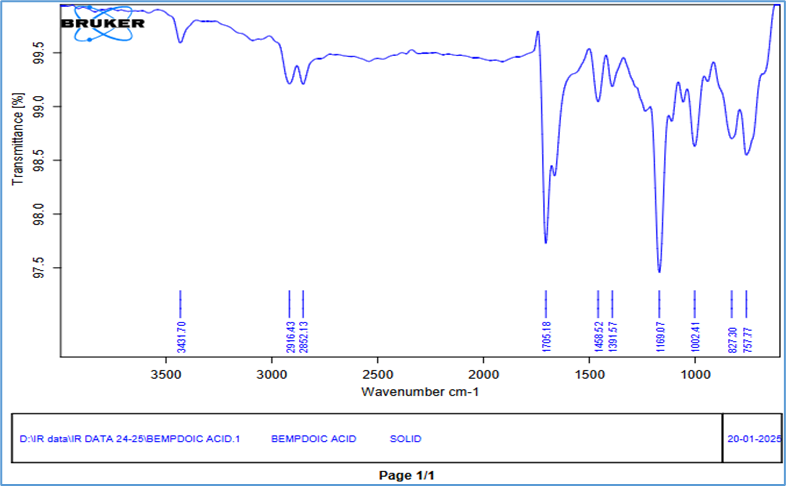
Figure 1: IR Interpretation of Bempedoic acid
2. Analytical Method Development
Linearity
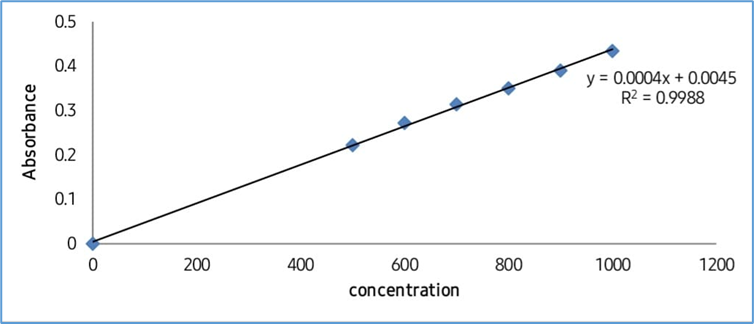
The linearity of Bempedoic acid was evaluated using UV-visible spectrophotometry by preparing solutions in the concentration range of 500 to 1000 µg/mL. The absorbance values were measured at 211 nm for each concentration. At a concentration of 500 µg/mL, the absorbance was 0.222. For 600 µg/mL, the absorbance increased to 0.272, and at 700 µg/mL, it was 0.314. A further increase to 800 µg/mL resulted in an absorbance of 0.350, while 900 µg/mL showed a slight drop to 0.300. Finally, the solution with 1000 µg/mL concentration showed the highest absorbance of 0.434. This data was used to construct a calibration curve by plotting concentration versus absorbance to assess the linearity of the method.[26]
Table 1:-UV Spectrum Linearity of Bempedoic Acid
|
Sr no |
Concentration (µg/ml) |
Absorbance |
|
1 |
500 |
0.222 |
|
2 |
600 |
0.272 |
|
3 |
700 |
0.314 |
|
4 |
800 |
0.35 |
|
5 |
900 |
0.39 |
|
6 |
1000 |
0.434 |
3. Range
The UV spectrophotometric method developed for Bempedoic acid demonstrated a linearity range between 500 to 1000 µg/mL, indicating that the method is suitable for quantitative analysis within this concentration range.
Table 2: Results of Range for UV Spectrophotometric Method
|
Parameter |
Bempedoic Acid |
|
Linearity Range (µg/ml) |
500-1000 |
4. Accuracy
Recovery studies were performed at three concentration levels—80%, 100%, and 120%—to evaluate the accuracy of the UV spectrophotometric method for Bempedoic acid. At the 80% level, the absorbance was 0.203, corresponding to a recovered amount of 496.25 µg/mL, yielding a mean recovery of 99.25%. At the 100% level, an absorbance of 0.205 was recorded, with 501.25 µg/mL recovered and a mean recovery of 100.25%. For the 120% level, the absorbance measured was 0.201, corresponding to 491.25 µg/mL and a mean recovery of 98.25%. These results indicate that the method is accurate and reliable for the quantitative determination of Bempedoic acid in pharmaceutical formulations.[27]
Table 3: Recovery Study Data of Bempedoic Acid
|
Levels of % Recovery |
Absorbance |
Amount Recovered (μg/ml) |
% Mean recovery |
|
80 |
0.203 |
496.25 |
99.25 |
|
100 |
0.205 |
501.25 |
100.25 |
|
120 |
0.201 |
491.25 |
98.25 |
5. Precision
The repeatability of the UV spectrophotometric method was assessed by measuring the absorbance of Bempedoic acid at three different concentrations: 600 µg/mL, 700 µg/mL, and 800 µg/mL, across six trials each. At 600 µg/mL, the mean absorbance was 0.2028 ± 0.000687 with a %RSD of 0.3, indicating excellent repeatability. Similarly, for 700 µg/mL, the mean absorbance was 0.2605 ± 0.001258 and %RSD was 0.4, while for 800 µg/mL, the mean was 0.2871 ± 0.000373 with a %RSD of 0.1. These low %RSD values confirm that the method is highly repeatable and consistent.
Table 4: Repeatability Study of Bempedoic acid
|
Concentration (µg/ml) |
Absorbance |
Mean Abs. |
± SD |
% RSD |
|||||
|
|
Trial 1 |
Trial 2 |
Trial 3 |
Trial 4 |
Trial 5 |
Trial 6 |
|
|
|
|
600 |
0.202 |
0.204 |
0.203 |
0.203 |
0.202 |
0.203 |
0.2028 |
0.000687 |
0.3 |
|
700 |
0.260 |
0.261 |
0.263 |
0.260 |
0.260 |
0.259 |
0.2605 |
0.001258 |
0.4 |
|
800 |
0.288 |
0.287 |
0.287 |
0.287 |
0.287 |
0.287 |
0.2871 |
0.000373 |
0.1 |
To evaluate intra-day precision, absorbance readings were recorded at three different time points (9:30 AM, 12:30 PM, and 3:30 PM) for each concentration. For 600 µg/mL, the absorbance values ranged from 0.177 to 0.235, yielding a standard deviation of 0.000957 and a %RSD of 0.44. At 700 µg/mL, absorbances varied from 0.221 to 0.315, with a standard deviation of 0.00232 and %RSD of 0.55. For 800 µg/mL, absorbance ranged from 0.245 to 0.339, resulting in a standard deviation of 0.00260 and %RSD of 0.36. These results indicate acceptable precision within the same day.[28]
Table 5: Intra-Day Variability of Bempedoic Acid
|
Concentration (µg/ml) |
Absorbance |
±SD |
% RSD |
||
|
|
9:30 |
12:30 |
3:30 |
|
|
|
600 |
0.235 |
0.203 |
0.177 |
0.000957 |
0.44 |
|
700 |
0.315 |
0.261 |
0.221 |
0.00232 |
0.55 |
|
800 |
0.339 |
0.287 |
0.245 |
0.00260 |
0.36 |
Inter-day precision was assessed by recording absorbances over three consecutive days. For 600 µg/mL, absorbance values ranged from 0.177 to -0.614, with a standard deviation of 0.00095 and a negative %RSD of -0.2. Similarly, at 700 µg/mL, the absorbance varied from 0.221 to -0.578, with a %RSD of -0.28, and for 800 µg/mL, the values ranged from 0.245 to -0.557, with a %RSD of -1.59. The presence of negative absorbance values and negative RSD percentages is not scientifically valid and may indicate instrumental error, data entry mistakes, or experimental inconsistencies during the inter-day study. This anomaly should be investigated and corrected to ensure accurate method validation.[29]
Table 6: Inter-day Day Variability of Bempedoic Acid
|
Concentration (µg/ml) |
Absorbance |
±SD |
% RSD |
||
|
|
Day1 |
Day2 |
Day3 |
|
|
|
600 |
0.177 |
-0.614 |
-0.102 |
0.00095 |
-0.2 |
|
700 |
0.221 |
-0.578 |
-0.234 |
0.00113 |
-0.28 |
|
800 |
0.245 |
-0.557 |
-0.233 |
0.00113 |
-1.59 |
6. Limit of Detection
The limit of detection (LOD) for Bempedoic acid was found to Development and Validation of a UV-Visible Spectrophotometric Method for Estimation of Bempedoic Acid in Bulk and Tablet Formulations, indicating the method's high sensitivity for detecting low concentrations of the drug using UV spectrophotometry.
Table 7: Limit of Detection Data
|
Parameter |
Bempedoic Acid |
|
LOD(µg/ml) |
0.01 |
7. Limit of Quantification
The limit of quantification (LOQ) for Bempedoic acid was determined to be 0.4 µg/mL, demonstrating that the UV spectrophotometric method is capable of accurately quantifying the drug at low concentration levels.[30]
Table 8: Limit of Quantification Data for Bempedoic Acid
|
Parameter |
Bempedoic Acid |
|
LOQ(µg/ml) |
0.4 |
8. Assay
The assay of the Bempedoic acid formulation at a concentration of 500 µg/mL resulted in an estimated amount of 501.25 µg/mL, corresponding to 100.25% of the label claim, indicating that the formulation meets the specified content requirements. [31]
Table 9: Assay of Formulation
|
Concentration of Formulation |
Amount estimated |
% label claim |
|
500µg/ml |
501.25µg/ml |
100.25 |
DISCUSSION
Preliminary Analysis of Bempedoic Acid
The preliminary evaluation of Bempedoic Acid, including its description, solubility, melting point, and infrared spectral analysis, supports its identification according to standards and other referenced literature.
UV Spectrophotometric Analysis of Bempedoic Acid
Due to its UV-absorbing nature, Bempedoic Acid has been effectively analyzed using UV spectrophotometry for quantitative assessment. Its solubility is in ethanol, stock and standard solutions were prepared using ethanol. The concentration of the drug was determined by measuring absorbance of the prepared sample solutions in the UV range (200–400 nm), using the maximum absorption peak. Calibration curves constructed from standard solutions showed a correlation coefficient (R²) of 0.998, indicating high linearity. The recovery of the drug using this method fell within the accepted range, confirming the formulation’s consistency. The method revealed an absorption maximum at 211 nm and demonstrated linearity across a concentration range of 500–1000 µg/ml. The limits of detection (LOD) and quantification (LOQ) were calculated to be 0.01 µg/ml and 0.4µg/ml, respectively. The recovery percentages and low relative standard deviation (RSD) values indicated no interference from excipients in the formulation. Thus, this method proves to be suitable for routine quality control of Bempedoic acid in Tablet form and may be useful for industrial application.
SUMMARY AND CONCLUSION
The proposed UV Spectrophotometric method has been evaluated over the Linearity, Accuracy, Precision, Robustness, LOD, and LOQ. The proposed method was found to be convenient and effective for the Quality Control.
Table 10: Summary of UV Spectrophotometric Method
|
Sr no. |
Parameters |
Values |
|
1 |
Beer’s Law (µg/ml) |
500-1000 |
|
2 |
Regression Equation (y=mx+c) |
y=0.0004x |
|
3 |
Correlation Coefficient (r2) |
0.998 |
|
4 |
Slope (m) |
0.0004 |
|
5 |
Intercept(c) |
0.0045 |
|
6 |
Linearity |
0.998 |
|
7 |
Limit of Detection (µg/ml) |
0.01 |
|
8 |
Limit of Quantitation (µg/ml) |
0.4 |
|
9 |
Precision (%RSD) Intraday Interday |
0.5 0.45 -0.69 |
|
10 |
Accuracy (% Recovery) |
98-102 |
|
11 |
Assay |
100.25 |
REFERENCES

Sumaiyya Attar, Haridas Pawar, Shubhangi Mali, Sanika Sawashe, Manasi Kavade, Abhijit Suryawanshi, Anuj Patil, Bandini Solawande, Development and Validation of a UV-Visible Spectrophotometric Method for Estimation of Bempedoic Acid in Bulk and Tablet Formulations, Int. J. of Pharm. Sci., 2025, Vol 3, Issue 7, 146-156. https://doi.org/10.5281/zenodo.15784412
 10.5281/zenodo.15784412