
We use cookies to ensure our website works properly and to personalise your experience. Cookies policy
SCS College of Pharmacy, Harapanahalli, Karnataka, India 583131
Objective: The objective of the current study is to examine the effects of emulsifying agents (Cremophore RH40, Tween 40) and permeation enhancers (l-Menthol) on cream formulations. The goal is to develop a formulation that is both safe and capableof delivering the drug locally at an effective concentration to achieve its intended therapeutic effect. Methodology: In the present work was applied to study the effect of varying concentration of Cremophore RH40, Tween 40 and permeation enhancers (l-Menthol). All of the prepared cream formulations were evaluated for its physicochemical parameters like pH, spreadability, viscosity, drug content and in vitro diffusion studies. Further, the optimized formulation was evaluated for in vitro anti-fungal activity and stability studies. Results: Different formulations of the cream were prepared using different concentration emulsifying agent and all the findings obtained were within the prescribed limit with less diffusion of drug. Out of nine different formulations, F9 was chosen as the optimized formula was included with menthol as penetration enhancer. The concentration of permeation enhancer significantly affects the critical parameters of cream formulation like cumulative amount released at 12 hours. In vitro permeation study showed that menthol enhanced the transdermal absorption of drug from cream formulation. The topical cream formulation developed in this study showed good anti- fungal activity and stable for 3 months. Conclusion: The development of topical cream to have localized effects appears to be very advisable and beneficial over conventional routes of provides the drug administration for the effective treatment of Skin infections
Topical/transdermal drug delivery refers to delivery of drugs via skin and is an attractive alternative to conventional methods such as oral and parenteral routes. Advantages associated with topical/transdermal delivery include non-invasive delivery, by pass of first pass metabolism, prolonged duration of action, reduced dosing frequency, constant levels of drug int the plasma, reduced drug toxicity/ adverse events, improved patience compliance, and others. However, skin acts as a major barrier for entry of drugs and foreign compounds due to presence of stratum corneum, a thin keratin rich layer (15μm) of dead cells embedded in an intricate lipid environment made of cholesterol, ceramides, and free fatty acids. In addition, several other factors such as physicochemical properties of the drug (lipophilicity, solubility, molecular weight or size and hydrogen bonding) and characteristics of a formulation/vehicle or a drug delivery system influence the permeation.1
The site of clotrimazole action is the stratum corneum where the pathogens reside. However, the specialized nature of the stratum corneum makes it an efficient barrier to drug molecules Therefore, stratum corneum penetration is the rate limiting step in percutaneous drug absorption Clotrimazole is usually formulated as a 1% cream, lotion, spray or solution for treatment of skin fungal infections. However, the commercially available topical products of clotrimazole have the limitations of low skin retention and deposition Since clotrimazole is poorly water-soluble, it requires a proper vehicle to improve its topical absorption Colloidal drug carriers such as microemulsions, vesicular carriers including liposomes, ectosomes and noisome as well as both lipidic and polymeric particulate carrier systems were developed for topical delivery of clotrimazole.2
Creams are widely used in the cosmetic and pharmaceutical fields for the topical administration of hydrophilic and lipophilic active ingredients. There exists different type of emulsions e.g. water-in-oil., oil-in-water, water-in-oil-in-water, oil-in-water-in- oil. Furthermore, emulsions are thermodynamically unstable and necessitate an emulsifier for the formation and stabilization.
The effect of the vehicle on dermal and transdermal delivery:
It has been recognized that the vehicle in which the permeant is applied to the skin has a distinctive effect on the dermal and transdermal delivery of active ingredients. Despite the fact that studies have been performed to investigate the vehicle effect on skin penetration, it is still not fully understood, especially for more complex formulations such as emulsions. In addition, the task of formulating a topical formulation not only. includes the optimization for delivery of the active ingredient but also the fulfillment of the requirements for chemical and physical stability, non-toxicity and aesthetic acceptability.3
MATERIAL AND METHOD:
Clotrimazole was procured from Yarrow Chem Products, Mumbai, India. Carbopol-940, Cremophor RH-40, Tween-40, isopropyl myristate, cetyl alcohol, benzyl alcohol, and triethanolamine were obtained from S.D. Fine-Chem Limited, India. All the materials and excipients used in the study were of analytical grade and were used as received without further purification.
Methods:
Pre formulation study:
Pre formulation study is the process of optimizing the delivery of drug through determination of physicochemical properties of the new compound that could affect drug performance and development of an efficacious, stable and safe dosage form. Pre formulation study is the first step in formulation of any dosage form. Prior to the development of the dosage forms the pre formulation study was carried out. It gives the information needed to define the nature of the drug substance and provide a framework for the drug combination with pharmaceutical excipients in the dosage form. Hence, pre formulation studies were performed for the obtained sample of drug for identification and compatibility studies.4
Determination of melting point:
Melting point of drug was determined by taking a small quantity of drug in capillary tube sealed at one end and placed in digital melting point apparatus and the temperature was slowly increased with simultaneous observation of the sample. The temperature at which drug starts melting point was recorded as melting point. This process was repeated two more times. The mean of three reading was recorded.5
DRUG–EXCIPIENT COMPATIBILITY STUDIES FT-IR studies
FTIR spectroscopy helps to determine any chemical interaction between drug and excipients used in formulation. FT-IR spectroscopy was conducted using a Shimadzu FTIR spectrophotometer and spectrum was recorded in the wavelength region of 4000 400cm-1. The procedure consisted of dispersing a sample i.e. 2mg (drug alone, polymer alone, and mixture of drug, polymer and non-volatile solvent) in 100 mg KBr and compressing into disc’s by applying a pressure of 5 tones for 5 min into hydraulic press. The pellet was placed in the light path and the spectrum was recorded. All spectra were collected as an average of 3 scans at a resolution of 2cm-1.8.6
Differential Scanning Calorimetry (DSC) Analysis7-8:
DSC (Perkin-Elmer thermal analysis) studies were carried out in order to characterize the physical state of drugs. Sample of pure drug and physical mixture were placed in the aluminum pans and thematically sealed. The heating rate was 10oC per misusing nitrogen as pure gas. The DSC instrument was calibrated for temperature using indium. In addition, the enthalpy calibration indium was sealed in aluminum pan with sealed empty pans as reference.
Analytical Method: -
Preparation of reagents:
Potassium dihydrogen phosphate 0.2M:
27.218 grams of potassium dihydrogen phosphate was dissolved in little quantity of distilled water and volume adjusted to produce 1000 ml.
Sodium hydroxide 0.2 M:
8 grams of NaOH was dissolved in distilled water and volume adjusted to produce1000 ml.
Preparation of phosphate buffer pH 7.4 solution:
Place 50 ml of 0.2M KH2PO4 in a 200 ml volumetric flask, add 39.1 ml of 0.2 M NaOH and volume adjusted to produce 1000 ml.
Preparation of standard stock solution of (1000μg/ml) clotrimazole:
Standard stock solution of clotrimazole was prepared by dissolving accurately weighed 100 mg of clotrimazole using pH 7.4 buffers in 100 ml volumetric flask. Thevolume was then made up to 100 ml by using phosphate buffer pH 7.4 to obtain the solution 1000 μg/ml.
Determination of analytical wavelength of clotrimazole:
10ml above stock solution was pipetted out and transferred into 100 ml volumetric flask. The volume was then made up to 100 ml with phosphate buffer pH 7.4. The resulting solution containing 100μg/ml was scanned between 200-400 nm. The wavelength of drug as λmax was selected.
Calibration curve of clotrimazole in phosphate buffer pH 7.4:
From the standard stock solution, a series of dilutions were prepared using phosphate buffer pH 7.4 to get concentration of 10-50 μg/ml. The absorbance of these solutions was measured using UV-spectrophotometer. Standard curve was obtained by plotting absorbance vs. drug concentration.
Table No.1: Formulation Ingredients and their required quantities
|
INGREDIENTS (%) |
Formulations |
|||||||||
|
F1 |
F2 |
F3 |
F4 |
F5 |
F6 |
F7 |
F8 |
F9 |
F10 |
|
|
Clotrimazole |
1 |
1 |
1 |
1 |
1 |
1 |
1 |
1 |
1 |
1 |
|
Carbopol-940 |
1 |
1 |
1 |
1 |
1 |
1 |
1 |
1 |
1 |
1 |
|
Cremophor RH -40 |
2.5 |
2.5 |
2.5 |
5 |
5 |
5 |
7.5 |
7.5 |
7.5 |
7.5 |
|
Tween 40 |
1 |
2.5 |
5 |
1 |
2.5 |
5 |
1 |
2.5 |
5 |
5 |
|
Iso propyl myosterate |
10 |
10 |
10 |
10 |
10 |
10 |
10 |
10 |
10 |
10 |
|
Cetyl alcohol |
5 |
5 |
5 |
5 |
5 |
5 |
5 |
5 |
5 |
5 |
|
Benzyl alcohol |
1 |
1 |
1 |
1 |
1 |
1 |
1 |
1 |
1 |
1 |
|
Distilled water |
100 |
100 |
100 |
100 |
100 |
100 |
100 |
100 |
100 |
100 |
|
Triethanolamine |
q.s |
q.s |
q.s |
q.s |
q.s |
q.s |
q.s |
q.s |
q.s |
q.s |
Evaluation Parameters9-15:
Physical appearance and pH:
Prepared creams were checked for their clarity and the pH was measured using a calibrated digital pH meter at 37°C. All measurements were made in triplicate.
Percentage yield:
The obtained gels were weighted and %yield was determined by the following equation.
Spreadability:
For the determination of spreadability, excess of sample was applied between the two glass slides and was compressed to uniform thickness by placing 100g weight for 5 min. Weight (50 g) was added to the pan. The time required to separate the two slides,
i.e the time in which the upper glass slide moves over the lower plate was taken as measure of spreadability(S)7.
S=M×L/T,
Where,
Viscosity measurement of prepared cream:
The viscosity of the all-prepared creams was determined by using Brookfield digital viscometer (Model no LVDV 2P230) using 10g of cream. Measurements were performed using suitable spindle and the temperature was maintained at 37±1°C. The viscosity was read directly from the viscometer display. All measurements were made in triplicate.
Determination of drug content:
1gm of prepared cream was dissolved in 5ml of pH 7.4 buffer solution and volume was made up to 100ml phosphate buffer pH 7.4. After suitable dilution the absorbance was measured by UV spectrophotometer (Shimadzu) at 262 nm.
In-vitro drug release:
The dialysis technique using cellophane membrane was used to study in-vitro release. Prior to diffusion studies, the dialysis membrane was soaked overnight in pH 7.4 phosphate buffer solution. 1gm of cream was placed on dialysis membrane, which was sealed on one side and one side opened. The dialysis tube was placed in a glass beaker containing 50 ml of pH 7.4 phosphate buffer solution. The release studies were performed at 37±0.5°C and stirred at 50 rpm using magnetic stirrer. The 5 ml of sample was withdrawn at different time interval and was replaced with same volume of pH 7.4 phosphate buffer to maintain the sink condition. The samples were filtered through Whatman filter paper (No.41) and solutions were analyzed using UV Spectrophotometer after suitable dilution. Cumulative percentage drug release was determined by using standard graph.
Stability Test:
The stability of optimized formulation was studied at different temperatures. Cream was stored in well tight closed container and maintained at oven temperature (40 ± 2oC) and 75 ± 5% RH for 3 months as per ICH guidelines. Change in the appearance and drug content of the stored cream was investigated after storage. The data presented are the mean of three determinations
RESULT AND DISCUSSION
Preformulation study:
Melting point:
The melting point of Clotrimazole was determined by capillary method using digital melting point apparatus (in triplicate) and melting point found to be 145-150°C. Thus obtained melting point is in agreement with literature melting point which confirms the purity of drug.
Compatibility study:
FT-IR studies:-
The preformulation study was carried out to study the compatibility of the pure Clotrimazole with the polymers Carbopol and Cetyl alcohol . The individual spectra of the pure drug and in combination with excipients are shown in figure no.1 and 2. In IR spectra of Clotrimazole major peaks of functional groups were found at various wavelengths. In the physical mixture, the principle peaks were approximately matched with the pure drug principle peaks. Hence, it can be concluded that there was no possible interactions between the drug and excipients.
Table No.2 : Major peaks of Clotrimazole and physical mixture of IR spectra
|
INGREDIENTS |
C-H |
C=N |
C=C |
C-N str |
C-H bending |
|
Clotrimazole |
3058.67 |
1583.05 |
1435.97 |
1081.22 |
751.55 |
|
Physical mixtures of Clotrimazole + Carbopol |
3056.89 |
1440.95 |
1440.95 |
1082.11 |
752.51 |
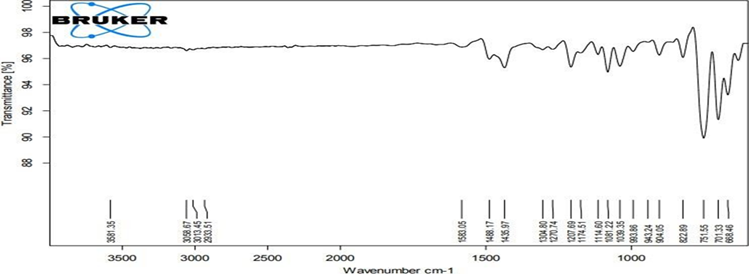
Figure No.1: FTIR Spectra of Pure Drug Clotrimazole
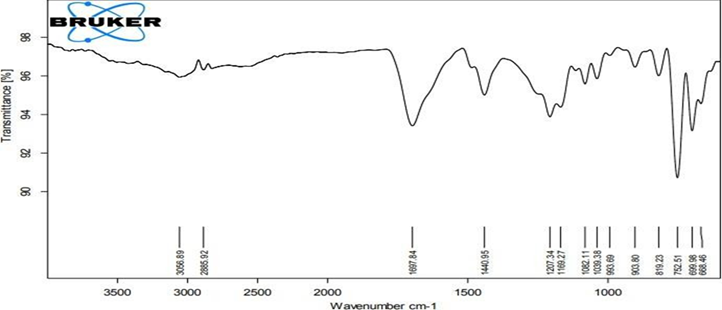
Figure No.2: FTIR spectra of Physical Mixture of Drug and polymers
Differential scanning calorimetry (DSC):-
Any possible drug polymer interaction can be studied by thermal analysis. The DSC patterns of pure Clotrimazole and its physical mixture are shown in Fig. 3 and 4 Pure Clotrimazole showed a sharp endothermic peak at 159.14°C corresponding to its melting point. There was negligible change in the melting endotherms of the physical mixture of drug with polymers (156.67°C) compared to pure drug. This observation further supports the IR spectroscopy results, which indicated the absence of any interactions between the drug and additives used in the preparation.
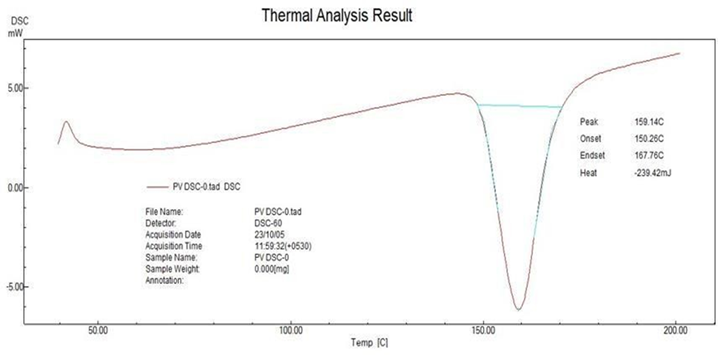
Figure No.3: DSC of Pure drug Clotrimazole:
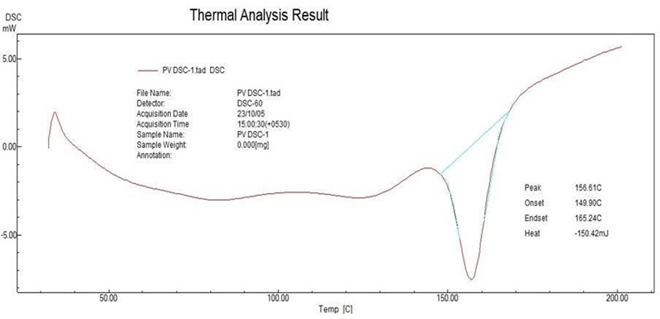
Figure No.4: DSC of Physical Mixture of drug and polymers
Table No.3: Standard Calibration data of Clotrimazole:
|
Sr. No. |
Concentration(µg/ml) |
Absorbance AM±SD |
|
1. |
0 |
0±0.000 |
|
2. |
2 |
0.129± 0.033 |
|
3. |
4 |
0.255 ± 0.060 |
|
4. |
6 |
0.372 ± 0.085 |
|
5. |
8 |
0.491 ± 0.109 |
|
6. |
10 |
0.623 ± 0.139 |
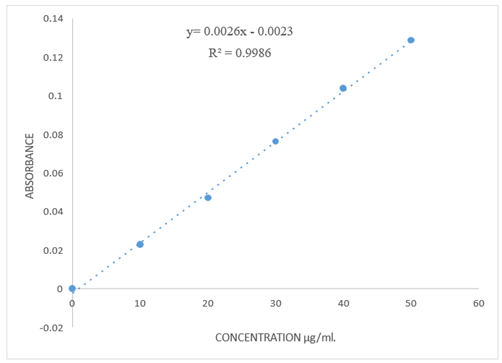
Figure No.5: Standard Calibration curve of Clotrimazole
Table No.4: Evaluation Parameters of Clotrimazole cream
|
Formulation code |
Appearance |
% yield |
Surface pH |
Viscosity (cps×103) |
Spreadability (gm/sec) |
Drug content (%) |
|
F1 |
Non- Transparent |
73.3 |
6.5 |
656.61 |
15.12 |
96.7±0.745 |
|
F2 |
Non- Transparent |
79.2 |
6.7 |
669.29 |
13.89 |
94.2±0.681 |
|
F3 |
Non- Transparent |
72.52 |
6.6 |
672.84 |
14.53 |
93.95±0.874 |
|
F4 |
Non- Transparent |
77.44 |
6.7 |
681.11 |
13.74 |
94.32±2.410 |
|
F5 |
Non- Transparent |
71.56 |
6.6 |
684.74 |
13.98 |
92.33±0.850 |
|
F6 |
Non- Transparent |
76.63 |
6.8 |
687.11 |
13.25 |
92.62±20402 |
|
F7 |
Non- Transparent |
74.77 |
6.9 |
682.80 |
12.98 |
92.5±3.294 |
|
F8 |
Non- Transparent |
78.02 |
7.0 |
685.17 |
12.51 |
96.7±1.284 |
|
F9 |
Non- Transparent |
80.12 |
6.8 |
697.39 |
13.47 |
95.95±0.956 |
|
F10 |
Non- Transparent |
89.25 |
6.8 |
693.76 |
14.41 |
97.82±1.172 |
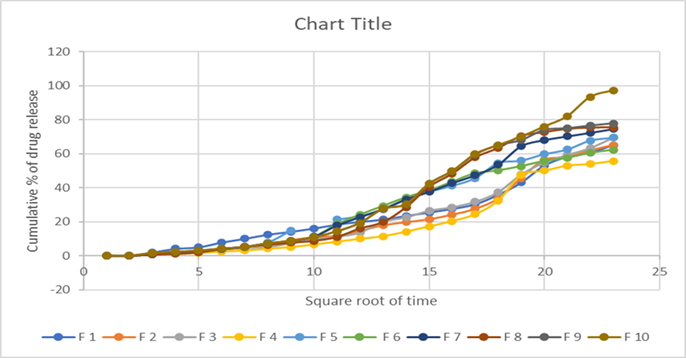
Diffusion Study:-
The cumulative amount of drug released from creams were determined and plotted in Figure 6. Each data point represents the mean of 6 determinations. The amount of drug was constant in all different cream formulation. Among all cream formulations, formulations containing lower concentration of Cremophore RH40 and showed the less release of drug in 12hr and formulations containing higher Cremophore RH40 and showed the more release of drug in 12 hr. and that is not maximum, and by the inclusion of tween-40 and penetration enhancer maximum release we can observe .Hence, higher concentration formulation was Selected for preparing cream formulations to study the effect of menthol as penetration enhancer. A marked effect of surfactants, concentration of Cremophor RH40 and concentration of Tween 40 on drug permeation was observed when it was incorporated cream formulations. The cumulative amount permeated at 12 hours of drug was optimized from cream formulation.
Table No.5: In-vitro drug release profile of Clotrimazole cream from (F1-F5):
|
TIME |
FORMULATION CODE (Cumulative release %) |
||||
|
F1 |
F2 |
F3 |
F4 |
F5 |
|
|
0 |
0.000±0.000 |
0.000±0.000 |
0.000±0.000 |
0.000±0.000 |
0.000±0.000 |
|
10 |
2.06±0.339 |
0.7±0.434 |
0.86±2.441 |
0.8±3.179 |
0.9±1.212 |
|
20 |
4.19±0.956 |
1.46±2.157 |
1.35±3.893 |
1.16±2.416 |
1.8±0.421 |
|
30 |
5.08±0.329 |
2.26±0.899 |
2.21±1.671 |
1.65±3.412 |
2.58±2.648 |
|
45 |
7.9±1.558 |
3.66±1.474 |
3.54±1.644 |
2.55±0.627 |
3.95±0.415 |
|
60 |
10.06±2.364 |
4.7±0.355 |
4.54±1.544 |
3.06±0.606 |
5.27±1.146 |
|
90 |
12.4±0.498 |
6.97±0.916 |
5.16±1.246 |
4.2±1.629 |
7.74±1.996 |
|
120 |
14.17±1.089 |
9.15±1.327 |
7.36±2.106 |
5.15±2.676 |
14.85±2.535 |
|
150 |
16.1±1.134 |
10.96±1.673 |
9.75±3.226 |
6.67±3.969 |
17.6±4.594 |
|
180 |
18.4±2.262 |
11.76±1.796 |
11.2±4.171 |
8.3±5.656 |
21.36±5.967 |
|
210 |
20±3.391 |
14.6±4.177 |
13.64±2.156 |
10±3.047 |
23.32±4.841 |
|
240 |
21.4±2.058 |
17.86±0.758 |
20.04±3.197 |
11.5±3.604 |
27.13±2.712 |
|
270 |
23.5±0.639 |
19.72±3.091 |
22.6±1.905 |
14.2±0.774 |
33±1.974 |
|
300 |
25.5±5.442 |
21.44±2.216 |
26.5±3.814 |
17.3±1.694 |
37.6±2.197 |
|
330 |
27.6±1.835 |
24.12±2.909 |
28.6±0.498 |
20.4±3.956 |
41.15±5.285 |
|
360 |
30.3±2.614 |
27.56±2.112 |
31.8±2.613 |
24.4±0.075 |
45.63±3.284 |
|
420 |
35.8±0.704 |
33.61±2.394 |
37.42±3.687 |
32.4±0.709 |
54.5±3.118 |
|
480 |
43±0.284 |
45.6±2.821 |
47.8±4.173 |
47.4±4.457 |
56±0.497 |
|
540 |
52.96±2.359 |
56.2±3.462 |
54.91±3.805 |
50±0.497 |
59.8±0.706 |
|
600 |
58.15±1.211 |
58±1.346 |
59.4±1.981 |
53±1.764 |
62.5±3.044 |
|
660 |
60.6±3.749 |
61.9±3.185 |
63.5±3.251 |
54±1.907 |
67.8±2.407 |
|
720 |
65.12±1.206 |
65±1.345 |
69.6±1.974 |
55.8±0.704 |
69.5±0.358 |
In-vitro drug release profile of Clotrimazole cream from (F6-F10):
|
TIME |
FORMULATION CODE (Cumulative release %) |
||||
|
F6 |
F7 |
F8 |
F9 |
F10 |
|
|
0 |
0±0.000 |
0±0.000 |
0±0.000 |
0±0.000 |
0±0.000 |
|
10 |
0.7±1.276 |
0.7±1.275 |
0.7±0.358 |
5±1.487 |
1.6±1.485 |
|
20 |
1.82±2.498 |
1.7±2.195 |
1.16±1.049 |
2.2±1.415 |
2.3±1.417 |
|
30 |
2.7±2.619 |
2.7±2.686 |
1.97±1.995 |
3±0.639 |
3±0.635 |
|
45 |
4.2±0.142 |
3.9±4.950 |
3.92±2.044 |
4.1±1.065 |
4.2±1.062 |
|
60 |
5.3±1.768 |
5.2±2.688 |
5.4±0.849 |
5.07±0.878 |
5.05±0.874 |
|
90 |
7.4±0.708 |
7.2±5.021 |
6.39±2.772 |
7.23±2.185 |
7.24±2.183 |
|
120 |
8.8±3.395 |
8.7±4.668 |
7.67±3.285 |
8.62±4.024 |
8.62±4.024 |
|
150 |
11.2±4.526 |
11.2±3.748 |
8.78±3.416 |
10.8±5.447 |
10.8±5.445 |
|
180 |
18.6±4.876 |
17.8±1.699 |
11.07±2.275 |
14.3±2.756 |
14.3±2.759 |
|
210 |
24.2±1.556 |
22.7±5.236 |
16.07±4.392 |
19.2±3.185 |
19.2±3.182 |
|
240 |
29.3±3.819 |
27.5±4.948 |
19.8±4.524 |
27.55±1.8454 |
27.54±1.843 |
|
270 |
34.4±3.746 |
33.2±3.746 |
28.5±2.614 |
30.3±4.877 |
30.3±4.876 |
|
300 |
38.4±0.072 |
37.6±2.261 |
40.6±3.465 |
42.32±1.404 |
42.32±1.406 |
|
330 |
43.5±3.890 |
42.7±1.768 |
48.2±3.536 |
49.8±4.665 |
49.6±4.665 |
|
360 |
48.5±2.970 |
47.4±1.205 |
57.80±1.422 |
59.5±3.819 |
59.8±3.814 |
|
420 |
50.2±3.607 |
53.5±2.334 |
63.37±2.065 |
65±2.758 |
65±2.756 |
|
480 |
52.7±2.898 |
64.5±2.334 |
70.4±2.829 |
68±2.547 |
70±2.546 |
|
540 |
55.7±2.334 |
68.1±2.758 |
72.7±3.887 |
74±7.285 |
76±7.282 |
|
600 |
57.6±5.446 |
70.3±3.26 |
74.7±2.618 |
75±4.872 |
82±4.877 |
|
660 |
60.5±3.253 |
72.4±2.756 |
75.4±2.263 |
76.6±5.52 |
93.4±5.516 |
|
720 |
62.3±1.483 |
74.2±1.768 |
75.6±0.423 |
77.9±0.354 |
97.3±0.354 |
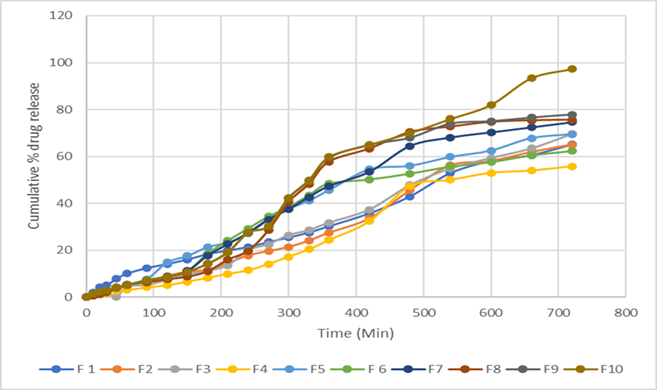
Figure No.6: In-Vitro diffusion profile of Formulation F1 to F10
Drug Release Kinetics:
In order to investigate the drug release mechanism, the drug release data fitted to models representing zero order, first order, higuchi square root of time and peppas model. The liner regression analysis are summarized in table no.6 The examination of co-efficient of determination (r2) values for different formulation indicated that drug release followed the zero order release pattern from creams. The release exponentvalue (n) for all formulation used to characterize the drug release mechanism and the obtained ‘n’ values (0.6737 to 0.8919) for all formulations was more than 0.5, which indicated that the drug release followed Non-Fickian diffusion mechanism. This might be due to swelling property of the polymer used in cream
Table No.6: Release Kinetic& Mechanism
|
Formulation code |
Zero order (R2) |
First order (R2) |
Higuchi (R2) |
Korsmeyer- Peppas 2 |
|
|
N |
(R ) |
||||
|
F1 |
0.987 |
0.957 |
0.915 |
0.672 |
0.971 |
|
F2 |
0.978 |
0.942 |
0.871 |
0.800 |
0.890 |
|
F3 |
0.989 |
0.957 |
0.890 |
0.821 |
0.877 |
|
F4 |
0.954 |
0.932 |
0.835 |
0.793 |
0.842 |
|
F5 |
0.975 |
0.991 |
0.955 |
0.840 |
0.910 |
|
F6 |
0.942 |
0.973 |
0.941 |
0.839 |
0.895 |
|
F7 |
0.975 |
0.978 |
0.926 |
0.868 |
0.892 |
|
F8 |
0.935 |
0.942 |
0.876 |
0.897 |
0.859 |
|
F9 |
0.946 |
0.953 |
0.897 |
0.836 |
0.893 |
|
F10 |
0.976 |
0.851 |
0.891 |
0.848 |
0.891 |
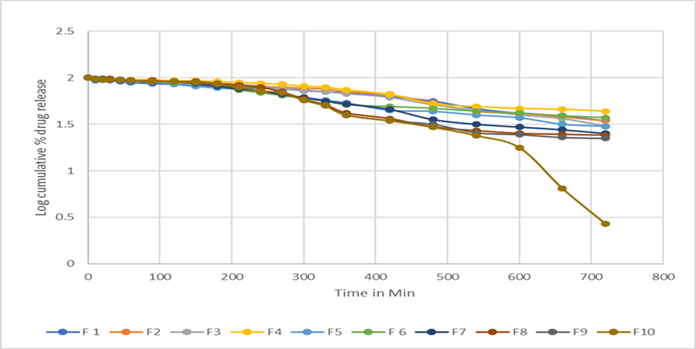
Figure No.7: First order release kinetics of F1 to F10
FigureNo.8: Higuchi kinetics of F1 to F10
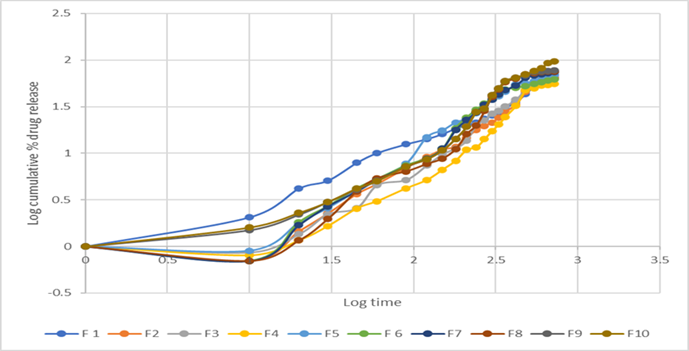
Figure No.9: Korsmeyer-Peppas kinetics of F1 to F1
In vitro antifungal activity
The anti-fungal activity of optimized formulation was examined to determine the most potent formula against candida fungus. Figure 10 demonstrated that optimized formulation has the most potent anti-fungal activity supported by a 12 mm inhibition zone diameter. This could be justified by the antifungal action may be due to the presence of surfactant and penetration enhancer.
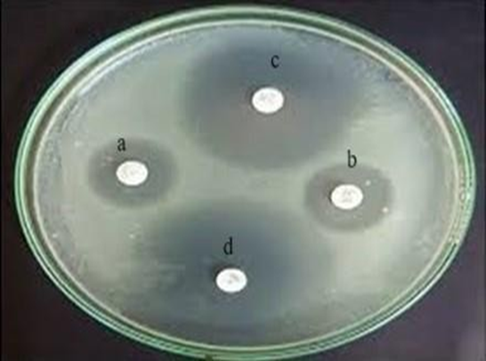
Fig No.10 In vitro antifungal activity.
|
a |
Blank |
|
b |
Placebo |
|
c |
clotrimazole |
|
d |
Optimized formulation |
Stability studies:-
Based on visual observation the optimized Clotrimazole cream (F10) for a period of 3 months. The optimized formulation (F10) was analyzed for clotrimazole content by UV spectrophotometer. The result showed that slight decrease in drug content was found when the Clotrimazole cream kept at 40±2°C for 3 months. Since the overall degradation was not more than 3%.
Table No.7: Stability study of Clotrimazole cream:
|
Sr. No. |
Time period for sampling |
Drug content (%) |
|
1. |
Initial |
96.5±1.475 |
|
2. |
After 1 month |
96.2±1.552 |
|
3. |
After 2 month |
95.7±0.853 |
|
4. |
After 3 month |
95.6±1.21 |
CONCLUSION
Topical route of application has a great potential as an effective and safe way to administer drug for its antifungal in effect. The concentration of emulsifying agent and permeation enhancer significantly affects the critical parameters of cream formulation cumulative amount release at 12 hours. In vitro permeation study showed that menthol enhanced the cumulative amount of drug from cream formulation. The topical cream formulation developed in this study showed the promising anti-fungal activity, further in vivo studies and can be extrapolated for further development in treatment of fungal disease.
REFERENCES


Shankrayya M, Gurubasavaraj A M T, Chaithra R P, Pradeep U, Evaluating the Impact of Formulation Parameters on Permeation of Clotrimazole from Topical Creams, Int. J. of Pharm. Sci., 2026, Vol 4, Issue 1, 1803-1814. https://doi.org/10.5281/zenodo.18298169
 10.5281/zenodo.18298169