Department of Pharmaceutics, Mewar University. Gangrar, Chittorgarh, Rajasthan-312901.
The objective of the current work was to formulate and evaluate sustained release matrix tablets of Glycopyrrolate and Formoterol. The tablet was prepared by wet granulation Method using Xanthan gum, Karaya gum and HPMC K100M. Compatibility studies between Drug and Excipients showed that DS showed no significant change. The FT-IR studies showed that there is no interaction between the drug and excipients, as all peaks corresponding to different functional groups of pure drug were present in the drug-excipient mixture. All the formulations and their mixture showed acceptable flow properties like angle of repose, bulk density, tapped density. Prepared tablets were found to be good in terms of post compression parameters and also passed out quality control evaluation parameters as per I.P limits. In vitro dissolution study revealed F4 as the most emperical formulation showing Glycopyrrolate release of 99.75% in 12 hours and Formoterol release of 98.45% in 12 hours. Thus based on the overall graphs it was found that the respective formulations F4 Glycopyrrolate were followed Peppas release kinetics mechanism whereas Formoterol was followed first orders Release Kinetics..
This exhibits that systemic deliveries are enabled through correct formulation design along with consideration of physiological factors governing traversing through gastrointestinal tract starting with formulation characteristics reaching to absorption through first pass metabolism leading to drug distribution which is critical to provide desirable safety and efficacy profile1,2. It has long been apparent to the Pharmaceutical industry that the benefits of having a single dosage of a drug with a protracted release period, rather than multiple doses is a clear one. The concept of constant or uniform blood level of a drug directly leads to better patient compliance and increased clinical efficacy of the drug for the prescription use3. Has drawn more attention towards development of sustained release or controlled release drug delivery systems4 because marketing of new drug entities is now cumbersome and costly. Requirement of sustained release is very common with the help of matrix system. It is the release system that varies and regulates the release of the dissolved or dispersed drug. A matrix is actually defined as a uniform combine of one or more medications with gelling agent i.e. hydrophilic polymers5. A drug absorption rate can be lowered by slowing the rate of release of the drug from the dosage form -- one of the more cryptic and counterintuitive outcomes of pharmaceutical research. Such formulated products are also known as sustained action, sustained release, delayed action, prolonged action, depot, respiratory, retarded release and timed release medication. 6,7 The findings that controlled drug delivery has therapeutics advantage has drawn more attention to the development of sustained or controlled drug delivery system during the past 30 years as the cost and complexity of marketing new entities has significantly increased. The research in the field is one that has been very fertile and geneally the field is also relatively new. For most drugs, the desired outcome is to maintain a steady state blood concentration that is therapeutically effective and non-toxic over an extended period of time. Dosage form design is a crucial parameter for fulfilling such purpose. Introduction: Sustained release, sustained action, prolonged action, controlled release extended action, timed release and depot dosage form are term used to identify drug delivery system that are designed to achieve prolonged therapeutic effect by continuously releasing medication over an extended period of time after administration of a single dose. For an oral sustained released dosage form, it is few hours based on residence time of formulation in,GIT. Traditional medication regimen necessitates periodic administration of therapeutic agents. These agents are designed for optimal stability, activity and bioavailability. While conventional methods of drug administration work for most drugs, there are exceptions, and some therapeutics are unstable or toxic compounds that exist in narrow therapeutic ranges. Drugs are also solubility challenged. Stable plasma levels of therapeutic agent are desired in such cases and, therefore, a continuous administration method is desirable. 8
Objective
The aim of this study is decreasing the dose frequency of Glycopyrrolate and Formoterol. Hence, its duration of action is increased and adverse effects are decreased by Sustained release dosage form.
Objectives’ of the work
To develop sustained release tablets of glycopyrrolate and formoterol for the management of chronic obstructive pulmonary disease (COPD), comprising of chronic bronchitis and emphysema.
To prepare sustained release tablets by using various polymers, such as Xanthan gum, Karaya gum and HPMC K100M. To assess pre and post compression evaluation parameters To do FTIR compatibility studies (drug and excipient compatibility studies).
To develop and improve Bioavailability of sustained release tablets of Glycopyrrolate and Formoterol.
Research Design
Table 3.1: List of Equipment used.
|
Name of the Equipment |
Manufacturer |
|
Weighing Balence |
Sartourius |
|
Tablets compression Machine (Multistation) |
Lab press limited, India |
|
Hardness tester |
Monsanto, Mumbai, India. |
|
Vernier callipers |
Mitutoyo, Japan. |
|
Roche Friabilator |
Labindia, Mumbai, India. |
|
Dissolution Apparatus |
Labindia, Mumbai, India. |
|
UV-Visible Spectrophotometer |
Labindia, Mumbai, India. |
|
pH meter |
Labindia, Mumbai, India. |
|
FT-IR Spectrophotometer |
Bruker, Alpha |
Table 3.2: List of Materials Used
|
Name of the material |
Source/Materials used |
Role of material |
|
Glycopyrrolate and Formoterol |
Procured From Cipla. Provided by SURA LABS, Dilsukhnagar, Hyderabad |
Anticholinergic and Bronchodilator |
|
Xanthan gum |
Sigma Aldrich. |
Binder |
|
Karaya gum |
Sigma Aldrich. |
thickener |
|
HPMC K100M |
Merck specialities Pvt Ltd, Mumbai, India |
water binding and retention |
|
Talc |
Merck specialities Pvt Ltd, Mumbai, India |
Lubricant |
|
Magnesium strearate |
Chemika-Biochemika-Reagents, Mumbai, Maharashtra, India |
Anti-adherent |
|
Lactose |
Chemika-Biochemika-Reagents, Mumbai, Maharashtra, India |
Diluent |
100mg of Glycopyrrolate and Formoterol pure drug was dissolved in 15 ml of Methanol and make up to 1000ml with 0.1N HCL (stock solution-1). 10ml of above solution was taken and make up with 100ml by using 0.1N HCL (stock solution -2 i.e 100µg/ml). From this 10 ml was taken and make up with 100 ml of 0.1 N HCL (10µg/ml). Scan the 10µg/ml using Double beam UV/VIS spectrophotometer in the range of 200-400nm.9
100mg of Glycopyrrolate and Formoterol pure drug was dissolved in 15ml of Methanol and volume make up to 100ml with 0.1N HCL (Stock solution-1). 10ml of above solution was taken and male up with 100ml by using 0.1N HCL Glycopyrrolate and Formoterol (Stock solution-2 i.e 100µ/ml). From this take 0.5, 1.0, 1.5, 2.0 and 2.5ml of solution and make up to 10 ml 0.1N HCL to obtain 5, 10, 15, 20, and 25 µg/ml of Levo sulpiride per ml of solution. The absorbance of the above dilutions was measured at 222nm and 209nm by using UV- Spectrophotometer taking 0.1N HCL as blank. Then a graph was plotted by taking Concentration on X-Axis and Absorbance on Y-Axis Which gives a straight line Linearity of standard curve was assessed from the square of correlation coefficient (R2) Which determined by least-square linear regression analysis. The above was procedure was repeated by using pH 4.8 Acidic buffer solutions.
All the formulations were prepared by wet granulation Method. The compositions of different formulations are given in the Table 7.1. The tablets were prepared as per the procedure given below and aim is to prolong the release of Levo sulpiride.
Procedure:
Table 7.1: Formulation of Sustained release tablets
|
Ingredients’ |
Role of ingredient in formulation |
F1 |
F2 |
F3 |
F4 |
F5 |
F6 |
F7 |
F8 |
F9 |
|
Glycopyrrolate (mcg) |
Anticholinergic. |
25 |
25 |
25 |
25 |
25 |
25 |
25 |
25 |
25 |
|
Formoterol (mcg) |
Bronchodilator. |
12 |
12 |
12 |
12 |
12 |
12 |
12 |
12 |
12 |
|
Xanthan gum (mg) |
Binder |
10 |
20 |
30 |
- |
- |
- |
- |
- |
- |
|
Karaya gum (mg) |
thickener |
- |
- |
- |
10 |
20 |
30 |
- |
- |
- |
|
HPMC K100M (mg) |
water binding and retention |
- |
- |
- |
- |
- |
- |
10 |
20 |
30 |
|
Talc (mg) |
Lubricant |
5 |
5 |
5 |
5 |
5 |
5 |
5 |
5 |
5 |
|
Magnesium Stearate (mg) |
Anti-adherent |
5 |
5 |
5 |
5 |
5 |
5 |
5 |
5 |
5 |
|
Lactose (mg) |
Diluent |
67.96 |
47.96 |
17.96 |
67.96 |
47.96 |
17.96 |
67.96 |
47.96 |
17.96 |
|
Total weight (mg) |
|
100 |
100 |
100 |
100 |
100 |
100 |
100 |
100 |
100 |
4.3.1 Pre-Compression parameters Bulk density (DB)
Bulk density is the ratio between a given mass of the powder and its bulk volume.
Bulk density = Mass of powder / Bulk volume of the powder Bulk density (DB) = W/V0
Procedure: An accurately weighed quantity of granules (w) (which was previously passed through sieve NO: 40) was carefully transferred into 250ml measuring cylinder and measure the bulk volume.
Tapped Density (DT)
Tapped density is the ratio between a given mass of powder (or) granules and the constant (or) fixed volume of powder or granules after tapping.
Tapped density = mass of the powder / tapped volume
Procedure: An accurately weighed quantity of granules(w) (which was previously passed through sieve No:40) was carefully transferred into 250ml measuring cylinder and the cylinder was tapped on a wooden surface from the height of 2.5cm at two second intervals. The tapping was continued until no further change in the volume (until a constant volume) was obtained (Vf). The tapped density was calculated by using the formula
Tapped density (DT) = W/Vf Hausner’s ratio
Hausner;s ratio is an indirect index of ease of powder flow and was calculated by the formula,
Hausner’s ratio = DT/DB
Where, DT is the tapped density DB is the bulk density
Compressibility index
Compressibility index (CI) 61 was determined by measuring the initial volume (V0) and final volume (Vf)) after hundred tapping’s of a sample in a measuring cylinder . It indicates the powder flow properties and expressed in term of percentage and given in table and calculated by using the formula
% Compressibility index = V0 –V/V0 x 100
Angle of repose
Angle of repose was measured by fixed funnel method. It determines flow property of the powder. It is defined as maximum angle formed between the surface of the pile of powder and the horizontal plane.10 The powder was allowed to flow through the funnel fixed to stand at definite height (h). By measuring the height and radius of the heap of powder formed (r), angle of repose was calculated by using formula given below and the calculated values obtained was shown in table .
? = tan-1 (h/r) Where, ? is the angle of repose h is the height in cm
r is the radius in cm
Flow property
Table No.7.2 The flow property of powder blend
|
Flow property |
Angle of repose |
Compressibility index (%) |
Hausner’s ratio |
|
Excellent |
25-30 |
<10> |
1.00-1.11 |
|
Good |
31-35 |
11-15 |
1.12-1.18 |
|
Fair |
36-40 |
16-20 |
1.19-1.25 |
|
Passable |
41-45 |
21-25 |
1.26-1.34 |
|
Poor |
46-55 |
26-31 |
1.35-1.45 |
|
Very poor |
56-65 |
32-37 |
1.46-1.59 |
|
Very very poor |
>66 |
>38 |
>1.60 |
Table 7.3 IP standards of uniformity of weight
|
S. No |
Average weight of tablet |
% of deviation |
|
1 |
? 80 mg |
10 |
|
2 |
> 80 mg to <250> |
7.5 |
|
3 |
? 250 mg |
5 |
Friability test
Twenty tablets were weighed and subjected to drum of friability test apparatus. The drum rotated at a speed 25 rpm. The friabilator was operated for 4 minutes and reweighed the tablets % loss (F) was calculated by the following formula
F = 100(W0-W)/W0
Where W0 = Initial weight, W= Final weight
Hardness test
The hardness of tablets was measured by using Monsanto hardness tester. The results were complies with IP specification.
Thickness test
The rule of physical dimension of the tablets such as sizes and thickness is necessary for consumer acceptance and maintain tablet uniformity. The dimensional specifications were measured by using screw gauge. The thickness of the tablet is mostly related to the tablet hardness can be used as initial parameter.11
Drug content
The amount of drug in tablet was important for to monitor from tablet to tablet, and batch to batch is to evaluate for efficacy of tablets. For this, taken ten tablets from each batch were weighed and powdered. Weighed equivalent to the average weight of the tablet powder and transferred into a 100 ml volumetric flask and dissolved in a suitable quantity of media. The solution was made up to mark and mixed well. Then filter the solution. A portion of the filtrate sample was analyzed by UV spectrophotometer.12
In vitro drug release studies
Apparatus -- USP-II, Paddle Method
Dissolution Medium -- 0.1N HCL, p H 6.8 Phosphate buffer
RPM – 50
Sampling intervals(hrs)-1,2,3,4,5,6,7,8,9,10,11,12
Temperature -- 37º c ± 0.5ºc
Procedure:
900ml of 0.1 N HCL was placed in vessel and the USP apparatus –II (Paddle Method) was assembled. The media was allowed to equilibrate to temp of 37ºC± 0.5ºC. Tablet was placed in the vessel and apparatus was operated for 2 hours. Then 0.1 N HCL was replaced with pH 6.8 phosphate buffer and process was continued up to 24hrs at 50rpm. At specific time intervals, with drawn 5 ml of sample and again 5ml media was added to maintain the sink condition. Withdrawn samples were analyzed at 222nm and 209nm wavelength of drug using UV- spectrophotometer.
7.4 Application of Release Rate Kinetics to Dissolution Data
Various models were tested for explaining the kinetics of drug release. To analyze the mechanism of the drug release rate kinetics of the dosage form, the obtained data were fitted into zero-order, first order, Higuchi, and Korsmeyer -Peppas release model.
Zero order release rate kinetics:
To study the zero-order release kinetics the release rate data are fitted to the following equation.
F = K0 t
Where, ‘F’ is the drug release at time ‘t’ , and ‘K0’ is the zero order release rate constant. The plot of % drug release versus time is linear.
First order release rate kinetics: The release rate data are fitted to the following equation
Log (100-F) = kt
A plot of log cumulative percent of drug remaining to be released vs. time is plotted then it gives first order release.
Higuchi release model: To study the Higuchi release kinetics, the release rate data were fitted to the following equation.
F= k t1/2
Where, ‘k’ is the Higuchi constant.
In higuchi model, a plot of % drug release versus square root of time is linear.
Korsmeyer and Peppas release model:
The mechanism of drug release was evaluated by plotting the log percentage of drug released versus long time according to Korsmeyer-Pappas equation. The exponent ‘n’ indicates the mechanism of drug release calculated through the slope of the straight line.
Mt/M? = K tn
Where, Mt/M? is fraction of drug release at time ‘t’, k represents a constant, and ‘n’ is the diffusional exponent, which characterizes the type of release mechanism during the dissolution process. For non-Fickian release, the value of n falls between 0.5 and 1.0; while in case of Fickian diffusion, n = 0.5; for zero-order release (case I I transport), n=1; and for supercase II transport, n>1. In this model, a plot of long (Mt/M?) versus long (time) is linear.
7.5. Drug – Excipient compatibility studies
Fourier Transform Infrared (FTIR) spectroscopy:
Drug excipient interaction studies are significant for the successful formulation of every dosage form. Fourier Transform Infrared (FTIR) Spectroscopy studies were used for the assessment of physicochemical compatibility and interactions, which helps in the prediction of interaction between drug and other excipients. In the current study 1:1 ratio was used for preparation of physical mixtures used for analyzing of compatibility studies. FT-IR studies were carried out with a Bruker, ATR FTIR facility using direct sample technique.
The present work was designed to develop sustained tablets of Glycopyrrolate and Formoterol using various polymers. All the formulations were evaluated for physicochemical properties and in vitro drug release studies.
The scanning of the 10µg/ml solution of Glycopyrrolate and Formoterol the ultraviolet range (200-400nm) against 0.1 N HCL the maximum peak observed at ?max as 222nm and 209nm. The standard concentration of Glycopyrrolate and Formoterol (5-25 µg/ml) was prepared in 0.1N HCL showed good linearity with R2 value of 0.999, which suggests that it obeys the Beer-Lamberts law.
Table 8.1: Standard curve of Glycopyrrolate and Formoterol 0.1N HCL
|
Concentration (µg/ mL) |
Absorbance (Glycopyrrolate) |
Absorbance (Formoterol) |
|
0 |
0 |
0 |
|
5 |
0.149 |
0.162 |
|
10 |
0.309 |
0.291 |
|
15 |
0.472 |
0.442 |
|
20 |
0.649 |
0.581 |
|
25 |
0.816 |
0.745 |
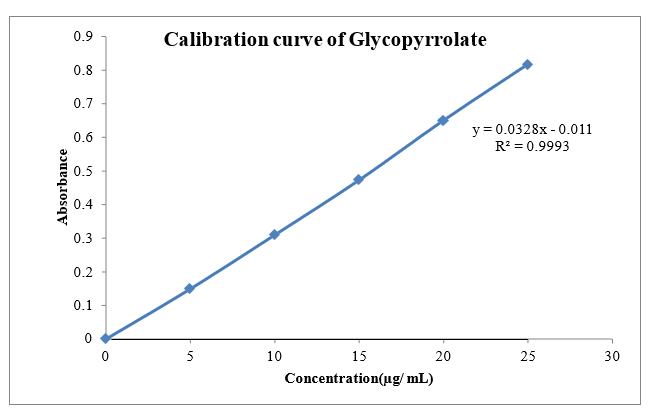
Fig 8.1: Calibration curve of Glycopyrrolate 0.1N HC1 at 222 nm
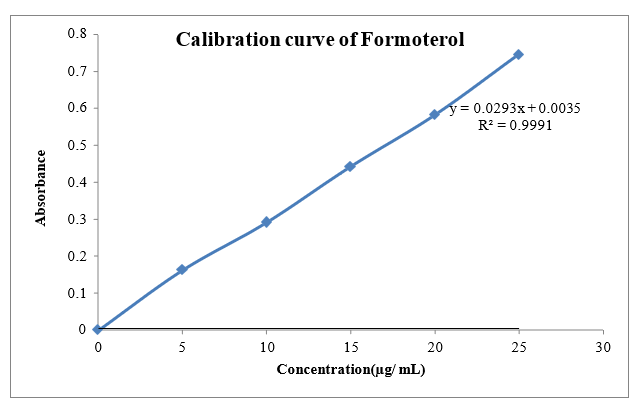
Fig 8.2: Calibration curve of Formoterol 0.1N HC1 at 209 nm
The scanning of the 10 µg/ml solution of Glycopyrrolate and Formoterol the ultraviolet range (200-400nm) against 6.8 pH phosphate the maximum peak observed at the ?max as 222nm and 209nm. The standard concentrations of Glycopyrrolate showed good linearity with R2 value of 0.998 and Formoterol (5-25µg/ml) showed good linearity with R2 value of 0.997 prepared in 6.8 pH phosphate buffer, which suggests that it obeys the Beer-Lamberts law.
Table 8.2: Standard curve of Glycopyrrolate and Formoterol Phosphate buffer pH 6.8
|
Concentration (µg / ml) |
Absorbance (Glycopyrrolate) |
Absorbance (Formoterol) |
|
0 |
0 |
0 |
|
5 |
0.158 |
0.165 |
|
10 |
0.343 |
0.295 |
|
15 |
0.535 |
0.415 |
|
20 |
0.722 |
0.562 |
|
25 |
0.914 |
0.682 |
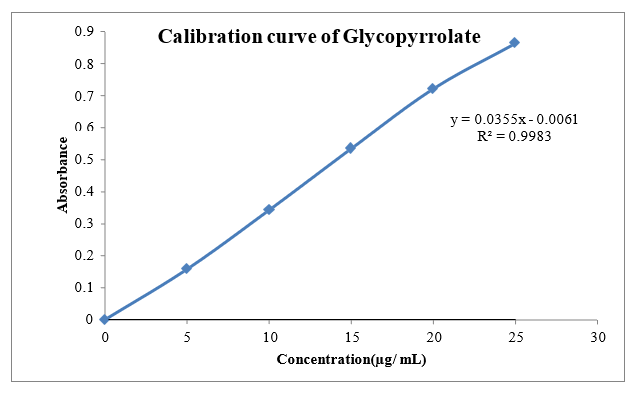
Fig.8.3: Calibration of Glycopyrrolate Phosphate buffer pH 6.8
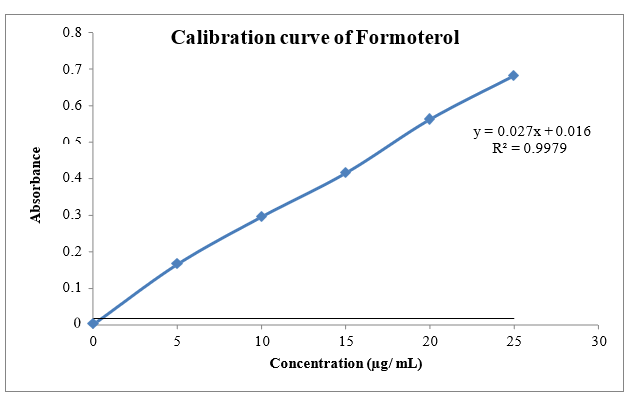
Fig.8.4: Calibration of Formoterol Phosphate buffer pH 6.8
Table 8.3: Pre-compression parameters of powder blend
|
Formulation Code |
Angle of Repose |
Bulk density (gm/ml) |
Tapped density (gm/ml) |
Carr’s index (%) |
Hausner’s Ratio |
|
F1 |
29.73±0.02 |
0.449±0.05 |
0.518±0.06 |
13.32±0.02 |
1.15±0.03 |
|
F2 |
30.96±0.06 |
0.405±0.05 |
0.468±0.06 |
13.46±0.01 |
1.15±0.04 |
|
F3 |
32.01±0.04 |
0.409±0.04 |
0.478±0.07 |
14.43±0.02 |
1.16±0.02 |
|
F4 |
28.01± 0.04 |
0.469±0.04 |
0.525±0.08 |
10.66±0.02 |
1.11±0.03 |
|
F5 |
26.32 0.06 |
0.45±0.08 |
0.548±0.02 |
17.88±0.03 |
1.21±0.02 |
|
F6 |
27.07±0.02 |
0.471±0.04 |
0.569±0.02 |
17.22±0.02 |
1.20±0.04 |
|
F7 |
25.17±0.03 |
0.459±0.02 |
0.570±0.02 |
19.47±0.02 |
1.24±0.01 |
|
F8 |
29.98±0.01 |
0.458±0.01 |
0.54±0.011 |
15.18±0.02 |
1.17±0.03 |
|
F9 |
23.75 ±0.01 |
0.446±0.05 |
0.539±0.09 |
17.25±0.07 |
1.20±0.02 |
Tablet powder blend was subjected to various pre-compression parameters. The angle of repose values was showed from 26.32 0.06 to 32.01±0.04; it indicates that the powder blend has good flow properties. The bulk density of all the formulations was found to be in the range of 0.405±0.05 to 0.471±0.04 (gm/cm3) showing that the powder has goof flow properties. The tapped density of all the formulations was found to be in the range of 0.468±0.06 to 0.570±0.02 showing the powder has good flow properties. The compressibility index of all the formulations was found to ranging from 10.66±0.02 to 19.47±0.02 which showed that the powder has good flow properties. All the formulations were showed the Hausner ratio ranging from 1.11±0.03 to 1.24±0.01 indicating the powder has good flow properties.
Table.8.4: Post Compression Parameters of tablets
|
Formulation codes |
Weight variation (mg) |
Hardness (kg/cm2) |
Friability (%loss) |
Thickness (mm) |
Drug content (%) |
|
F1 |
148.37 |
5.67±0.84 |
0.37 |
3.25±0.22 |
98.72 |
|
F2 |
149.91 |
5.51±0.47 |
0.56 |
3.68±0.18 |
97.88 |
|
F3 |
147.88 |
5.62±0.55 |
0.48 |
3.75±0.47 |
99.62 |
|
F4 |
150.05 |
5.48±0.38 |
0.44 |
3.98±0.71 |
100.02 |
|
F5 |
146.53 |
5.66±0.22 |
0.58 |
3.55±0.38 |
98.96 |
|
F6 |
149.78 |
5.58±0.49 |
0.42 |
3.62±0.26 |
99.57 |
|
F7 |
147.62 |
5.45±0.96 |
0.61 |
3.48±0.55 |
97.34 |
|
F8 |
148.58 |
5.61±0.44 |
0.54 |
3.71±0.48 |
98.87 |
|
F9 |
146.86 |
5.58±0.82 |
0.39 |
3.48±0.66 |
99.66 |
Weight variation and thickness13: all the formulations were evaluated for uniformity of weight using electronic weighing balance and the results are shown in table 8.4.The average tablet weight of all the formulations was found to be between 146.53 to 150.05. The maximum allowed percentage weight variation for tablets weighing >150 mg is 5% and no formulations are not exceeding this limit. Thus all the formulations were found to comply with the standards given in I.P and thickness of all the formulations was also complying with the standards that were found to be between 3.25±0.22 to 3.98±0.71.
Hardness and friability14: all the formulations were evaluated for their hardness, using Monsanto hardness tester and the results are shown in table. The average hardness for all the formulations was found to be between (5.45±0.96 to 5.67±0.84) kg/cm2 which was found to be acceptable.
Friability was determined to estimate the ability of the tablets to withstand the abrasion during packing, handling and transporting. All the formulations were evaluated for their percentage friability using Roche friabilator and the results were shown in table .The average percentage friability for all the formulations were between 0.37 and 0.61, which was found to be within the limit.
Drug content15: All the formulations were evaluated for drug content according to the procedure described in the methodology section and the results were shown in table. The drug content values for all the formulations were found to in range of (97.88 to 100.02). According to IP standards the tablets must contain not less than 95% and not more than 105% of the stated amount of the drug. Thus, all the FDT formulations comply with the standards given in IP.
In vitro drug release studies16:
The formulations prepared with different polymers by wet granulation Method. The tablets dissolution study was carried out in paddle dissolution apparatus using 0.1 N HCL for 2 hr and 6.8 pH phosphate buffer for remaining hours as a dissolution medium.
Table 8.5: Dissolution Data of Glycopyrrolate Tablets
|
TIME (hr) |
Cumulative Percentage Drug Released |
||||||||
|
F1 |
F2 |
F3 |
F4 |
F5 |
F6 |
F7 |
F8 |
F9 |
|
|
0 |
0 |
0 |
0 |
0 |
0 |
0 |
0 |
0 |
0 |
|
1 |
7.26 |
8.17 |
9.32 |
10.18 |
8.15 |
9.52 |
8.26 |
10.26 |
8.98 |
|
2 |
14.11 |
17.02 |
16.12 |
18.69 |
15.37 |
17.01 |
14.11 |
15.22 |
19.66 |
|
3 |
22.73 |
25.26 |
23.52 |
25.78 |
29.88 |
27.91 |
25.73 |
20.75 |
24.35 |
|
4 |
31.47 |
32.52 |
30.54 |
39.91 |
34.25 |
33.36 |
38.47 |
33.15 |
37.28 |
|
5 |
39.06 |
43.57 |
38.65 |
42.27 |
46.71 |
41.58 |
44.06 |
45.73 |
41.63 |
|
6 |
48.25 |
49.31 |
45.25 |
48.13 |
56.19 |
51.11 |
55.25 |
54.69 |
45.26 |
|
7 |
56.09 |
52.25 |
55.05 |
56.96 |
63.47 |
58.23 |
64.09 |
62.05 |
56.96 |
|
8 |
61.29 |
59.25 |
58.77 |
65.33 |
72.59 |
68.88 |
71.29 |
67.32 |
60.19 |
|
9 |
68.36 |
63.01 |
66.95 |
72.67 |
75.28 |
73.43 |
78.36 |
74.77 |
68.24 |
|
10 |
72.28 |
69.19 |
72.18 |
77.89 |
78.76 |
82.57 |
81.28 |
79.67 |
75.58 |
|
11 |
80.47 |
76.63 |
83.22 |
86.17 |
87.08 |
86.72 |
85.47 |
81.65 |
79.44 |
|
12 |
88.96 |
85.28 |
92.52 |
99.75 |
90.39 |
|
97.21 |
88.12 |
83.97 |
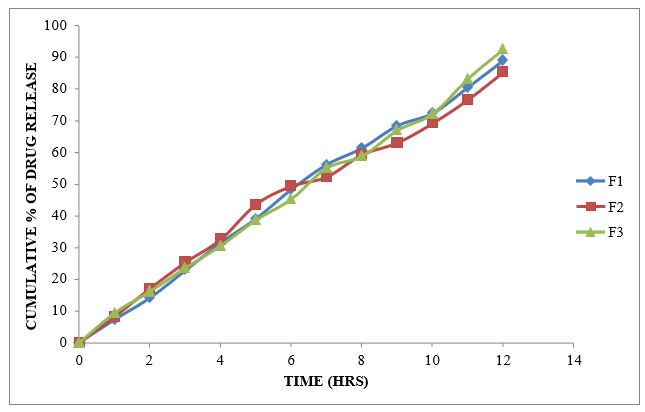
Figure 8.5: Dissolution study of Glycopyrrolate Sustained Release tablets (F1 to F3)
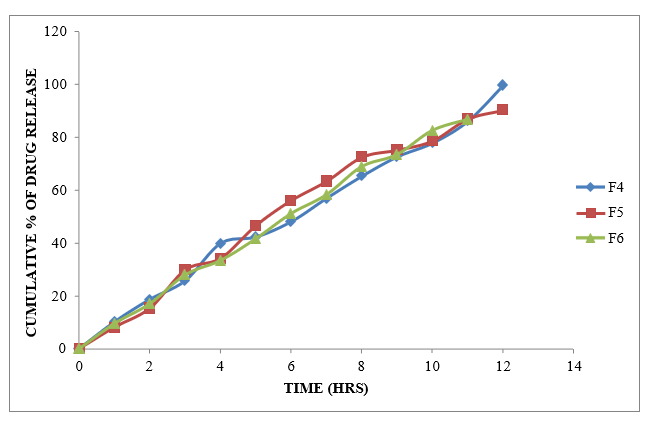
Figure 8.6: Dissolution study of Glycopyrrolate tablets (F4 to F6)
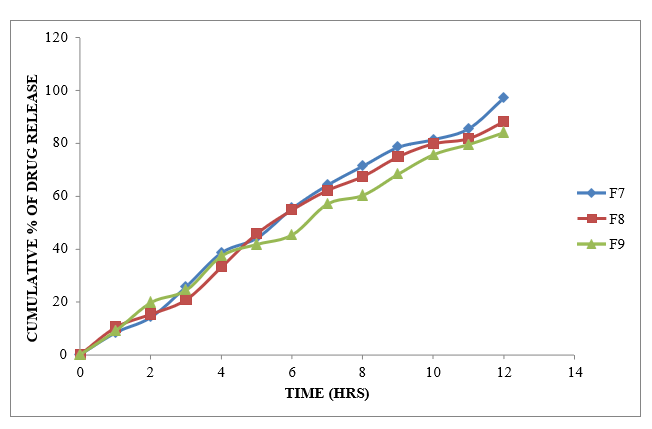
Figure 8.7: Dissolution study of Glycopyrrolate tablets (F7-F9)
From the dissolution data it was evident that the formulations prepared with Xanthan gum as polymer were able to retard the drug release up to desired time period i.e., 12 hours. Formulations prepared with Karaya gum retarded the drug release in the concentration of 10 mg (F4 Formulation) showed required release pattern i.e., retarded the drug release up to 12 hours and showed maximum of 99.75 % in 12 hours with good retardation. The formulations prepared with HPMC K100M were able to retard up to 12 hours. Among all the formulations F4 formulation containing (Drug: Karaya gum) 1:1 ratio showed maximum % drug release i.e. 99.75 % at 12 hr.
Table 8.6: Dissolution Data of Formoterol Tablets
|
TIME (hr) |
Cumulative Percentage Drug Released |
||||||||
|
F1 |
F2 |
F3 |
F4 |
F5 |
F6 |
F7 |
F8 |
F9 |
|
|
0 |
0 |
0 |
0 |
0 |
0 |
0 |
0 |
0 |
0 |
|
1 |
14.81 |
10.36 |
9.10 |
19.83 |
16.40 |
12.36 |
18.38 |
16.21 |
15.31 |
|
2 |
18.92 |
15.20 |
13.90 |
26.13 |
19.69 |
15.41 |
26.45 |
20.07 |
25.03 |
|
3 |
22.73 |
20.92 |
18.45 |
30.02 |
26.72 |
23.92 |
29.59 |
25.17 |
28.12 |
|
4 |
36.12 |
30.63 |
25.20 |
46.71 |
39.55 |
34.77 |
38.83 |
38.56 |
36.13 |
|
5 |
46.29 |
40.15 |
34.99 |
50.42 |
44.90 |
38.93 |
44.26 |
41.58 |
38.09 |
|
6 |
53.95 |
47.50 |
40.43 |
58.60 |
53.46 |
49.81 |
55.15 |
50.27 |
49.17 |
|
7 |
58.19 |
56.32 |
52.11 |
60.25 |
56.86 |
52.46 |
66.29 |
56.68 |
50.24 |
|
8 |
65.14 |
61.74 |
56.72 |
69.35 |
64.30 |
60.22 |
69.76 |
64.37 |
65.36 |
|
9 |
70.10 |
68.55 |
60.23 |
76.92 |
70.12 |
66.95 |
75.27 |
73.77 |
69.81 |
|
10 |
76.02 |
71.30 |
68.98 |
81.80 |
76.09 |
73.15 |
76.19 |
78.42 |
70.63 |
|
11 |
86.81 |
82.71 |
78.48 |
93.16 |
86.41 |
80.60 |
87.64 |
81.12 |
75.43 |
|
12 |
91.39 |
89.89 |
86.02 |
98.45 |
93.93 |
83.21 |
93.49 |
89.28 |
89.19 |
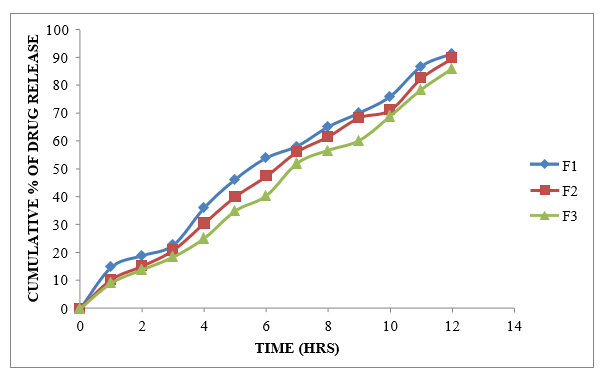
Figure 8.8: Dissolution study of Formoterol Sustained Release tablets (F1 to F3)
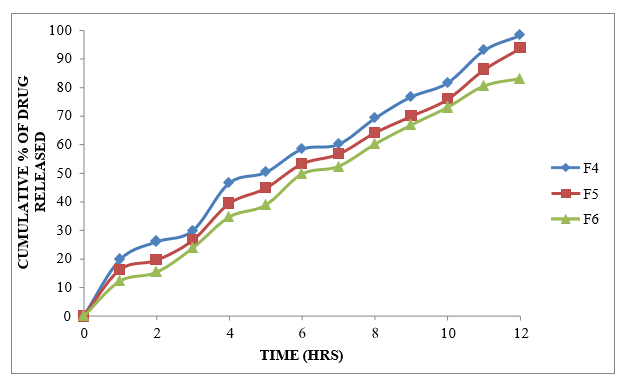
Figure 8.9: Dissolution study of Formoterol Sustained Release tablets (F4 to F6)
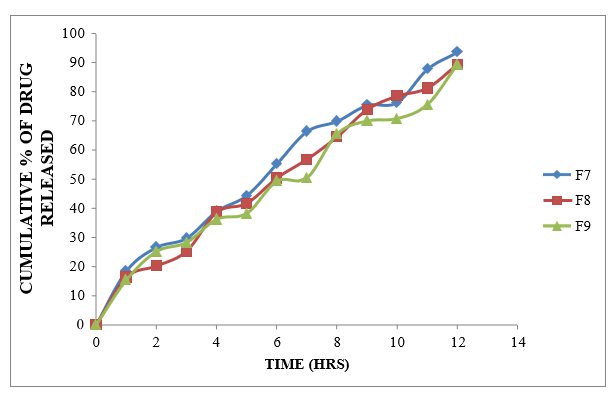
Figure 8.10: Dissolution study of Formoterol Sustained Release tablets (F7 to F9)
Different formulations (F1-F9) were prepared using different polymers like Xanthan gum, Karaya gum and HPMC K100M alone at different ratios. Formulations F1-F3 were prepared using Xanthan gum at the ratio of 1:1, 1:2 and 1:3 which showed the drug release about 91.39 % at 11h, 89.89% at 12h and 86.02at 12h %. Formulations F4-F6 were prepared using Karaya gum at the ratio of 1:1, 1:2 and 1:3 with the drug release of 98.45%, 93.93% and 83.21% and the formulations F7-F9 were prepared by using HPMC K100M polymer at the ratio of 1:1, 1:2 and 1:3 Showed the drug release of 93.49%, 89.28% and 89.19 % at the end of 12 h. Among all these formulations F4 was selected as the best ideal formulation which exhibited Glycopyrrolate 99.75% of drug release in 12 hours and Formoterol 98.45% of drug release in 12 hours. Finally Concluded that F4 formulation was considered as optimized formulation.
Data of in vitro release studies of formulations which were showing better drug release were fit into different equations to explain the release kinetics of Glycopyrrolate release from sustained tablets. The data was fitted into various kinetic models such as zero, first order kinetics, Higuchi and Korsmeyer peppas mechanisms and the results were shown in the below table.
|
Cumulative (%) Releaseq |
Time ( T ) |
Root (T) |
Log(%) Release |
Log ( T ) |
Log (%) Remain |
Release Rate (Cumulae %Relee/ T) |
1/Cum% Release |
Peppas Log Q/100 |
% Drg Remaining |
Q01/3 |
Qt1/3 |
Q01/3- Qt1/3 |
|
0 |
0 |
0 |
|
|
2.000 |
|
|
|
100 |
4.642 |
4.642 |
0.000 |
|
10.18 |
1 |
1.000 |
1.008 |
0.000 |
1.953 |
10.180 |
0.0982 |
-0.992 |
89.82 |
4.642 |
4.478 |
0.163 |
|
18.69 |
2 |
1.414 |
1.272 |
0.301 |
1.910 |
9.345 |
0.0535 |
-0.728 |
81.31 |
4.642 |
4.332 |
0.309 |
|
25.78 |
3 |
1.732 |
1.411 |
0.477 |
1.871 |
8.593 |
0.0388 |
-0.589 |
74.22 |
4.642 |
4.202 |
0.439 |
|
39.91 |
4 |
2.000 |
1.601 |
0.602 |
1.779 |
9.978 |
0.0251 |
-0.399 |
60.09 |
4.642 |
3.917 |
0.725 |
|
42.27 |
5 |
2.236 |
1.626 |
0.699 |
1.761 |
8.454 |
0.0237 |
-0.374 |
57.73 |
4.642 |
3.865 |
0.777 |
|
48.13 |
6 |
2.449 |
1.682 |
0.778 |
1.715 |
8.022 |
0.0208 |
-0.318 |
51.87 |
4.642 |
3.729 |
0.912 |
|
56.96 |
7 |
2.646 |
1.756 |
0.845 |
1.634 |
8.137 |
0.0176 |
-0.244 |
43.04 |
4.642 |
3.504 |
1.137 |
|
65.33 |
8 |
2.828 |
1.815 |
0.903 |
1.540 |
8.166 |
0.0153 |
-0.185 |
34.67 |
4.642 |
3.261 |
1.381 |
|
72.67 |
9 |
3.000 |
1.861 |
0.954 |
1.437 |
8.074 |
0.0138 |
-0.139 |
27.33 |
4.642 |
3.012 |
1.629 |
|
77.89 |
10 |
3.162 |
1.891 |
1.000 |
1.345 |
7.789 |
0.0128 |
-0.109 |
22.11 |
4.642 |
2.807 |
1.835 |
|
86.17 |
11 |
3.317 |
1.935 |
1.041 |
1.141 |
7.834 |
0.0116 |
-0.065 |
13.83 |
4.642 |
2.400 |
2.241 |
|
99.75 |
12 |
3.464 |
1.999 |
1.079 |
-0.602 |
8.313 |
0.0100 |
-0.001 |
0.25 |
4.642 |
0.630 |
4.012 |
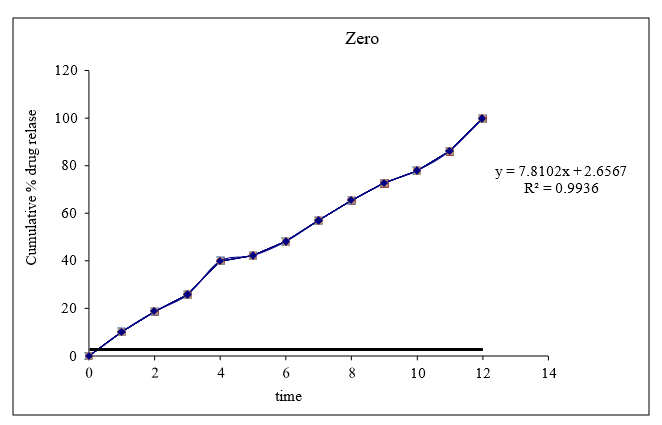
Figure 8.11: Graph of zero order kinetics
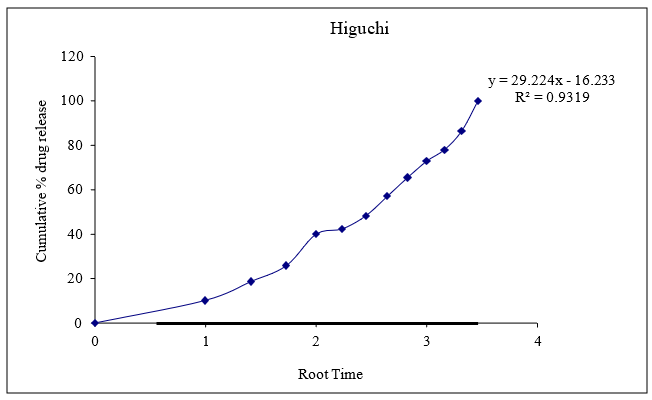
Figure 8.12: Graph of Higuchi release kinetics
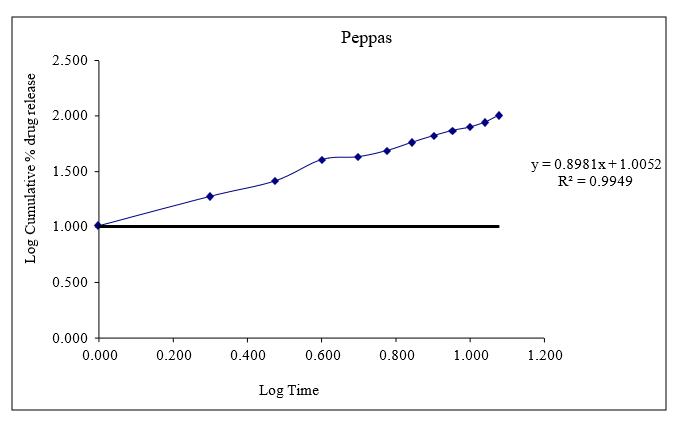
Figure 8.13: Graph of peppas release kinetics
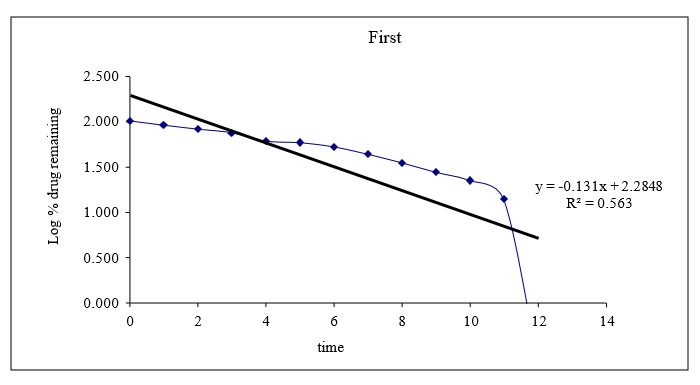
Figure 8.14: Graph of first order release kinetics
Based on the data above results the optimized formulation followed Kors mayer Peppas Release Kinetics. Application of Release Rate Kinetics to Dissolution Data (Formoterol)
Data of in vitro release studies of formulations which were showing better drug release were fit into different equations to explain the release kinetics of Formoterol release from sustained tablets. The data was fitted into various kinetic models such as zero, first order kinetics, Higuchi and Korsmeyer peppas mechanisms and the results were shown in the below table.
Table 8.8: Release Kinetics data for optimized formulation (F4)
|
CUMULATIVE (%) RELEASE Q |
TIME ( T ) |
ROOT (T) |
LOG( %) RELEASE |
LOG ( T ) |
LOG (%) REMAIN |
RELEASE RATE (CUMULATIVE % RELEASE / T) |
1/CUM% RELEASE |
PEPPAS Log Q/100 |
% Drug Remaining |
Q01/3 |
Qt1/3 |
Q01/3- Qt1/3 |
|
0 |
0 |
0 |
|
|
2.000 |
|
|
|
100 |
4.642 |
4.642 |
0.000 |
|
19.83 |
1 |
1.000 |
1.297 |
0.000 |
1.904 |
19.830 |
0.0504 |
-0.703 |
80.17 |
4.642 |
4.312 |
0.330 |
|
26.13 |
2 |
1.414 |
1.417 |
0.301 |
1.868 |
13.065 |
0.0383 |
-0.583 |
73.87 |
4.642 |
4.196 |
0.446 |
|
30.02 |
3 |
1.732 |
1.477 |
0.477 |
1.845 |
10.007 |
0.0333 |
-0.523 |
69.98 |
4.642 |
4.121 |
0.521 |
|
46.71 |
4 |
2.000 |
1.669 |
0.602 |
1.727 |
11.678 |
0.0214 |
-0.331 |
53.29 |
4.642 |
3.763 |
0.878 |
|
50.42 |
5 |
2.236 |
1.703 |
0.699 |
1.695 |
10.084 |
0.0198 |
-0.297 |
49.58 |
4.642 |
3.674 |
0.968 |
|
58.6 |
6 |
2.449 |
1.768 |
0.778 |
1.617 |
9.767 |
0.0171 |
-0.232 |
41.4 |
4.642 |
3.459 |
1.182 |
|
60.25 |
7 |
2.646 |
1.780 |
0.845 |
1.599 |
8.607 |
0.0166 |
-0.220 |
39.75 |
4.642 |
3.413 |
1.229 |
|
69.35 |
8 |
2.828 |
1.841 |
0.903 |
1.486 |
8.669 |
0.0144 |
-0.159 |
30.65 |
4.642 |
3.130 |
1.512 |
|
76.92 |
9 |
3.000 |
1.886 |
0.954 |
1.363 |
8.547 |
0.0130 |
-0.114 |
23.08 |
4.642 |
2.847 |
1.794 |
|
81.8 |
10 |
3.162 |
1.913 |
1.000 |
1.260 |
8.180 |
0.0122 |
-0.087 |
18.2 |
4.642 |
2.630 |
2.011 |
|
93.16 |
11 |
3.317 |
1.969 |
1.041 |
0.835 |
8.469 |
0.0107 |
-0.031 |
6.84 |
4.642 |
1.898 |
2.743 |
|
98.45 |
12 |
3.464 |
1.993 |
1.079 |
0.190 |
8.204 |
0.0102 |
-0.007 |
1.55 |
4.642 |
1.157 |
3.484 |
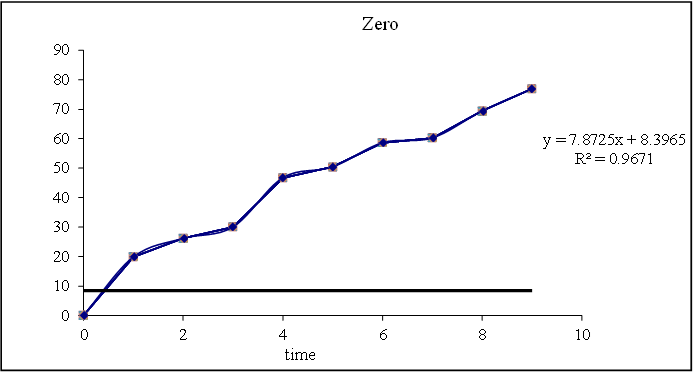
Figure 8.15: Graph of zero order kinetics
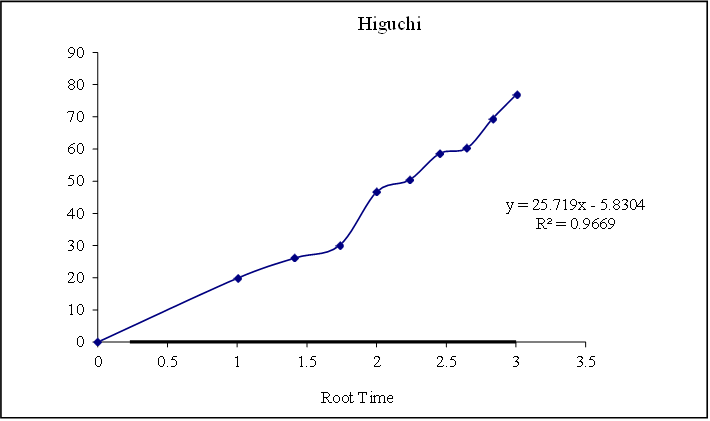
Figure 8.16: Graph of Higuchi release kinetics
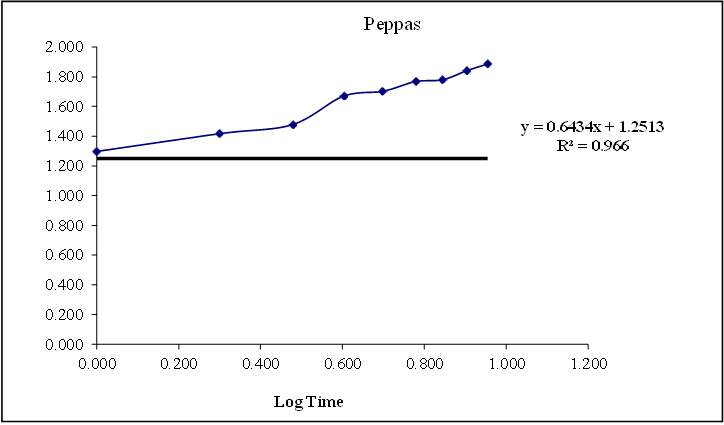
Figure 8.17: Graph of peppas release kinetics
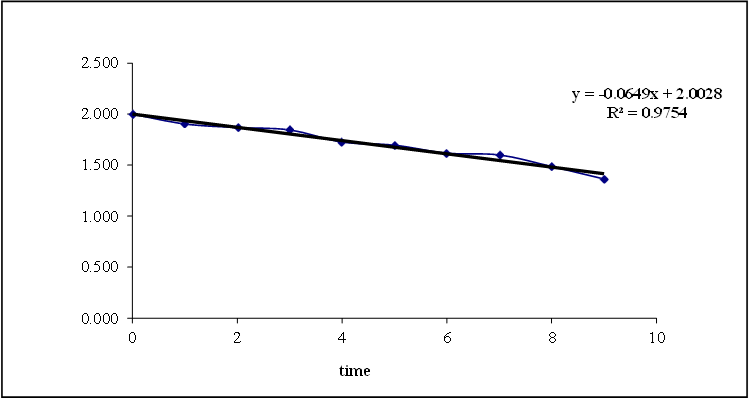
Figure 8.18: Graph of first order release kinetics
Based on the data above results the optimized formulation followed first order Release Kinetics.
FTIR study

Fig. 8.19: Ftir Graph Of Pure Glycopyrrolate Drug
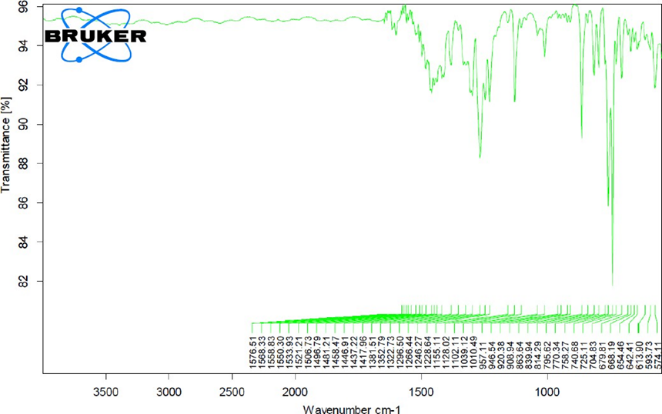
Fig. 8.20: Ftir Graph Of Pure Formoterol Drug
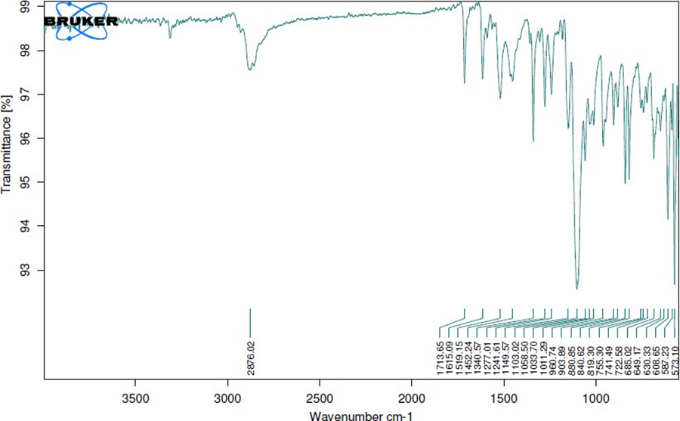
Fig. 8.21: Ftir graph of optimized Formulation
From the FTIR data is was evident that the drug and excipient does not have any interactions. Hence, they were compatible.
CONCLUSION
The Glycopyrrolate and Formoterol sustained release system drugs were prepared by using damp granulation methodology that employs polymers like thickener, Karaya gum, and HPMC K100M. The restructured infrared spectra of the polymer-therapy show that the two components are independent. We performed pre-definition checks at each stage and followed through all the way to the endpoints. These evaluation examinations are tracked down to the endpoints. The perform of the evaluation exams was seen among the pharmacopeial optio... In vitro utilizing the dissolving middle around, the pharmaceutical release was 99.75% in 12 hours for Glycopyrrolate and 98.45% for Formoterol in 12 hours. Project F4 was mirrored over. In light of the above descriptions, it can be clearly stated that Peppa's launch vitality portion before the usage of F4 Glycopyrrolate, and that Formoterol was initially prescribed to meet the Transport Vitality user's needs.
Consent for Publication
Not Applicable
Conflicts of Interest
The authors declare that there are no conflicts of interest, whether financial or otherwise.
ACKNOWLEDGEMENTS
The author greatly thankful to my respected guide, Dr. Kaushal Kishore Chandrul, Professor of Department of pharmacy, Mewar University, Chittorgarh and my Co-guide, Mr. Pankaj Chasta Faculty of Pharmaceutical Sciences, Mewar University, Chittorgarh who supported and guided me for my project. Without their incisive feedback and steadfast encouragement, this work would not have been possible. I would like to pay my sincere gratitude to Mewar University, Chittorgarh for furnishing me with advice and as well as the necessary resources that is important to implement this project successfully.
REFERENCES


Sana Nusrat Praween*, Dr. Kaushal Kishore Chandrul, Pankaj Chasta, Formulation And Characterization of Sustain Release Drug Delivery of Glycopyrrolate and Formoterol for The Treatment of Chronic Obstructive Pulmonary Disease (COPD), Int. J. of Pharm. Sci., 2024, Vol 2, Issue 12, 2853-2869. https://doi.org/10.5281/zenodo.14543522
 10.5281/zenodo.14543522
