1,2,4,5MVP Samaj College of Pharmacy, Nashik 422002.
3MVP Samaj Institute of Pharmaceutical Sciences Adgaon, Nashik 422002.
Background: Mefenamic acid (MA), a BCS Class II drug, exhibits poor aqueous solubility and an intensely bitter taste, which limit its oral bioavailability and patient compliance, especially among pediatric and geriatric populations. To address these challenges, the present study focused on the formulation and evaluation of cocrystals of mefenamic acid with selected coformers citric acid, sucralose, saccharin, mannitol, and aspartame. Objective: To enhance the solubility and mask the bitterness of mefenamic acid through cocrystallization with coformers. Methods: Cocrystals were prepared in a 1:1 molar ratio, among that MA: Mannitol and MA: Aspartame shows significant enhancement in solubility but aspartame is sweeter than mannitol therefore it was screened for further study. The prepared cocrystals were characterized using FTIR, DSC and PXRD. In vitro dissolution studies were conducted and taste masking was evaluated using a human sensory panel. Results: All cocrystals showed evidence of hydrogen bonding in FTIR and distinct new endothermic peaks in DSC thermograms, confirming cocrystal formation. PXRD patterns exhibited new diffraction peaks and suppression of original peaks, indicating the formation of new crystalline phases. Among all coformers, the MA: Aspartame (1:2) cocrystal exhibited the most favorable profile, achieving 90.72% drug release in 60 minutes compared to 49.04% for pure MA. Taste evaluation results showed complete elimination of bitterness in the MA: Aspartame cocrystal versus high bitterness for the pure drug. Although MA: Mannitol showed slightly higher solubility enhancement, although aspartame’s stronger sweetness provided significantly better taste masking. Statistical analysis confirmed the difference was highly significant (p < 0.001). Conclusion: The cocrystallization of mefenamic acid with aspartame (1:2) successfully improved both solubility and palatability, making it the most effective formulation among the tested coformers. This approach holds promise for developing patient-compliant oral dosage forms of poorly soluble and bitter-tasting drugs.
Oral drug delivery remains the most preferred route for pharmaceutical administration due to its convenience, patient-friendly nature, cost-effectiveness, ease of manufacturing, and favourable stability during storage. Despite these advantages, oral dosage forms often face challenges such as difficulty in swallowing and unpleasant taste, which significantly affect patient compliance particularly among paediatric and geriatric populations. The bitter taste of active pharmaceutical ingredients (APIs) is primarily detected by taste buds located on the tongue, making taste masking a crucial step in formulation development to ensure better patient acceptability.1 A variety of taste-masking techniques have been employed over the years, including the use of flavouring and sweetening agents, microencapsulation, ion-exchange resins, prodrug strategies, inclusion complexation, granulation, multiple emulsions, and gel formation. However, limited studies have explored co-crystallization as a viable approach for taste masking. This novel technique not only mitigates bitterness but also enhances other physicochemical properties of the drug, such as solubility, dissolution, and compressibility.2 Co-crystallization is grounded in the principles of crystal engineering, which involves the rational design of crystalline materials by manipulating intermolecular forces and supramolecular assemblies. Co-crystallization has recently gained significant attention in the pharmaceutical field, particularly due to increased regulatory emphasis on solid-state characterization of drug substances.3 Mefenamic acid (MA), a commonly used non-steroidal anti-inflammatory drug (NSAID), is known for its potent analgesic, antipyretic, and anti-inflammatory effects. However, it suffers from poor aqueous solubility and an intensely bitter taste, leading to its classification as a BCS Class II drug. These drawbacks contribute to limited oral bioavailability and poor compliance among patients, especially in sensitive populations.4 The present research work focuses on the application of co-crystallization to improve the solubility and palatability of mefenamic acid. By selecting pharmaceutically acceptable sweeteners as coformers, this study aims to form cocrystals through non-covalent interactions that retain the therapeutic efficacy of the drug while significantly enhancing its organoleptic and dissolution properties.
MATERIALS AND METHODS
MATERIALS
Mefenamic acid (MA) was a gift sample obtained from Blue cross, Nashik. Mannitol, citric acid, sucralose, aspartame and saccharine was received as gift samples from Fullife Health Care Pvt. Ltd, Khopoli.
METHODS
Mefenamic acid co-crystals were formulated using the liquid assisted grinding method. Mannitol, citric acid, sucralose, aspartame and saccharine used as a co-former in their equimolar ratios.5
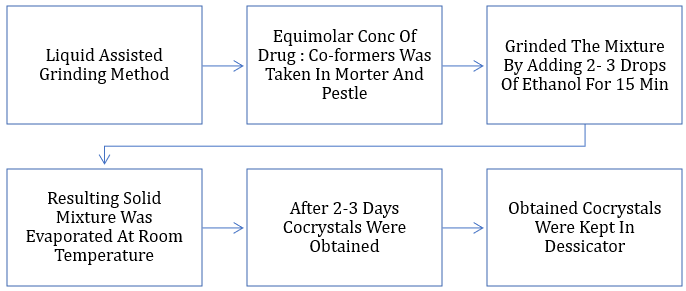
Figure 1 Liquid Assisted Grinding method
Preliminary Characterization of Drug and Conformer
Organoleptic properties
Drug and coformers were evaluated for its colour, odour, taste and appearance. These sensory characteristics play a vital role in ensuring patient acceptability and compliance, especially for oral dosage forms, where an unpleasant taste or Odor can lead to poor patient compliance.
Melting point
Melting points of the Selected drug and co-former were taken by melting point apparatus. Melting point determination is important for identification of drug and coformer. It is primary indication for formation of cocrystals. It provides valuable information about the thermal behavior and stability of the cocrystal compared to the pure drug and coformer. A change in the melting point typically different from that of either the parent drug or the conformer indicates the formation of a new solid phase with distinct physicochemical properties, confirming successful cocrystal formation.
UV Spectroscopy
UV spectrometric technique was based on the Lambert-Beer law. UV spectrophotometer was used for the identification of given chemical substance as each of them has concentration of known substance. To prepare the stock solution, accurately weighed 10 mg of Mefenamic acid transfer into a 100 ml volumetric flask. Then, add 50 ml of distilled water to dissolve the compound. Afterward, the volume was adjusted to 100 ml using distilled water, resulting in a solution concentration of 100 μg/ml. To generate a calibration curve, aliquots of 0.5, 1, 1.5, 2, 2.5 and 3 ml were taken from the 100 μg/ml stock solution. Each aliquot was then diluted to a final volume of 10 ml with distilled water, resulting in concentrations of 5, 10, 15, 20, 25 and 30 μg/ml, respectively. The absorbance of each dilution was measured at a wavelength of 286 nm using the UV-Visible spectroscopy instrument (SHIMADZU UV-2450). Finally, a graph was plotted with absorbance on the y-axis and concentration on the x-axis using the collected data from the calibration curve.
Comparative Characterization of Prepared Cocrystals
Screening of optimized cocrystal done on the basis of following parameters, 1. Melting point, 2. Saturation solubility study, 3. FTIR. From that Cocrystals of Mefenamic acid: aspartame (1:2) shows highest solubility and strongest hydrogen bonding.
Melting point
Melting point of prepared cocrystals of mefenamic acid were determined by using melting point apparatus.
Saturation solubility study
Saturated solubility was performed to determine the actual solubility of co-crystals as follows: An excess amount of co-crystals was taken in a 10 ml volumetric flask containing 5 ml water then the sample was sonicated at 90 rpm (CITIZEN LAB CD 4820) for 4 min. After an equilibrium period of time (24hr) supernatant was collected then filtered the solution using Whatman filter paper (0.42 µm). resultant filtrate absorbance was taken using UV-visible spectroscopy at selected wavelength (286 nm) with proper dilution water as a diluent.
FTIR Spectroscopy
FTIR spectra gives Information about the functional group present in the compound. FTIR spectral analysis was performed to evaluate the chemical stability of the drug as well as to confirm if there any interaction in the drug and co former by using FTIR spectrometer (Bruker Alpha Eco-ATR). The scanning range was 4000 cm-1 to 400 cm-1 and the resolution was 1cm-1.
Characterization Of Screened Cocrystals
Visual Morphology
The visual appearance of plain Mefenamic acid, cocrystals was recorded to observed changes in crystal habit. The study was carried using Light microscope and crystal shapes based on visual morphology were compared.
Differential Scanning Calorimetry (DSC)
DSC help to determine melting behaviour and enthalpy of fusion. A DSC study was carried out to detect possible polymorphic transition during the cocrystallization process. The thermal behaviour of pure drug was determined using differential scanning calorimeter (DSC 60Plus, Shimadzu, Japan). Samples (2−5 mg) were crimped in aluminium pans and scanned from 30 – 300°C at heating rate of 10 °C/min under constant purging of dry nitrogen at 50 mL/min. TA Explorer software was used to manage the data.
Powder X-Ray Diffraction Study (PXRD)
Every new crystalline material exhibits unique peaks indicative of reflections from specific atomic planes. Powerful technique for determining the presence of polymorphs, crystal habit modifications in drug crystals, and/or generation of new crystal form. X-ray diffractogram of the pure drug was recorded by diffractogram using Bruker AXS D8 Advance Diffractometer system. The samples were radiated using a Monochromatized Cu Kα radiation (WL= 1.5406 Å), then analyzed between the 5 and 40° range at a step size of 0.020° and a step time 31.2 s. PXRD patterns were refined using Diffrac plus software. All samples were measured in the 2θ angle range between 0°C and 50°C.
In-Vitro Dissolution Studies
The solubility advantage of cocrystals has been shown to correlate with increased dissolution. Cocrystals of mefenamic acid has solubility greater than pure mefenamic acid. Therefore, in order to assess whether this solubility advantage correlates with increased dissolution, in vitro release study was performed in biorelevant media at PBS pH 7.4.
Following data shows the dissolution data of pure mefenamic acid and its cocrystals:
Concentration was determined by UV spectrophotometer at a wavelength of 286 nm. The dissolution was significantly improved after cocrystallization.
Taste evaluation
In this method, taste evaluation was done on 11 healthy human volunteers selected for taste evaluation. The volunteers were made to sign a written consent form before the test. They were told to keep 1 mg of mefenamic acid in the pure form in the mouth for 15-30 seconds and then were asked to spit it out. Similarly, they were told to keep the co-crystals (1 mg) in the mouth until they were completely soluble. The degree of bitterness was immediately scored as per the bitterness intensity scale from 0-5 where 0, 1, 2, 3, 4 and 5 indicate no bitterness, very slight bitterness, slight bitterness, moderate bitterness, strong bitterness and very strong bitterness respectively.
Rate the bitterness intensity using the scales below:
4: Strong bitterness, 3: Moderately bitterness, 2: Slight bitterness, 1: Acceptable bitterness, 0: No bitterness.
RESULTS AND DISCUSSION
Preliminary Characterization of Drug and Conformer
Organoleptic Properties
Table 1 Organoleptic properties of API and coformers
|
Sr. no. |
Drug and coformers |
Colour |
Odour |
Taste |
Appearance |
|
1 |
Mefenamic acid |
White |
Odorless |
Bitter |
Microcrystalline |
|
2 |
Citric acid |
White |
Odorless |
Sour |
Crystalline |
|
3 |
Sucralose |
White |
Odorless |
Sweet |
Free flowing, Crystalline |
|
4 |
Saccharine |
white |
Odorless |
Sweet |
Crystalline |
|
5 |
Aspartame |
Off-white |
Odorless |
Sweet |
Needle like crystal |
|
6 |
Mannitol |
White |
Odorless |
Sweet |
Crystalline |
Melting Point
Table 2 Melting point of API and coformers
|
Sr. No. |
Compounds |
Standard M.P. |
Observed M.P. |
|
1 |
Mefenamic acid (API) |
230-232°C |
227-232°C |
|
2 |
Citric acid |
153-159°C |
150-153°C |
|
3 |
Mannitol |
162-164°C |
160-162°C |
|
4 |
Sucralose |
125-136°C |
128-132°C |
|
5 |
Saccharin |
228-300°C |
304-310°C |
|
6 |
Aspartame |
246-250°C |
248-250°C |
UV-Visible spectroscopy
The serial dilutions 5 to 30 µg/ml was made from a 100 µg/ml solution, and absorbance was recorded at wavelength 286 nm.
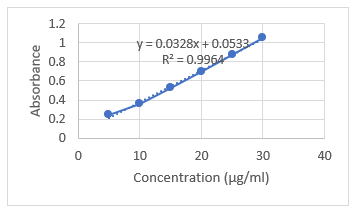
Figure 2 UV Callibration Curve
Comparative Characterization of Prepared Cocrystals
Melting point
Table 3 Melting Point of Formed Cocrystals
|
Sr. No. |
Compounds |
Observed M.P. |
||
|
1 |
Pure mefenamic acid |
227-232°C |
||
|
2 |
MA: Citric acid (1:1) |
205°C |
2 |
MA: Citric acid (1:1) |
|
3 |
MA: Mannitol (1:1) |
240°C |
3 |
MA: Mannitol (1:1) |
|
4 |
MA: Sucralose (1:1) |
160°C |
4 |
MA: Sucralose (1:1) |
|
5 |
MA: Saccharin (1:1) |
235°C |
5 |
MA: Saccharin (1:1) |
|
6 |
MA: Aspartame (1:1) |
222°C |
6 |
MA: Aspartame (1:1) |
|
7 |
MA: Aspartame (1:2) |
228°C |
7 |
MA: Aspartame (1:2) |
|
8 |
MA: Aspartame (1:3) |
238°C |
8 |
MA: Aspartame (1:3) |
Saturation Solubility
Table 4 Saturated solubility
|
Sr. No. |
Co-crystal |
Solubility (mg/ml) |
Solubility enhancement (fold) |
|
1 |
Pure mefenamic acid |
0.00944 |
|
|
2 |
MA: Citric acid (1:1) |
0.0176 |
1.8 |
|
3 |
MA: Aspartame (1:1) |
0.0592 |
6.27 |
|
4 |
MA: Mannitol (1:1) |
0.0726 |
7.7 |
|
5 |
MA: Sucralose (1:1) |
0.0255 |
2.71 |
|
6 |
MA: Saccharin (1:1) |
0.0216 |
2.3 |
Among the cocrystals evaluated, the mefenamic acid (MA) cocrystals with mannitol demonstrated the highest solubility enhancements, showing 7.7 fold increases in solubility compared to pure MA. In contrast, the MA: Aspartame (1:1) cocrystal shows 6.27 folds solubility enhancement. Importantly, Aspartame, being 200 times sweeter than sucrose, also effectively masks MA’s bitterness. Thus, Aspartame fulfils the dual objective of improving solubility and taste, making it the most suitable conformer for developing a patient-friendly oral formulation.
Table 5 Saturated solubility of screened cocrystal
|
Sr. No. |
Co-crystal |
Solubility (mg/ml) |
Solubility enhancement (fold) |
|
1 |
MA: Aspartame (1:2) |
0.078 |
8.3 |
|
2 |
MA: Aspartame (1:3) |
0.065 |
6.9 |
Based on the solubility data mentioned above, the co-crystal of Mefenamic acid: aspartame with a stoichiometric ratio of 1:2 was found to have an optimized ratio, indicating improved solubility properties. Therefore, this specific ratio of the co-crystal was selected for further studies.
Characterization of Screened Cocrystals
FTIR Spectroscopy
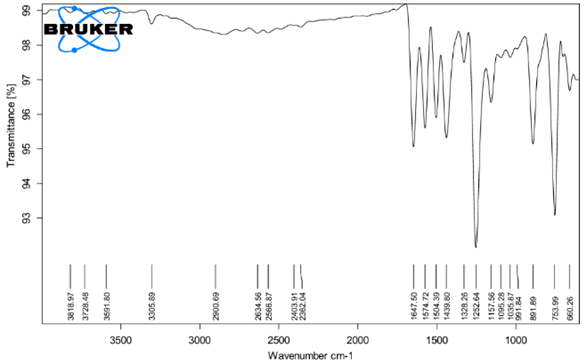
Figure 3 FTIR spectra of Mefenamic acid
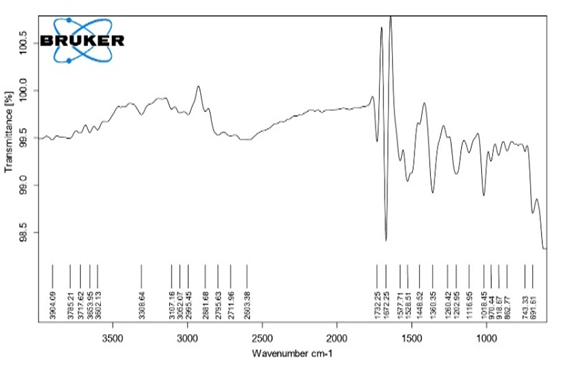
Figure 4 FTIR spectra of Aspartame
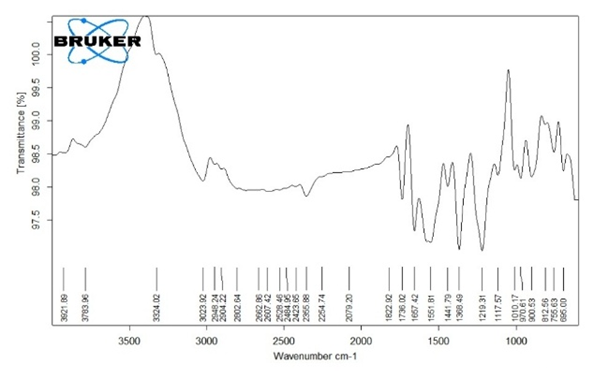
Figure 5 FTIR spectra of Cocrystals of Mefenamic acid: Aspartame (1:2)
Based on the FTIR spectral analysis, the formation of a cocrystal between Mefenamic acid and Aspartame (1:2) was confirmed through significant shifts and changes in characteristic absorption bands. In the cocrystal spectrum, broadening in the O–H and N–H stretching region around 3300–3400 cm?¹ was observed compared to the pure components, indicating the establishment of strong intermolecular hydrogen bonding between Mefenamic acid and Aspartame. Additionally, a noticeable shift in the carbonyl (C=O) stretching band from its original position in both pure compounds to a slightly altered position (~1690–1710 cm?¹) in the cocrystal supports the interaction of carbonyl groups in the hydrogen bonding network. These spectral modifications collectively provide strong evidence for successful cocrystal formation, reflecting a change in the molecular environment and solid-state structure.
Morphology
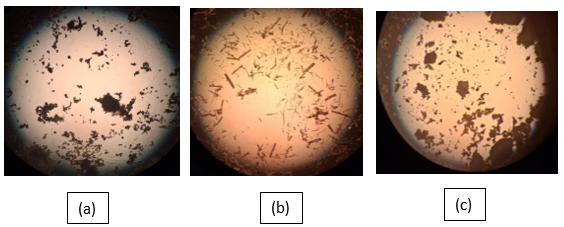
Figure 6 Morphology Study of (a) pure mefenamic acid (b) aspartame and (c) mefenamic acid: aspartame (1:2)
The visual appearance of plain pure mefenamic acid, aspartame and cocrystals (1:2) cocrystals was recorded to confirm the change in crystal habit using a Light microscope, and crystal shapes based on visual morphology were compared.
Mefenamic acid – Plate shape
Aspartame – Needle shape
Mefenamic acid: Aspartame (1:2) – Flake shape
Differential Scanning Calorimetry (DSC)
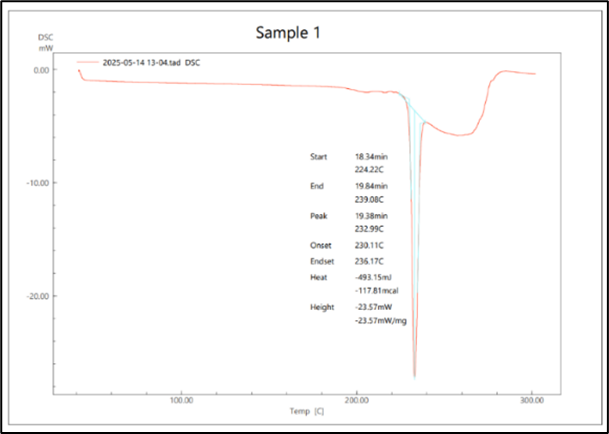
Figure 7 DSC of Mefenamic acid
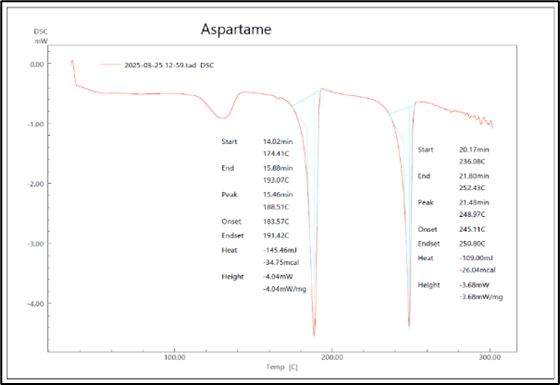
Figure 8 DSC of Aspartame
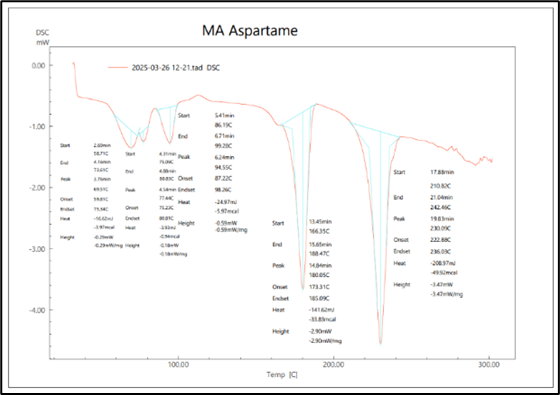
Figure 9 DSC OF Cocrystals of Mefenamic acid: Aspartame (1:2)
The Differential Scanning Calorimetry (DSC) analysis provided clear evidence of cocrystal formation between mefenamic acid and aspartame. The thermogram of pure mefenamic acid showed a sharp endothermic peak at 232°C corresponding to its melting point, while aspartame exhibited a distinct endothermic peak at 248°C of its own. In contrast, the DSC thermogram of the cocrystal displayed a new, single sharp endothermic peak at a temperature 230°C different from that of either of the pure components. The disappearance of the original melting points and the emergence of a new thermal event indicate the formation of a novel solid phase. His distinct thermal behaviour confirms successful cocrystallization and suggests a change in the molecular arrangement resulting from intermolecular interactions between the drug and the conformer.
Powder X-Ray Diffraction Study (PXRD)
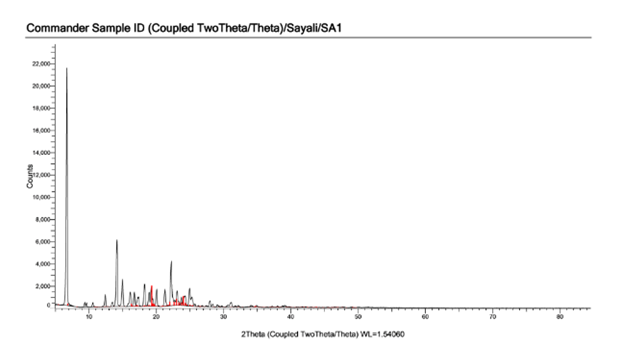
Figure 10 PXRD of Mefenamic acid
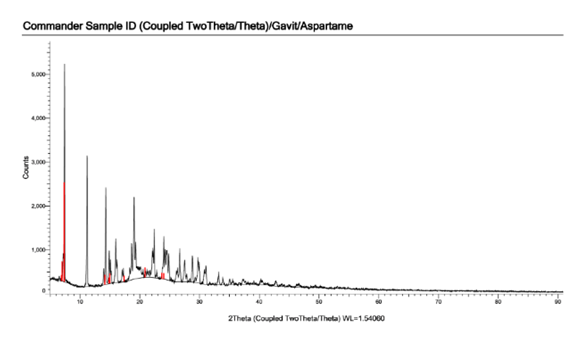
Figure 11 PXRD OF Aspartame
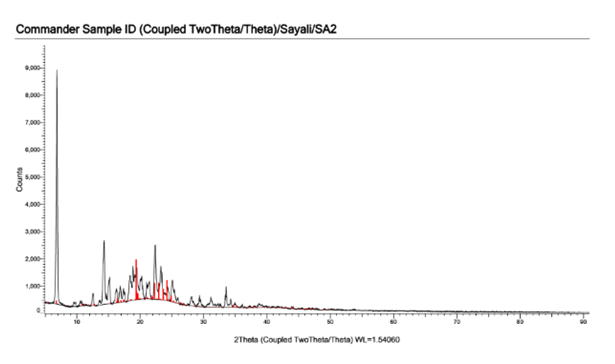
Figure 12 PXRD OF Cocrystals of Mefenamic acid: Aspartame (1:2)
PXRD was performed to confirm the formation of cocrystals of mefenamic acid with aspartame in a 1:2 molar ratio. The diffraction pattern of pure mefenamic acid exhibited sharp and intense peaks at characteristic 2θ values such as 6.5°, 13.5°, 15.5°, and 22.3°, confirming its crystalline nature. Similarly, pure aspartame displayed multiple peaks at 7.0°, 10.5°, 12.8°, 14.9°, and 19.6°, indicating its own distinct crystalline profile. In contrast, the PXRD spectrum of the mefenamic acid: aspartame cocrystal showed a new set of diffraction peaks at 6.7°, 16.5°, 18.3°, 22.7°, and 25.1°, which were absent in the individual components. Additionally, several original peaks of both the drug and coformer either disappeared or were significantly reduced in intensity. These observations indicate the formation of a new crystalline phase, confirming successful cocrystallization. The appearance of new peaks, along with the disappearance or shifting of characteristic peaks of the parent compounds, strongly supports the formation of a mefenamic acid–aspartame cocrystal with altered lattice arrangement due to intermolecular interactions, such as hydrogen bonding.
In-Vitro Dissolution study
Mefenamic acid cocrystal solubility was greater than mefenamic acid. Therefore, in order to assess whether this solubility advantage correlates with increased dissolution, in vitro release study was performed in biorelevant media at pH 7.4.
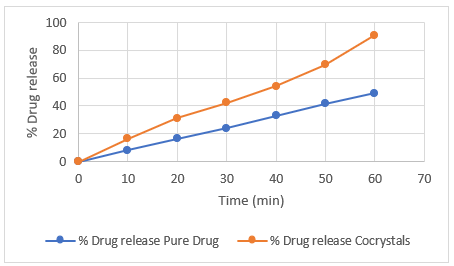
Figure 13 In-Vitro dissolution profile of Mefenamic acid and Co-crystal of Mefenamic acid and Aspartame (1:2)
Taste evaluation
The 11 healthy human volunteers were used for taste masking and informed consent was obtained from all of them. Bitterness was measured with 5-6 mg of sample held in the mouth for 10 sec, then spat out: the bitterness level was then recorded after 10 sec, 20 sec and 30 sec. These volunteers were instructed not to swallow the sample, which were placed on the tongue. They were instructed to thoroughly gargle their mouth with distilled water after the completion of test. Further responses are recorded on bitterness scale.
4: Strong bitterness, 3: Moderately bitterness, 2: Slight bitterness, 1: Acceptable bitterness, 0: No bitterness.
Table 6 paired t-test for pure mefenamic acid and cocrystals of MA: ASP (1:2)
|
Time (seconds) |
Bitterness level of mefenamic acid |
Bitterness level of cocrystal of MA: ASP (1:2) |
|
Mean ± SD |
Mean ± SD |
|
|
10 |
3.63 ± 0.50 |
0 |
|
20 |
3.63 ± 0.50 |
0 |
|
30 |
3.72 ± 0.46 |
0 |
(n=10), P < 0.05
The significant reduction in bitterness score (from 3.66 to 0) with a p-value of 0.000067 strongly indicates that the cocrystal formulation of mefenamic acid with sweeteners successfully masked the bitter taste of mefenamic acid.
CONCLUSION
The present study aimed to formulate cocrystals of mefenamic acid (MA) with selected sweeteners to improve its aqueous solubility and effectively mask its bitter taste, thereby enhancing patient acceptability. Among the various coformers explored, aspartame and mannitol demonstrated significant improvement in solubility and crystal modification. However, aspartame was ultimately selected as the optimal coformer due to its superior taste-masking ability and sufficient solubility enhancement. FTIR analysis confirmed successful hydrogen bonding between MA and aspartame, as evident from characteristic peak shifts. DSC thermograms of the MA: Aspartame (1:2) cocrystal exhibited a distinct melting endotherm at 230°C, which was less than spectra of the pure drug and coformer, confirming the formation of a new crystalline phase. PXRD analysis supported this observation, as the cocrystal displayed new diffraction peaks at unique 2θ values with the disappearance or suppression of original peaks, indicating significant lattice rearrangement and cocrystal formation. Although mannitol-based cocrystals showed a slightly higher solubility enhancement (7.7-fold) than aspartame (6.27-fold), aspartame’s distinctly higher sweetness proved crucial in achieving complete taste masking. Taste evaluation studies showed that the cocrystal formulation exhibited zero bitterness across all time points (10, 20, and 30 seconds), while the pure drug scored an average bitterness level of 3.6 to 3.7. The statistical analysis using a paired t-test confirmed the difference was highly significant (p < 0.001). In vitro dissolution studies revealed a marked improvement in drug release, with the MA: Aspartame cocrystal achieving 90.72% cumulative drug release at 60 minutes, compared to 49.04% for the pure drug. In conclusion, the MA: Aspartame (1:2) cocrystal demonstrated a balanced and effective enhancement of both solubility and taste masking. The combined results from FTIR, DSC, PXRD, dissolution, and taste evaluation confirm that aspartame is a suitable coformer for the development of patient-friendly, taste-masked, and bioavailability-enhanced oral formulations of mefenamic acid.
REFERENCES


A. Savkare, S. Khatale, Dr. Nitin Hire, Tanvi Deshmukh, Sayli Shelke*, Formulation and Evaluation of Mefenamic Acid Cocrystals for Taste Masking and Solubility Enhancement, Int. J. of Pharm. Sci., 2025, Vol 3, Issue 8, 81-95. https://doi.org/10.5281/zenodo.16717384
 10.5281/zenodo.16717384
