Maharashtra Institute of Pharmacy, Betala, Bramhapuri, India.
A rapid and precise method (in accordance with ICH guidelines) is required for the quantitative simultaneous determination of singal drugs in a pharmaceutical dosage form. The pursuit of desired quality is a continual challenge for pharmaceutical industries, necessitating a meticulous approach known as validation. Sensitive and specific RP-HPLC method involving UV detection was carried for determination and quantification of various drug in singal dosage form. The aim is "Analytical Method developement and Validation of Sotagliflozin. Sotagliflozin by RP- HPLC In Singal Dosage Form " as per ICH guidelines. The developed method was validated for various parameters as per ICH guidelines like system suitability, specificity, linearity, system precision, method precision, accuracy, ruggedness and robustness. The separation method was carried out by using a mobile phase A consisting of Potassium dihydrogen phosphate buffer (0.05M): Methanol 45:55 v/v) pH 3.5 ± 0.1 and Mobile phase B comprises Acetonitrile in the ratio of 50:50 v/v. The detection was carried out by using UV detector at 300nm. The column was Agilent C 18 (250X4.6mm) 5µ. The flow rate was selected as 1.5 ml/min. The retention time of Of Sotagliflozin was found to be 3.29 min.
Analytical Chemistry is defined as “The science and the art of determining the composition of materials in terms of the elements or compounds contained.” This branch of chemistry, which deals with both theoretical, practical science and practiced in a large number of laboratories in many diverse ways. Methods of analysis are routinely developed, improved, validated, collaboratively studied and applied. In analytical chemistry it is of prime importance to gain information about the qualitative and quantitative composition of substances and chemical species that is to find out what substance is composed and exactly how much. In quantitative analysis the question is how much is present. In the pharmaceutical industry, the quality control of drug substances and products is paramount to ensure their safety, efficacy, and consistency. Analytical method development and validation are critical components of drug development, regulatory compliance, and pharmacovigilance. Among various chromatographic techniques, Reverse-Phase High-Performance Liquid Chromatography (RP-HPLC) stands out due to its high resolution, sensitivity, reproducibility, and applicability to a wide range of compounds. Sotagliflozin is a novel sodium-glucose co-transporter-2 (SGLT2) inhibitor used in the management of type 2 diabetes mellitus (T2DM). It works by inhibiting glucose reabsorption in the kidneys, thereby promoting urinary glucose excretion and lowering blood sugar levels. Given its therapeutic importance, a reliable, precise, and validated analytical method is essential for quantifying Sotagliflozin in pharmaceutical formulations (tablets, suspensions, etc.) and ensuring compliance with regulatory standards (ICH, USFDA, EMA) The development of a robust RP-HPLC method for Sotagliflozin involves optimizing several chromatographic parameters, including:
MATERIALS AND METHODS
Drug Under Investigation
The following drug will be taken for the investigation.
Sotagliflozin
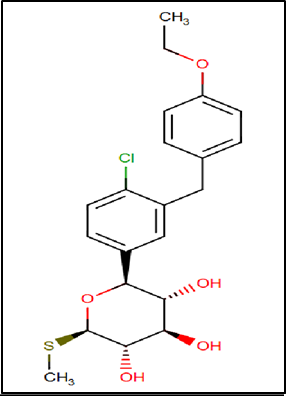
Figure 11 Structure of Sotagliflozin
Pharmacodynamics:
Sotagliflozin exerts its pharmacologic effects by slowing glucose absorption in the gastrointestinal tract and increasing the excretion of glucose in the urine. It is administered by mouth once daily before the first meal of the day. The use of SGLT2 inhibitors, including sotagliflozin, can cause diabetic ketoacidosis (DKA). Patients, especially those with a higher baseline risk of DKA, should be instructed on how and when to monitor for ketoacidosis and what actions to take when DKA is suspected. SGLT2 inhibitors, including sotagliflozin, also increase the risk of genital infections. This is due to the increase in urinary glucose excretion, which provides a relatively glucose-rich environment in which infectious agents may establish themselves.
Mechanism of action:
Sodium-glucose co-transporter types 1 and 2 (SGLT1 and SGLT2) are integral in the transport of glucose in the body. SGLT1 is the major transporter for glucose absorption in the gastrointestinal tract,1 while SGLT2 is the predominant transporter responsible for reabsorption of glucose in the glomerulus. Sotagliflozin is a dual inhibitor of both SGLT1 and SGLT2. Inhibition of SGLT1 results in a delay in glucose absorption and a blunting of postprandial hyperglycemia, while inhibition of SGLT2 reduces renal reabsorption of filtered glucose, thereby increasing urinary glucose excretion.
Route of elimination:
Sotagliflozin is primarily eliminated via the renal route, with 57% of administered drug material appearing in the urine and 37% appearing in the feces.
Half-life:
The mean terminal half-life of sotagliflozin ranged from 21 to 35 hours and from 19 to 26 hours for its M19 metabolite.
Clearance:
In healthy volunteers, the mean apparent clearance of sotagliflozin ranged from 261 to 374 L/h. The mean apparent clearance estimated in a population of mostly type 1 diabetic patients was 239 L/h.
CHEMICALS AND REAGENTS
Table: 3. Shows chemicals used for experimental work
|
CHEMICAL/ SOLVENT |
GRADE |
MANUFACTURER |
|
Sotagliflozin |
|
Hetero Pharma |
|
Methanol |
HPLC grade |
FINER chemical LTD |
|
Acetonitrile |
HPLC grade |
Rankem chemicals |
|
Purified water |
HPLC grade |
Rankem chemicals |
INSTRUMENTS
Table: 4. Shows instruments used for experimental work
|
Sr. No. |
Instrument |
Make& model |
|
1 |
HPLC |
Analytical technologies |
|
2 |
UV |
Elico SL-196 |
|
3 |
Detector |
UV detector, Analytical technologies |
|
4 |
Software |
Analchrome, Clarity |
|
5 |
Column |
Hypersil ODS C18, (150 *4.6 mm , 5µ) |
|
6 |
Analytical balance |
Digital Analytical balance Shimadzu |
|
7 |
Sonicator |
Analytical technologies |
|
8 |
Filter |
Nylon 0.45 µm |
EXPERIMENT
Determination of absorption maxima by UV/Vis Spectrophotometry
Accurately weigh 100 mg of drug in to 100 ml volumetric flask. To this add 90 ml and 10 ml of diluents (acetonitrile 90: 10 methanol) and sonicate it and further make up the volume with diluent. From this take 1 ml and make up to 10ml. The solutions were scanned in the range of 200-400 nm in 1cm cell against blank.
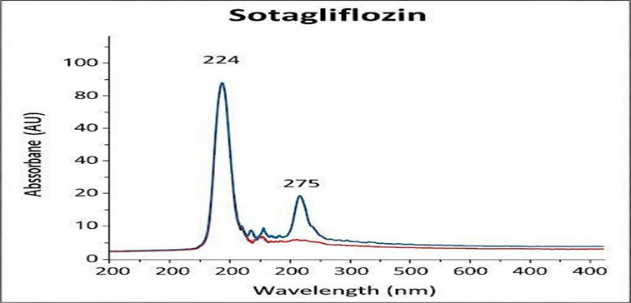
Figure: . Shows UV spectrum of Sotagliflozin Method development/ Method optimization
Preparation of mobile phase: Accurately measured 90 ml of Acetonitrile and10 ml of methanol (90:10) HPLC grade were degassed in an ultrasonic water bath for 10 minutes and then filtered through 0.45 µ nylon filter under vacuum filtration.
Diluent: Mobile phase is used as diluents
Standard preparation: Accurately weigh 50 mg of Sotagliflozin (SOTA ) and transfer in to 50ml volumetric flask. Add about 10ml of solvent mixture sonicate to dissolve. Cool the solution to room temperature and dilute to volume with solvent mixture. Transfer 1ml of above solution in to a 10ml volumetric flask and make up the volume with diluent.
Optimized chromatographic conditions
Table 5: Optimized chromatographic conditions
|
Column |
Hypersil ODS C18 (150x4.6mm, 5 µ) |
|
Flow rate |
1. 6ml/min |
|
Wavelength |
235nm |
|
Column temperature |
350c |
|
Injection volume |
10 µl |
|
Run time |
5 min |
Percentage Assay
Inject 10 uL of the standard, sample into the chromatographic system and measure the area of SOTA peaks and calculate the %Assay by using the formulae.
Where:
AT = average area counts of sample preparation.
AS = average area counts of standard preparation.
WS = Weight of working standard taken in mg.
P = Percentage purity of working standard
LC = Label claim of tablet mg/ml.
Validation of developed RP-HPLC method
Validation: Establishing documentation evidence, which provides a high degree of assurance that specific process, will consistently produce a product meeting its predetermined specification and quality attributes.
The following parameters were considered for the analytical method validation of SOTA in bulk Dosage form.
Accuracy
For accuracy determination, three different concentrations were prepared separately i.e. 50%, 100% and 150% for the analyte and chromatograms are recorded for the same.
Preparation of 50% solution: About 25mg of SOTA was weighed and transferred to 50ml volumetric flask. Add 50ml of mobile phase, Sonicate for 10min & filter through 0.45µ nylon filter & make up to the mark with same solvent. Further 3ml of above solution was diluted to 10ml with the diluents to get 50%.
Preparation of 100% solution: About 50mg of SOTA was weighed and transferred to 50ml volumetric flask. Add 50ml of mobile phase, Sonicate for 10min & filter through 0.45µ nylon filter & make up to the mark with same solvent. Further 3ml of above solution was diluted to 10ml with the diluents to get 100%.
Preparation of 150% solution: About 75mg of SOTA was weighed and transferred to 50ml volumetric flask. Add 50ml of mobile phase, Sonicate for 10min & filter through 0.45µ nylon filter & make up to the mark with same solvent. Further 3ml of above solution was diluted to 10ml with the diluents to get 150%.
Acceptance criteria: The method is considered accurate if the average recovery is not less than 98% and not more than 102%.
Precision
Accurately weigh and transfer 50 mg of SOTA working standard into a 50 ml clean dry volumetric flask add diluents and sonicate to dissolve it completely and make volume up to the mark with the same solvent. Further pipette 3 ml of the above stock solution into a 10ml volumetric flask and dilute up to the mark with diluent. Then the standard solution was injected for six times and measured the area for all six injections in HPLC. The %RSD for the area of six replicate injections was found to be within the specified limits.
Acceptance criteria: RSD of six replicate injections should be NMT 2%.
Linearity and range
Appropriate aliquot of standard SOTA stock solution was taken in 50ml volumetric flask and resultant solution was diluted up to the mark with diuent to obtain final concentration of SOTA. This solutionwas injected into chromatographic system. The chromatograms were obtained and peak area was determined for each concentration of drug solution. Calibration curve was constructed by plotting peak area against applied concentrations. The slope, intercept and correlation coefficient (r2) were also determined.
Linearity of the analytical method for assay by injecting the linearity solutions prepared in the range of 100µg to 500 µg of test concentration, into the chromatograph, covering minimum 5 different concentrations. Draw a plot between the concentration vs peak response of Artemether. Report the slope, intercept and regression coefficient from the plot.
Standard Preparation: Accurately weigh 50 mg of SOTA and transfer in to 50ml volumetric flask. Add about 10 ml of solvent mixture sonicate to dissolve. Cool the solution to room temperature and dilute to volume with solvent mixture (Stock solution).
100 µg Linearity standard solution Preparation: Transfer 1ml of Linearity standard stock solution in to 10ml volumetric flask and make up to the volume with diluent and inject into the HPLC.
200µg Linearity standard solution Preparation: Transfer 2ml of Linearity standard stock solution in to 10ml volumetric flask and make up to the volume with diluent and inject into the HPLC.
300µg Linearity standard solution Preparation: Transfer 3ml of Linearity standard stock solution in to 10ml volumetric flask and make up to the volume with diluent and inject into the HPLC.
400µg Linearity standard solution Preparation: Transfer 4ml of Linearity standard stock solution in to 10ml volumetric flask and make up to the volume with diluent and inject into the HPLC.
500µg Linearity standard solution Preparation: Transfer 5ml of Linearity standard stock solution in to 10ml volumetric flask and make up to the volume with diluent and inject into the HPLC.
Acceptance criteria: The relationship between the concentration and response of SOTA should be linear in the specified range and Regression Coefficient should not be less than 0.999.
Robustness
As part of the Robustness, deliberate change in the temperature Variation was made to evaluate the impact on the method. Robustness of assay method is demonstrated by changing the flow rate for 1.4 ml / min and 1.8 ml / min instead of 1.6 ml / min by injecting the 6 replicate injections of standard in 1.4 ml / min and 1.8 ml / min flow rate and found that system suitability parameters are passed. By changing the column temperature for 30 0c and 40 0c instead of 35 0c by injecting the 6 replicate injections of standard in 30 0c and 40 0c temperature and found that system suitability parameters are passed.
Solution stability: standard solution should be tested over 24-48hrs period under normal laboratory and potency of solution should be determined by comparison to freshly prepared standards.
Acceptance criteria: The solutions are considered stable if the difference in %RSD results from initial to 24hrs and 48 hrs is NMT 2%.
Selectivity:
Blank preparation: Dilute 5 ml of diluents in to 50 ml volumetric flask and dilute to volume with mobile phase.
Placebo Preparation: Weigh accurately about 50 mg of placebo powder in a 50ml volumetric flask add 50ml diluent and sonicate for 20 minutes and cool, after cooling make up to the volume. Further dilute 0.5 ml of this solution to 10ml with diluent and inject into the chromatogram.
Standard Preparation: Accurately weigh 25 mg of Artemether and transfer in to 25 ml volumetric flask. Add about 10 ml of solvent mixture sonicate to dissolve. Cool the solution to room temperature and dilute to volume with solvent mixture. Transfer 1ml of above solution in to a 10 ml volumetric flask and dilute to volume with diluent.
Acceptance Criteria: No peak should be observed due to blank and placebo at retention time of SOTA peak.
Ruggedness (Intermediate Precision)
Intermediate Precision expresses with in laboratory variation as on different days or with different analysts or equipment with in the same laboratory. Establish the ruggedness of the analytical method by using the assay of 6 different sample preparations of same batch by a different analyst using a different HPLC System. Calculate assay for all 6 sample preparations and report the %RSD for the same.
Acceptance criteria: The RSD for the assay values of 6 sample preparations of same batch should not be more than 2.0%.
Limit of Detection (LOD)
The detection limit is determined by the analysis of samples with known concentration of analyte and by establishing that minimum level at which the analyte can reliably detected. The LOD are calculated from the calibration curve by using the formulas
LOD = 3.3 x SD/ b
Where,
SD- the estimate is the standard deviation of the peak area of the drugs.
b is slope of the corresponding calibration curve.
EXPERIMENTAL WORK
Chromatographic condition
The drug showed the maximum absorbance at 274 nm using a PDA detector. This wavelength was chosen for the detection of SOTA. Since there were no literature reviews on the analytical method development of SOTA, literature reviews were done on analysis of molecules having a similar structure. Initial trials were performed on a variety of solvents, flow rate, and stationary phase. The developed RP-HPLC method consisted of a mobile phase of acetonitrile and water (40:60) both containing 0.1% formic acid, had a flow rate of 1 ml/min and used stationary phase C6 phenyl column. The total run time was 10 minutes in isocratic mode. The injection volume was 10 µl. The peak was observed at 3.29 minutes
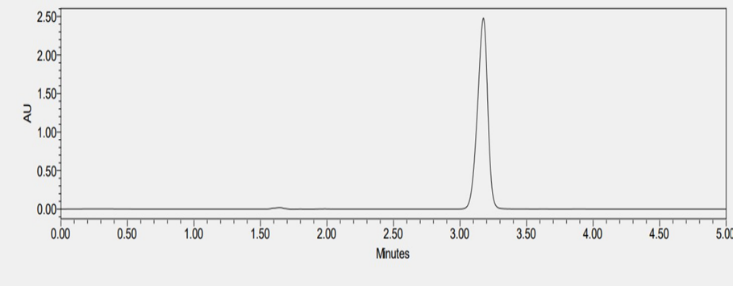
Figure : HPLC Chromatogram of SOTA
Method Validation:
Since the objective of the developed analytical method was to use this method for the analysis of SOTA in the formulation if any were created, it is essential to validate the method according to ICH guidelines. During the method validation study, a known concentration of the standard solution was injected on different days. Using Empower software, retention time, area of peak and peak purity of chromatogram factor were AU 0.00 0.50 1.00 1.50 2.00 2.50 Minutes 0.00 0.50 1.00 1.50 2.00 2.50 3.00 3.50 4.00 4.50 5.00 recorded. For method validation, parameters, such as precision, accuracy.
Specificity and Forced Degradation
For the specificity testing, the drug can be spiked into the mixture of known impurities related to the drug. For drugs which are well marketed as formulation, drugs can be spiked to mixture of excipient present in the formulation or synthesized degradant related to the drug product. However, for novel drug candidates which are in the verge of drug development and formulation studies, no or little information is available about drug impurity especially about drug’s degradant product. In this case, the ICH guideline recommends forced degradation of the novel API which generates the degradant product in the drug sample. Thus, formed drug-degradant mixture was run through chromatography techniques to determine the specificity of the developed analytical method. The specificity test is performed by the PDA detector. SOTA is a novel drug candidate with no knowledge of the degradant product. To determine the specificity test for the developed analytical method of SOTA, stress testing was formed. Methods for forced degradation were optimized to produce degradation up to 30% of the compound. Literature review suggested that cosolvents can be used to increase the solubility of the drug. Here, the drug dissolved in DMSO was treated with an acidic and basic solution. After the completion of degradation, samples were treated with suitable NaOH/HCl to stop the degradation. Thermal degradation on liquid drug was performed by application of heat at 80 ?C. In all the stressed samples, there was no change in color. The drug was quite stable in acid. There was almost no degradation when the drug was subjected to 0.2 N HCl for 24 hours at room temperature. So, the drug was subjected to a higher temperature to force the degradation. Finally, a drug degradation of 23.19% was obtained at 50 ?C with 0.2 N after 5 hours of exposure. The drug degradation was confirmed by the reduction of peak area when compared to standard. The figure 14 shows chromatogram of SOTA under acidic condition. The degradation product was not detected in the chromatogram. There are multiple theories about why the degradant product was not observed. The degradant product may be volatile, have no chromatophore functional group, may get eluted too early, or get retained in the column. For base hydrolysis, initially, the drug was subjected to 0.2 N NaOH for 30 minutes. At this condition there was complete degradation. Subsequently, the drug was exposed to less stressful conditions with 0.1 N NaOH for 15 minutes. However, there was almost total degradation of the drug. Finally, the drug was subjected to 0.1 NaOH for 5 minutes. In that case, too, almost the entire drug was degraded. The degradation peak was formed around 2.05 minutes, with a total loss of parent peak. Figure 15 represents the chromatogram of SOTA under base hydrolysis condition. The drug seems to degrade more easily with 3% hydrogen peroxide around 7 hours at 25 ?C. The degradation peak from oxidation was seen at 6 minutes. Figure 16 shows the chromatogram of SOTA under oxidative condition. The drug seems to be less stable with thermal degradation at the temperature of 80 ?C for 2 hours leading to degradation of 16.19%. Figure 17 refers to degradation chromatogram of SOTA under thermal stress. Like acid hydrolysis, there was no degradant peak was detected during thermal degradation process. Table 6 shows the degradation profile of SOTA under various stressful condition. For the determination of impurities, the same analytical method as of SOTA was used. Initially, the total run time was 60 minutes for every degradation procedure. Since, degradants were detected within 10 minutes, the total run for degradant was fixed at 10 minutes. Specificity of the chromatogram exposed to various degradation conditions were analyzed by peak purity parameter from Empower software. In each case, purity angle was less than threshold angle. From the forced degradation study, it can be concluded that chromatogram peak obtained by the analysis of API in all the stress conditions were homogenous, pure and unchanged by the presence of its degradation products, confirming the stability-indicating nature of the method. Hence, the developed method can be used to quantify the drugs in the presence of its degradation products.
Table : Specificity profile of the drug Stress Condition
|
Stress Condition |
Retention time |
Purity angle |
Purity threshold |
|
Normal |
3.294 |
0.126 |
0.257 |
|
Oxidative |
3.294 |
0.183 |
0.481 |
|
Acid |
3.288 |
0.139 |
0.242 |
|
Base |
3.340 |
0.151 |
0.439 |
|
Thermal |
3.301 |
0.288 |
0.709 |
Table Degradation profile of the drug
|
Degradation Study |
Degradation condition |
Exposure time |
Degradation % |
|
Acid Hydrolysis |
0.2 N HCL/50 ?C |
7 hrs |
23.19 |
|
Base Hydrolysis |
0.1N NaOH/ Room Temperature |
5 mins |
99.99 |
|
Oxidative Degradation |
1.5% H2O2/ Room Temperature |
7 hrs |
28.25 |
|
Thermal degradation |
80 ?C |
2 hrs |
16.19 |
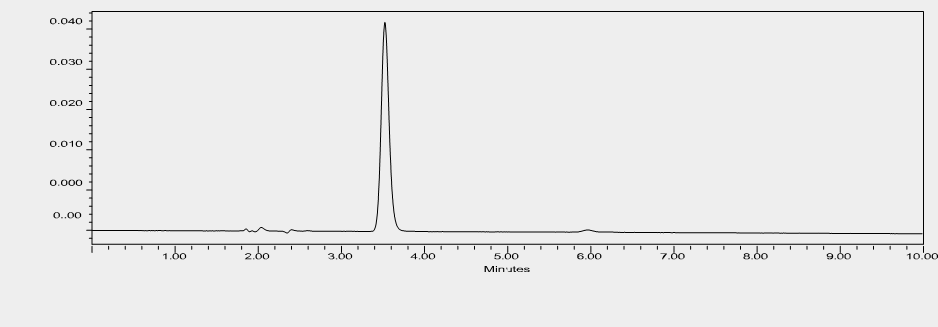
Figure : HPLC chromatogram of SOTA under acid hydrolysi
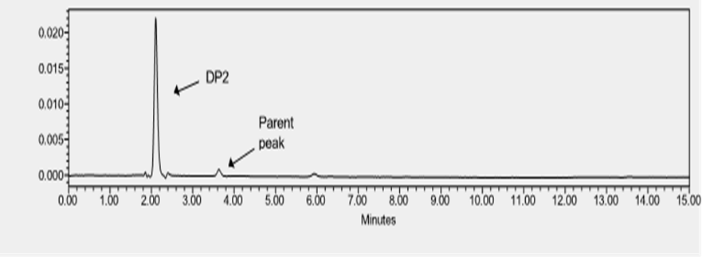
Figure : HPLC chromatogram of SOTA under base hydrolysis
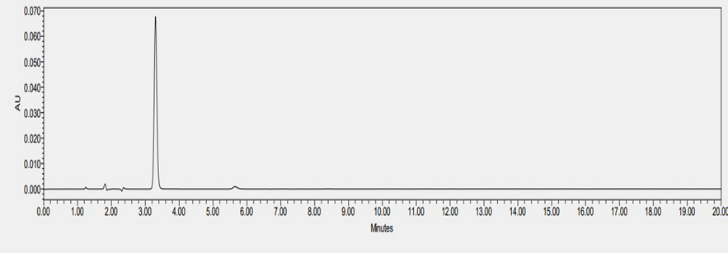
Figure : HPLC chromatogram of SOTA under thermal stress
Precision
The developed analytical method should have an acceptable level of precision. The % RSD of six replicates at three different concentrations 1.95 µM, 15.62 µM, and 62.5 µM was found to be 1.98, 1.05 and 1.98, respectively. The inter-day repeatability test of drug concentrations 1.95 µM, 15.62 µM, and 62.5 µM performed at 3 consecutive days was found to be 1.73, 1.06 and 0.69, respectively. Since in table 8, the inter-day and intra- day repeatability test was given, so as per the ICH guidelines the newly developed method was confirmed to be precise.
Table inter-day and intra-day repeatability
|
Drug concentration (µM) |
Intraday Repeatability (%) |
Inter-day Repeatability (%) |
|
1.95 |
1.98 |
1.73 |
|
15.62 |
1.73 |
1.06 |
|
62.5 |
1.067 |
0.699 |
Linearity
The least-squares linear regression range. Figure 18 shows the calibration curve of SOTA over the range of 1.953125-62.5 µM.
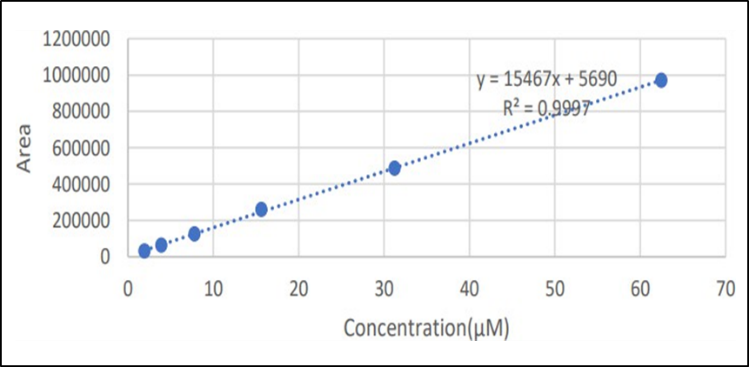
Figure : Calibration curve of SOTA
Robustness
The evaluation of robustness should be considered during the development phase and depends on the type of procedure under study. It should show the reliability of an analysis with respect to deliberate variations in method parameters. If measurements are susceptible to variations in analytical conditions, the analytical conditions should be suitably controlled or a precautionary statement should be included in the procedure. One consequence of the evaluation of robustness should be that a series of system suitability parameters (e.g., resolution test) is established to ensure that the validity ofthe analytical procedure is maintained whenever used. Examples of typical variations are: Stability of analytical solutions. Extraction time in the case of liquid chromatography, examples of typical variations are:
The robustness of an analytical procedure is a measure of its capacity to remain unaffected by small, but deliberate variations in method parameters and provides an indication of its reliability during normal usage Robustness is the ability of the procedure to provide analytical results of acceptable accuracy and precision under a variety of conditions. The results from separate samples are influenced by changes in the operational or environmental conditions. Robustness should be considered during the Development phase and should show the reliability of an analysis when deliberate variations are made in method parameters. Both the ICH and the USP guidelines define the robustness of an analytical procedureas a measure of its capacity to remain unaffected by small but deliberate variations in procedural parameters listed in the documentation, providing an indication of the method's or procedure's suitability and reliability during normal use. But while robustness shows up in both guidelines, interestingly enough, it is not in the list of suggested or typical analytical characteristics used to validate a method (again, this apparent discrepancy is changing in recently proposed revisions to USP. Robustness traditionally has not been considered as a validation parameter in the strictest sense because usually it is investigated during method development, once themethod is at least partially optimized. When thought of in this context, evaluation of robustness during development makes sense as parameters that affect the method can be identified easily when manipulated for selectivity or optimization purposes. Robustness measures the capacity of an analytical method to remain unaffected by small but deliberate variations in method parameters. It also provides some indicationof the reliability of an analytical method during normal usage. Parameters that shouldbe investigated are percent organic content in the mobile phase, pH of the mobile phase, buffer concentration, temperature, and injection volume. These parameters maybe evaluated one factor at a time or simultaneously as part of a factorial experiment
As the % RSD of retention time and asymmetry were within limits for variationin flow rate (± 0.5ml). Hence the allowable flow rate should be within 0.5 ml to 1.0 ml. The results of robustness for effect of variation in flow rate are tabulated in Table No.9
Robustness Result for SOTA
Table No.9 Robustness Result for variation in flow rate
|
Flow Rate (ml/min) |
System Suitablity Result |
|
|
Plate Count |
Sp Tailling |
|
|
0.5 |
4236 |
1.48 |
|
1 |
4239 |
1.48 |
|
1.5 |
4963 |
1.56 |
Results for actual flow (0.5 ml/min) have been considered from assay standard. The % RSD of retention time and asymmetry were within limits for variation in flow rate (± 0.1 ml)
Effect of variation in mobile phase composition
The results of robustness for effect of variation in mobile phase composition are tabulated in Table No.10.
Table . Robustness Result for variation in Mobile Phase
|
Change In composition in Mobile Phase |
System Suitablity Result |
|
|
Plate Count |
Sp Tailling |
|
|
2 % less |
4239 |
1.43 |
|
Actual |
4242 |
1.43 |
|
2% More |
4966 |
1.51 |
Results for actual mobile phase composition (50:50 acetonitrile: Methanol: phosphate buffer) has been considered from accuracy standard. The % RSD of retention time and asymmetry were within limits for variation (+2 %) in composition of mobile phase. Hence the method was found to be robust.
LOD and LOQ
The LOD and LOQ of the developed analytical method of SOTA was calculated using the following formulae:
respectively, where SD is the standard deviation of Y-intercept of the calibration curve and S is slope of a calibration curve. LOD and LOQ were found to be 0.32 µM and 1.09 µM, respectively.
Accuracy
Recovery studies of samples in three concentration levels 1.953125 µM, 15.625 µM, and 62.5 µM were conducted. The individual and overall percentage recovery and %RSD of the API were found within 95 to 105%. Table 11 represents accuracy value of SOTA at three different concentrations. Since the recovery values from all three concentration was found to be between 95 to 105%, the method is considered to be accurate.
Table : Accuracy value of SOTA
|
Theoretical value (µM) |
Found value(µg/ml) |
Recovery (%) |
|
1.95 |
1.90±0.67 |
97.43 |
|
15.62 |
15.43±0.09 |
98.81 |
|
62.5 |
62.47±0.33 |
99.95 |
RESULT
The working condition for the HPLC established for SOTA then was applied on pharmaceutical dosage forms. A simple reverse phase High Performance Liquid Chromatography has been developed and subsequently validated. The separation method was carried out by using a mobile phase consisting of acetonitrile ; water in the ratio of 40:60 v/v and buffer was added 0.1 % formic acid . The deduction was carried out by using UV detector at 300nm. The column was Agilent C 18 (250X4.6mm) 5µ. The flow rate was selected as 1.0ml/min. The retention time of SOTA was found to be 3.29 min. From the linearity studies, specified concentration levels were determined. It was observed that SOTA were linear in the range of 15 % to 240 % µg/ml for the target concentration by RP-HPLC with a correlation coefficient (r²) of 1.0 . The validation of the proposed method was verified by system precision and method precision by RP-HPLC The validation of the proposed method was verified by recovery studies. The percentage recovery range was found to be satisfied which represent in results. The ruggedness study was also performed. The robustness studies were performed. The validation of the proposed method was verified by system suitability. The % RSD of the system suitability for SOTA was found to be 0.99 respectively. The method demonstrated high precision with % RSD values below 2% for both intra-day and inter-day tests across three different concentrations (1.95 μM, 15.62 μM, and 62.5 μM). This indicates consistent performance of the method during different runs. Recovery studies at three concentration levels (1.95 μM, 15.62 μM, and 62.5 μM) showed recoveries between 97.43% and 99.95% with %RSD within acceptable limits, confirming the method's accuracy. A calibration curve was established over the range of 1.953125 to 62.5 μM with a good linear relationship (Figure 18), indicating the method's suitability for quantitative analysis. The LOD and LOQ were determined to be 0.32 μM and 1.09 μM, respectively, demonstrating the method's sensitivity.
Robustness: Variations in mobile phase composition (+/-2%) did not significantly affect system suitability parameters, with %RSD of retention time and asymmetry within limits, underscoring the method's robustness.
Degradation Studies: Under oxidative, acid, base, and thermal stress, SOTA exhibited varying degrees of stability. Notably, it was quite stable under acid hydrolysis but degraded significantly under base hydrolysis (~99.99% degradation) and oxidative conditions (>28%). Thermal degradation resulted in a 16.19% loss, while acid degradation showed minimal change. Importantly, no degradant peaks were observed in some stress conditions (acid and thermal), implying some limitations in detectability or nature of potential degradants.
DISCUSSION
The validation outcomes affirm that the developed HPLC method is accurate, precise, sensitive, and robust for the quantitative analysis of SOTA in pharmaceutical formulations. Its high recovery rates and low % RSD values indicate reliability and reproducibility, complying with ICH guidelines. The linearity across the tested concentration range allows for accurate quantification of SOTA in various samples. Stress testing revealed that SOTA is vulnerable to basic and oxidative environments, confirming the necessity for careful handling and storage conditions to maintain stability. The absence of detectable degradation peaks under certain conditions (e.g., acid hydrolysis) suggests that the drug either forms volatile or non-chromophoric degradants or remains intact under those stresses, which is promising for its formulation stability. However, the significant degradation under basic and oxidative conditions underscores the importance of controlling pH and oxidative exposure during manufacture and storage. Overall, the method proved to be stability-indicating, capable of distinguishing SOTA from potential degradation products, which is essential for quality control and ensuring drug safety and efficacy.
CONCLUSION
The validated HPLC method developed for the quantification of SOTA demonstrates high accuracy, precision, sensitivity, and robustness, making it suitable for routine quality control analysis. The method exhibits excellent linearity within the specified range and can reliably detect SOTA with low detection and quantification limits. Stress degradation studies confirm that SOTA is stable under acidic and thermal conditions but susceptible to degradation under basic and oxidative environments. The method's ability to accurately quantify SOTA amidst potential degradation products, coupled with its stability- indicating capability, ensures its suitability for routine analysis and stability testing of the drug. Overall, this analytical approach provides a reliable, specific, and comprehensive tool for the quality assessment of SOTA in pharmaceutical formulations
DISCLAIMER (ARTIFICIAL INTELLIGENCE): Author(s) hereby declare that NO generative AI technologies such as Large Language Models (ChatGPT, COPILOT, etc) and text-to-image generators have been used during writing or editing of this manuscript.
CONSENT: It is not applicable.
ETHICAL APPROVAL: It is not applicable.
ACKNOWLEDGEMENTS
The authors would like to acknowledge the Faculty of Pharmaceutical Chemistry and Analysis at Gondwana University Gadchiroli for facilitating the accomplishment of the current work. The research did not receive any funding. The research was performed at Maharashtra Institute of Pharmacy, Betala, Bramhapuri.
COMPETING INTERESTS: Authors have declared that no competing interests exist.
REFERENCES


Aman Yadav, Anup Barsagade, RP-HPLC Based Analytical Method Development and Validation of Sotagliflozin in Pharmaceutical Dosage Form, Int. J. of Pharm. Sci., 2025, Vol 3, Issue 7, 776-789. https://doi.org/10.5281/zenodo.15826612
 10.5281/zenodo.15826612
