1,2,3,4 Assistant Professor, Vidya Niketan Institute of Pharmacy and Research Center, Pune- Nashik Highway, A/P-Bota, tal-Sangamner, Dist- Ahilyanagar-422602
5,6, Assistant Professor, Shri Sai institute of pharmacy and research, MIDC Industrial Area, Chhatrapati Sambhaji Nagar, Maharashtra-431006
7,8 Loknete Shri Dadapatil Pharate College of Pharmacy, Mandavgan Pharata, Shirur Dist pune, Maharashtra-412211.
A rapid, accurate, and precise RP-HPLC method was developed for the simultaneous estimation of Indapamide, Amlodipine besylate, and Perindopril erbumine in a combined dosage form. The method utilized a Waters HPLC system with Empower2 software, a UV detector, and a BDS Hypersil C18 column (4.6 × 150 mm, 5 µm). The mobile phase consisted of phosphate buffer (pH 3.0) and acetonitrile (40:60) at a flow rate of 1 mL/min, with detection at 235 nm. The retention times for Indapamide, Amlodipine besylate, and Perindopril erbumine were 2.54, 3.65, and 4.14 minutes, respectively. Assay studies confirmed that the formulation contained 100.12% Indapamide, 100.32% Amlodipine besylate, and 100.42% Perindopril erbumine. System suitability parameters, including theoretical plates, tailing factor, and resolution, were within acceptable limits. The method demonstrated linearity within the concentration range of 3–18 µg/mL for Indapamide, 3–5 µg/mL for Amlodipine besylate, and 3–6 µg/mL for Perindopril erbumine. The accuracy results showed recoveries of 99.22%, 99.21%, and 99.61% for Indapamide, Amlodipine besylate, and Perindopril erbumine, respectively. Precision studies indicated %RSD values below 2%, confirming method reproducibility. Robustness and ruggedness evaluations showed minimal variability under slight changes in analytical conditions. The method was validated as per ICH guidelines and proved to be simple, precise, specific, and economical. It is suitable for routine quality control analysis of these drugs in pharmaceutical formulations.
The development and validation of robust analytical methods are fundamental to ensuring the quality, efficacy, and safety of pharmaceutical formulations. Reverse Phase High-Performance Liquid Chromatography (RP-HPLC) is a widely employed technique for the precise, accurate, and reliable quantification of active pharmaceutical ingredients (APIs) in bulk drugs and formulations. This analytical technique is preferred due to its high resolution, reproducibility, and ability to separate complex drug mixtures under optimized chromatographic conditions.1-5 The present study is focused on the development and validation of an RP-HPLC method for the simultaneous determination of three essential antihypertensive agents-Perindopril Erbumine, Indapamide, and Amlodipine Besylate-in pharmaceutical dosage forms. These drugs are frequently prescribed in combination for the effective management of hypertension and associated cardiovascular disorders, necessitating a validated analytical method for quality control and regulatory compliance.6-12 Hypertension, often referred to as a "silent killer," is a major global health burden that significantly increases the risk of cardiovascular diseases, stroke, kidney failure, and other complications. The effective management of hypertension often requires combination therapy, wherein drugs with complementary mechanisms of action are co-administered to achieve optimal blood pressure control while minimizing side effects. Perindopril Erbumine, Indapamide, and Amlodipine Besylate are a well-established combination used for this purpose. Perindopril Erbumine is an angiotensin-converting enzyme (ACE) inhibitor that acts by blocking the conversion of angiotensin I to angiotensin II, a potent vasoconstrictor responsible for increasing blood pressure. By inhibiting this pathway, Perindopril leads to vasodilation, reduced blood volume, and ultimately lower blood pressure, thus improving cardiac function and reducing the risk of heart failure and stroke.13-16
<a href="https://www.ijpsjournal.com/uploads/createUrl/createUrl-20250329184107-2.png" target="_blank">
<img alt="structure of perindopril erbumine.png" height="150" src="https://www.ijpsjournal.com/uploads/createUrl/createUrl-20250329184107-2.png" width="150">
</a>
Fig. 1: structure of perindopril erbumine.
Indapamide, a thiazide-like diuretic, is known for its dual mechanism of action. It promotes diuresis by inhibiting sodium and chloride reabsorption in the distal convoluted tubule of the nephron, thereby increasing the excretion of sodium and water. This reduction in plasma volume leads to a decrease in blood pressure. Additionally, Indapamide exhibits direct vasodilatory effects, contributing further to blood pressure reduction.17-20 Unlike conventional thiazide diuretics, Indapamide is often preferred for its minimal metabolic side effects, making it suitable for long-term use in hypertensive patients, especially those at risk of metabolic disturbances.
<a href="https://www.ijpsjournal.com/uploads/createUrl/createUrl-20250329184107-1.png" target="_blank">
<img alt="structure of indapamide.png" height="150" src="https://www.ijpsjournal.com/uploads/createUrl/createUrl-20250329184107-1.png" width="150">
</a>
Fig. 2: structure of indapamide
Amlodipine Besylate is a dihydropyridine calcium channel blocker that exerts its antihypertensive effect by inhibiting the influx of calcium ions into vascular smooth muscle and cardiac muscle cells. This inhibition leads to arterial vasodilation, reduced peripheral vascular resistance, and improved blood flow, thereby lowering blood pressure. Amlodipine is particularly beneficial in patients with hypertension accompanied by angina or other ischemic heart conditions due to its ability to reduce myocardial oxygen demand while maintaining coronary perfusion.21-25
<a href="https://www.ijpsjournal.com/uploads/createUrl/createUrl-20250329184107-0.png" target="_blank">
<img alt="Structure of Amlodipine Besylate.png" height="150" src="https://www.ijpsjournal.com/uploads/createUrl/createUrl-20250329184107-0.png" width="150">
</a>
Fig. 3: Structure of Amlodipine Besylate
Given the widespread clinical use of this fixed-dose combination in the treatment of hypertension, it is imperative to develop a validated, precise, and cost-effective RP-HPLC method for its simultaneous determination in pharmaceutical formulations. The RP-HPLC technique offers advantages such as high sensitivity, specificity, and shorter analysis time, making it an indispensable tool in pharmaceutical quality control laboratories. However, method development requires careful optimization of chromatographic conditions, including the selection of the stationary and mobile phases, flow rate, detection wavelength, and column parameters to achieve optimal separation and peak resolution.26-28
Furthermore, regulatory authorities such as the International Council for Harmonisation (ICH) mandate that analytical methods undergo thorough validation to ensure their reliability and reproducibility. Key validation parameters, including linearity, accuracy, precision, specificity, limit of detection (LOD), limit of quantification (LOQ), and robustness, must be systematically evaluated to confirm that the method is suitable for routine analysis. Compliance with these stringent guidelines ensures that the developed method meets regulatory standards, thereby facilitating the safe and effective use of these antihypertensive drugs in clinical practice.29-32 This research aims to establish and validate an RP-HPLC method that is simple, accurate, and cost-effective for the simultaneous determination of Perindopril Erbumine, Indapamide, and Amlodipine Besylate in pharmaceutical formulations. The successful development of this method will enhance the quality control process in pharmaceutical industries, ensuring consistent drug content, stability, and therapeutic efficacy. Ultimately, this study contributes to the broader goal of improving medication quality and patient safety by providing a reliable analytical approach for antihypertensive drug analysis.
MATERIALS AND METHODS:
MATERIALS:
The study utilized high-precision analytical instruments, including an analytical balance (Unibloc Model, Shimadzu, Libror) for accurate weighing, an HPLC system (LC-2010, Shimadzu Corporation, Japan) for chromatographic separation, and a UV-Visible Spectrophotometer (UV-2550, Shimadzu Corporation, Japan) for determining absorption maxima. High-purity solvents and reagents were used, including HPLC-grade water, methanol, and acetonitrile, along with AR-grade potassium dihydrogen phosphate, dipotassium hydrogen phosphate, sodium hydroxide (0.1M), hydrochloric acid, and ortho phosphoric acid for buffer preparation and pH adjustment. Pure drug standards of perindopril erbumine, indapamide, and amlodipine besylate were obtained from Chandralabs Pvt. Ltd., Hyderabad, for method development and validation. The HPLC column was conditioned by washing with methanol: water (20:80, v/v) for 30 minutes, followed by equilibration with the mobile phase for another 30 minutes to ensure system stability. The detector response was monitored until a stable baseline was achieved, ensuring optimal chromatographic conditions for accurate and precise quantification of the antihypertensive drugs.
METHODS:
Optimization of Mobile Phase Composition
The study involved a series of trials to determine the optimal mobile phase composition for chromatographic analysis.
Preparation of Standard and Sample Solutions
A standard solution was prepared by dissolving 15 mg of indapamide, 25 mg of perindopril erbumine, and 25 mg of amlodipine besylate in a 50 ml volumetric flask with methanol, then diluting to volume with the mobile phase. A 0.5 ml aliquot of this solution was further diluted to 10 ml using the mobile phase. For the sample preparation, 10 tablets were weighed, their average weight calculated, and then powdered. A 500 mg portion of the powdered sample was dissolved in methanol, transferred to a 50 ml volumetric flask, and diluted to volume with the mobile phase. A 0.5 ml aliquot of this solution was further diluted to 10 ml using the mobile phase.36 The assay percentage was calculated based on the average peak areas of standard and sample preparations, considering the weight of the working standard, its percentage purity, average weight, and label claim.37
Method Validation
The developed chromatographic method was validated according to parameters including system suitability, specificity, linearity, accuracy, precision, robustness, and determination of the limit of detection (LOD) and limit of quantification (LOQ).38
System Suitability and Specificity
System suitability was evaluated by preparing a stock solution of 15 mg of indapamide, 25 mg of perindopril erbumine, and 25 mg of amlodipine besylate, followed by dilution with the mobile phase. A 0.5 ml aliquot was further diluted to 10 ml with the mobile phase. Specificity was examined by assessing potential interference from the blank and diluents. Stress conditions were applied, including heating at 40°C for 30 minutes, treatment with 0.1M hydrochloric acid, and treatment with 0.1M sodium hydroxide, to observe degradation patterns and retention time shifts.39
Linearity and Accuracy
Linearity was determined by preparing solutions with increasing volumes (0.1 to 0.6 ml) of the stock solution, diluted to 10 ml with the mobile phase, resulting in concentration ranges of:
Accuracy was assessed by spiking standard solutions and preparing accuracy samples at three concentration levels:
Precision and Robustness
Precision was evaluated in three aspects:
Robustness was determined by assessing the impact of minor variations in chromatographic conditions. A stock solution was prepared and diluted (0.5 ml to 10 ml with mobile phase) to check for any significant variations.41-42
Determination of LOD and LOQ
The limit of detection (LOD) and limit of quantification (LOQ) were calculated using the signal-to-noise ratio method. The following equations were used:43-46
LOD = 3.3 × (standard deviation / slope)
LOQ = 10 × (standard deviation / slope)
RESULTS AND DISCUSSION
Trials
Trial-I
In the first trial, the system suitability parameters for Indapamide, Amlodipine besylate, and Perindopril erbumine were evaluated. The tailing factors obtained were 1.600, 1.515, and 1.742, respectively. The theoretical plates recorded were 1353, 2378, and 1246, while the resolution was 12.593. The retention times for the three drugs were 1.8, 6.4, and 4.3 minutes, respectively.
Trial-II
The second trial exhibited a tailing factor of 1.333, 2.192, and 1.974 for the respective drugs. The theoretical plate values improved to 2372, 2898, and 3216. The resolution increased to 18.534, while the retention times were 1.7, 10.1, and 5.1 minutes.
Trial-III
In the third trial, the tailing factors were further optimized to 1.074, 1.159, and 1.892. The theoretical plates increased significantly to 1551, 7793, and 5236, while the resolution slightly reduced to 17.843. The retention times recorded were 1.6, 9.6, and 4.2 minutes.
Trial-IV
Trial-IV demonstrated the most suitable results with tailing factors of 1.429, 1.250, and 1.897. The theoretical plates were well within acceptable limits at 6081, 7394, and 4265, with a resolution of 7.416. The retention times were 2.54, 3.65, and 4.14 minutes, which were optimal for analysis.
Comparison of Trials: Upon evaluation, Trials I and II showed higher tailing factors that required reduction. Trials I and III required an increase in theoretical plates, while resolution needed optimization. Trial IV exhibited the best system suitability parameters and was therefore adopted as the optimized method.
Table 1: Optimized Method Parameters
|
Parameters |
Conditions |
|
Column (Stationary Phase) |
BDS HYPERSIL C18 (4.6 x 150mm, 5 µm) |
|
Mobile Phase |
Phosphate Buffer (pH 3.0): Acetonitrile (40:60) |
|
Flow rate (ml/min) |
1 |
|
Run time (min) |
20 |
|
Column temperature (°C) |
Ambient |
|
Volume of injection (µL) |
20 |
|
Detection wavelength (nm) |
235 |
|
Drug Retention Time (min) |
2.54, 3.65 |
Assay
The assay for Indapamide, Amlodipine besylate, and Perindopril erbumine was performed using HPLC, and the results were calculated as per the standard assay procedure.
Table 2: Assay Results
|
Drug |
% Assay |
|
Indapamide |
100.21% |
|
Amlodipine besylate |
100.42% |
|
Perindopril erbumine |
100.42% |
The assay results indicate that the formulation contains the labeled amount of each drug, confirming accuracy and precision.
Validation Results
System Suitability
System suitability was assessed by injecting prepared solutions into the HPLC system. The results are summarized below:
Table 3: System Suitability Results
|
Parameter |
Indapamide |
Amlodipine besylate |
Perindopril erbumine |
|
RT (min) |
2.51 |
3.62 |
4.14 |
|
Tailing Factor |
1.429 |
1.250 |
1.897 |
|
Theoretical Plates |
6081 |
7394 |
4265 |
The results confirm that all system suitability parameters were within acceptable limits.
Specificity
The specificity of the method was verified by injecting diluent, standard preparation, and assay preparations into the HPLC system. The retention times for the standard and assay preparations were consistent, confirming specificity.
Table 4: Specificity Results
|
Solution |
Retention Time (min) |
|
Indapamide Standard Preparation |
2.52 |
|
Indapamide Assay Preparation |
2.51 |
|
Amlodipine besylate Standard Preparation |
3.63 |
|
Amlodipine besylate Assay Preparation |
3.62 |
|
Perindopril erbumine Standard Preparation |
4.14 |
|
Perindopril erbumine Assay Preparation |
4.14 |
Stress Testing
Stress testing was performed under different conditions to evaluate stability. The results indicate no degradation under these conditions.
Table 5: Specificity Results under Stress Conditions
|
Stress Condition |
Observed Result |
|
Heated on water bath |
No degradation occurred |
|
Treated with acid |
No change in retention of peak |
|
Treated with base |
No degradants formed |
LINEARITY
In HPLC, injected the each concentration of the solution prepared as per the method and the results were given in the following tables,
Table 6: Linearity Results: (for indapamide)
|
S. No |
Linearity Level |
Concentration (mcg) |
Area (mV.s) |
|
1 |
I |
3 |
68.577 |
|
2 |
II |
6 |
136.152 |
|
3 |
III |
9 |
189.157 |
|
4 |
IV |
12 |
228.469 |
|
5 |
V |
15 |
284.891 |
|
6 |
VI |
18 |
332.874 |
|
Correlation Coefficient |
0.997 |
||
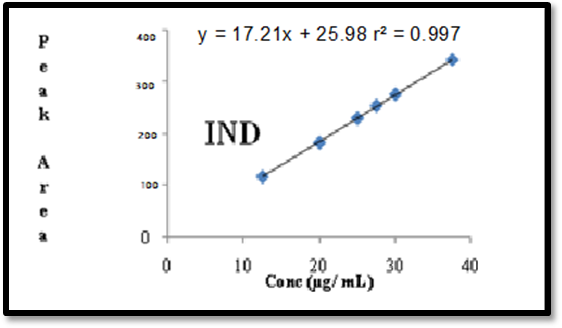
Fig. 4: Calibration plot for Indapamide
Table 7: Linearity Results: (for Amlodipine besylate)
|
S. No |
Linearity Level |
Concentration (mcg) |
Area (mV.s) |
|
1 |
I |
5 |
157.532 |
|
2 |
II |
10 |
301.879 |
|
3 |
III |
15 |
436.291 |
|
4 |
IV |
20 |
552.655 |
|
5 |
V |
25 |
666.779 |
|
6 |
VI |
30 |
790.165 |
|
Correlation Coefficient |
0.998 |
||
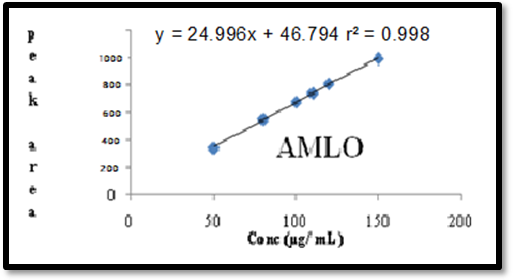
Fig. 5: Calibration plot for Amlodepine besylate
Table 8: Linearity Results: (for Perindopril erbumine)
|
S. No |
Linearity Level |
Concentration (mcg) |
Area (mV.s) |
|
1 |
I |
5 |
257.532 |
|
2 |
II |
10 |
451.879 |
|
3 |
III |
15 |
586.291 |
|
4 |
IV |
20 |
642.645 |
|
5 |
V |
25 |
706.779 |
|
6 |
VI |
30 |
850.165 |
|
Correlation Coefficient |
0.999 |
||
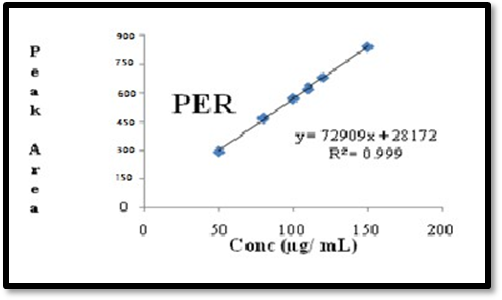
Fig. 6: Calibration plot for Perindopril erbumine Acceptance criteria
Correlation coefficient should be not less than 0.9
On evaluation of above results % RSD values are within the limit hence the curve shows linearity at concentration range 3µg/ml-18µg/ml for indapamide and 5µg/ml-30µg/ml for Amlodepine besylate and 5µg/ml-30µg/ml of Perindopril erbumine.
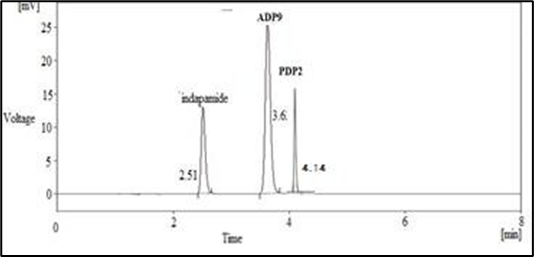
Fig. 7: Linearity of indapamide(3mcg), Amlodepine besylate(5mcg) and Perindopril erbumine(5mcg)
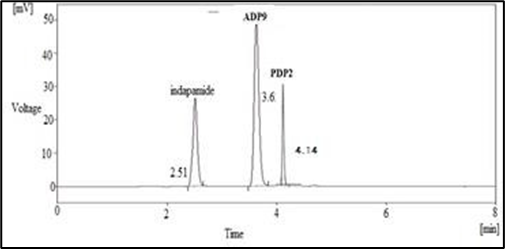
Fig. 8: Linearity of indapamide(6mcg), Amlodepine besylate(10mcg) and Perindopril erbumine(10mcg)
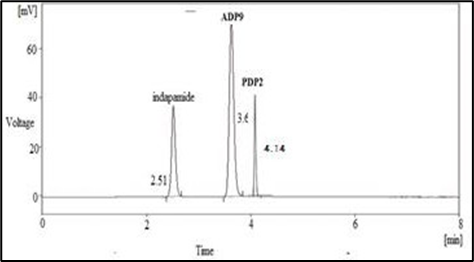
Fig. 9: Linearity of indapamide (9mcg), Amlodepine besylate(15mcg) and Perindopril erbumine(15mcg)
ACCURACY:
In HPLC, injected each concentration of the solution prepared as per the method (6.4) and the results were given in the following tables,
Table 9: Accuracy results for indapamide
|
(at specification Level) |
Area |
Amount Added (mcg) |
Amount Found (mcg) |
% Recovery |
Mean Recovery |
|
80% |
262.1347 |
13.5 |
13.46 |
99.70% |
99.22% |
|
100% |
318.4707 |
16.5 |
16.31 |
98.84% |
|
|
120% |
368.3263 |
19.5 |
19.33 |
99.12% |
Table 10: Accuracy results of Amlodepine besylate
|
%Concentration
(at specification Level) |
Area |
Amount Added (mcg) |
Amount Found (mcg) |
% Recovery |
Mean Recovery |
|
80% |
637.1297 |
22.5 |
22.31 |
99.16% |
99.21% |
|
100% |
777.3993 |
27.5 |
27.22 |
98.98% |
|
|
120% |
883.5633 |
32.5 |
32.34 |
99.50% |
Table 11: Accuracy results of Perindopril erbumine
|
%Concentration
(at specification Level) |
Area |
Amount Added (mcg) |
Amount Found (mcg) |
% Recovery |
Mean Recovery |
|
80% |
237.1477 |
22.5 |
22.30 |
99.26% |
99.61% |
|
100% |
354.1493 |
27.5 |
27.2 |
99.48% |
|
|
120% |
420.7512 |
32.5 |
32.47 |
99.70% |
The % Recovery for each level should be between 98.0 to 102.0%. From the results shown in accuracy, it was found that the percentage recovery values pure drug from the pre analyzed solutions of formulations were in between 99.26% for indapamide, 99.48% for Amlodepine besylate and Perindopril erbumine 99.70%, which indicates that the method was accurate.
ACCURACY CHROMATOGRAMS
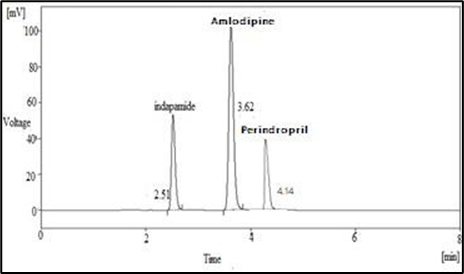
Fig. 10: Accuracy 80%
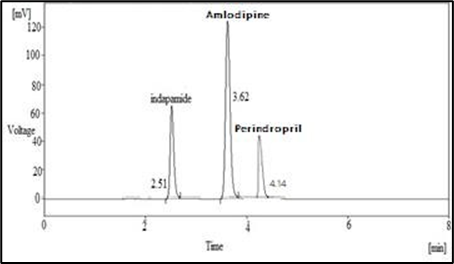
Fig. 11: Accuracy 100%
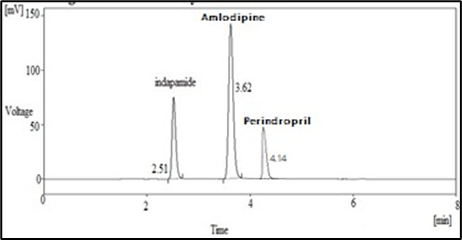
Fig. 12: Accuracy 120%
PRECISION:
In HPLC, injected six replicate injection of the solution prepared as per the method(6.5) and the results were given in the following table,
System precision:
Table 12: System precision results of indapamide
|
Injections |
Area[mv.s] |
|
1 |
285.986 |
|
2 |
287.305 |
|
3 |
285.395 |
|
4 |
289.254 |
|
5 |
286.513 |
|
6. |
284.562 |
|
Avg |
286.5025 |
|
Std dev |
1.641569 |
|
%RSD |
0.60 |
Table 13: System precision results for Amlodepine besylate
|
Injections |
Area[mV.s] |
|
1 |
685.131 |
|
2 |
680.701 |
|
3 |
676.947 |
|
4 |
679.709 |
|
5 |
680.747 |
|
6 |
679.988 |
|
Avg |
680.5372 |
|
Std dev |
2.647675 |
|
%RSD |
0.40 |
Table 14: System precision results for Perindopril erbumine
|
Injections |
Area[mV.s] |
|
1 |
235.124 |
|
2 |
234.701 |
|
3 |
236.649 |
|
4 |
232.439 |
|
5 |
224.977 |
|
6 |
227.938 |
|
Avg |
231.9713 |
|
Std dev |
1.847676 |
|
%RSD |
0.50 |
Method precision:
Table 15: Method precision results for indapamide
|
Injections |
Area[mV.s] |
|
1 |
280.641 |
|
2 |
281.961 |
|
3 |
281.057 |
|
4 |
282.752 |
|
5 |
281.340 |
|
6 |
283.343 |
|
Avg |
281.9502 |
|
Std dev |
1.157837 |
|
%RSD |
0.4 |
Table 16: Method precision results for Amlodepine besylate
|
Injections |
Area[mV.s] |
|
1 |
682.656 |
|
2 |
684.543 |
|
3 |
684.116 |
|
4 |
683.652 |
|
5 |
690.639 |
|
6 |
683.454 |
|
Avg |
684.8433 |
|
Std dev |
2.910083 |
|
%RSD |
0.5 |
Table 17: System precision results for Perindopril erbumine
|
Injections |
Area[mV.s] |
|
1 |
232.134 |
|
2 |
234.701 |
|
3 |
235.668 |
|
4 |
230.269 |
|
5 |
224.957 |
|
6 |
227.938 |
|
Avg |
230.9443 |
|
Std dev |
1.644367 |
|
%RSD |
0.50 |
The % RSD for the area of five standard injections results should not be more than 2%. From the results shown in precision, it was found that % RSD is less than 2%; which indicates that the proposed method has good reproducibility.
Intermediate precision (ruggedness):
Table 18: Intermediate precision results for indapamide
|
Injections |
Area [mV.s] |
|
|
|
Analyst-1 |
Analyst-2 |
|
1 |
283.566 |
283.524 |
|
2 |
280.452 |
284.433 |
|
3 |
282.421 |
282.455 |
|
4 |
283.433 |
282.754 |
|
5 |
281.543 |
284.653 |
|
6 |
282.233 |
282.335 |
|
Avg |
282.2747 |
283.5257 |
|
Std dev |
1.173872 |
0.906894 |
|
%RSD |
0.41 |
0.31 |
Table 19: Intermediate precision results for Amlodepine besylate
|
Injections |
Area [mV.s] |
|
|
|
Analyst-1 |
Analyst-2 |
|
1 |
680.323 |
681.09 |
|
2 |
683.376 |
683.544 |
|
3 |
683.455 |
683.423 |
|
4 |
685.431 |
685.573 |
|
5 |
683.747 |
685.431 |
|
6 |
684.412 |
685.443 |
|
Avg |
683.4573 |
684.084 |
|
Std dev |
1.715886 |
1.764708 |
|
%RSD |
0.30 |
0.31 |
Table 20: Intermediate precision results for Perindopril erbumine
|
Injections |
Area [mV.s] |
|
|
|
Analyst-1 |
Analyst-2 |
|
1 |
231.134 |
234.09 |
|
2 |
237.701 |
233.544 |
|
3 |
233.698 |
233.423 |
|
4 |
235.265 |
230.573 |
|
5 |
235.557 |
234.431 |
|
6 |
238.930 |
237.443 |
|
Avg |
230.9443 |
234.084 |
|
Std dev |
1.244367 |
1.364708 |
|
%RSD |
0.49 |
0.54 |
ROBUSTNESS:
The robustness of the method established by making minor variations in the method parameters like, change in flow rate by ± 10 % of actual flow rate.
Table 21: Robustness results for indapamide
|
S.No |
Flow Rate (ml/min) |
System Suitability Results |
|
|
USP Plate Count |
USP Tailing |
||
|
1 |
0.9 |
2242 |
1.5 |
|
2 |
1.0 |
6081 |
1.4 |
|
3 |
1.1 |
3283 |
1.6 |
Table 22: Robustness results for Amlodepine besylate
|
S. No |
Flow Rate (ml/min) |
System Suitability Results |
|
|
USP Plate Count |
USP Tailing |
||
|
1 |
0.9 |
2804 |
1.6 |
|
2 |
1.0 |
7394 |
1.2 |
Table 23: Robustness results for Perindopril erbumine
|
S. No |
Flow Rate (ml/min) |
System Suitability Results |
|
|
USP Plate Count |
USP Tailing |
||
|
1 |
0.9 |
3872 |
1.7 |
|
2 |
1.0 |
4089 |
1.6 |
|
3 |
1.1 |
2876 |
1.4 |
The flow rate was varied at 1.0 ml/min to 1.2ml/minThe results are summarized On evaluation of the above results, it can be concluded that the variation in flow rate affected he method significantly. Hence it indicates that the method is not robust even by change in the flow rate ±10%.
ROBUSTNESS CHROMATOGRAMS
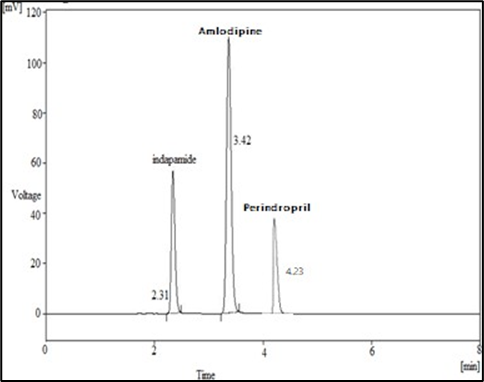
Fig. 13: Robustness 1.1ml flow
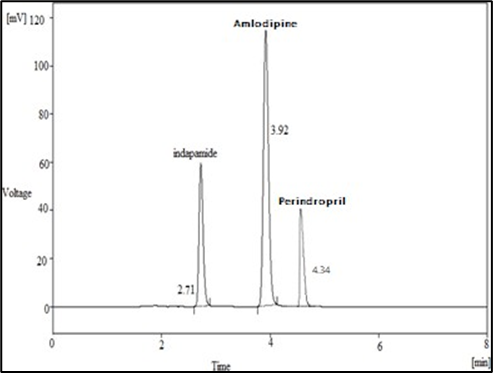
Fig. 14: Robustness 0.9 ml flow
LIMIT OF DETECTION:
Table 24: Limit of detection results
|
Drug Name |
Standard Deviation |
Slope |
Result (µg/ml) |
|
Indapamide |
1.641569 |
17.21 |
0.30 |
|
Amlodepine besylate |
2.647675 |
24.996 |
0.95 |
|
Perindopril erbumine |
1.640214 |
14.43 |
0.28 |
LIMIT OF QUANTIFICATION:
Table 25: Limit of quantification results
|
Drug Name |
Standard Deviation |
Slope |
Result (µg/ml) |
|
Indapamide |
1.641569 |
17.21 |
0.31 |
|
Amlodepine besylate |
2.647675 |
24.996 |
1.05 |
|
Perindopril erbumine |
2.645753 |
14.43 |
0.30 |
CONCLUSION:
A simple, rapid, accurate, and precise RP-HPLC method was successfully developed and validated for the simultaneous estimation of Indapamide, Amlodipine besylate, and Perindopril erbumine in combined dosage form. The method demonstrated well-resolved peaks with retention times of 2.54 min, 3.65 min, and 4.14 min for Indapamide, Amlodipine besylate, and Perindopril erbumine, respectively. The assay results confirmed drug content close to 100% for all three compounds, indicating the method's accuracy and reliability. System suitability parameters, including theoretical plates, resolution, and tailing factor, met the acceptance criteria. Linearity was established within the specified concentration ranges, and the method exhibited excellent accuracy, with percentage recovery values close to 100%. Precision studies confirmed the reproducibility of results, with %RSD values below 2%. Additionally, robustness and ruggedness studies indicated minimal variations under slight changes in analytical conditions, further validating the reliability of the method. Overall, the developed RP-HPLC method is specific, robust, and economical, making it suitable for routine quality control analysis of Indapamide, Amlodipine besylate, and Perindopril erbumine in pharmaceutical formulations.
REFERENCES

Rupali Tambe*, Vishakha Toradmal, Megha Kirve, Tanaya Wakchaure, Kavita Gaikwad, Ekta Chouthe, Snehal Shingne, Akshay Bhujbal, RP-HPLC Method Development and Validation for The Determination of Active Ingredients in Pharmaceuticals, Int. J. of Pharm. Sci., 2025, Vol 3, Issue 3, 3013-3029. https://doi.org/10.5281/zenodo.15105797
 10.5281/zenodo.15105797
