Rajgad Dnyanpeeth's College of Pharmacy, Bhor, Pune-412206, India
Objective To develop and validate a rapid, robust, and reliable reversed-phase high-performance liquid chromatography (RP-HPLC) method using Analytical Quality by Design (AQbD) principles for the simultaneous estimation of ferrous ascorbate and folic acid in bulk and pharmaceutical dosage forms. Significance This method addresses the need for a straightforward, accurate, and reproducible analytical technique for quality control of ferrous ascorbate and folic acid, ensuring precise measurement in combined formulations and supporting regulatory compliance for pharmaceutical analysis. Methods The RP-HPLC method was systematically optimized for chromatographic parameters, including detection wavelength, flow rate, and mobile phase composition, to achieve excellent separation and peak symmetry of both analytes. Method validation followed ICH Q2(R1) guidelines, evaluating system suitability, accuracy, linearity, and robustness. System suitability parameters such as retention time, peak area, theoretical plates, and tailing factor were assessed. Accuracy was determined at 50%, 100%, and 150% of target concentrations, and linearity was established over wide concentration ranges for both analytes. Robustness was tested by varying flow rates. Results • Consistent system suitability parameters were observed for both analytes, with retention times and peak characteristics within acceptable limits. • The method demonstrated high accuracy, with %RSD values well below 2% and mean recoveries between 98–102% at all tested concentrations. • Linearity was confirmed with correlation coefficients (r²) greater than 0.999 for both ferrous ascorbate and folic acid across their respective ranges. • The method proved robust, as deliberate flow rate changes did not significantly affect retention times or resolution, and all parameters remained within specified limits. Conclusions the AQbD-based RP-HPLC technique is validated as a simple, accurate, linear, and robust method suitable for routine quality control and quantitative analysis of ferrous ascorbate and folic acid in bulk and pharmaceutical formulations.
The combination of ferrous ascorbate and folic acid is widely used in antianemic therapies, necessitating robust analytical methods for quality control. While spectrophotometric and conventional RP-HPLC methods exist for individual or combined analysis, these approaches often lack systematic optimization of critical method parameters. Analytical Quality by Design (AQbD) addresses this gap through science-based risk evaluation and experimental design (DoE), aligning with ICH Q14 guidelines to enhance method robustness and regulatory flexibility (1). Traditional methods for these compounds face challenges due to their divergent physicochemical properties - ferrous ascorbate's iron complex structure (λ_max 265 nm) versus folic acid's conjugated pteridine ring system (λ_max 280-344 nm) [8]. Previous attempts at simultaneous RP-HPLC analysis encountered co-elution issues and mobile phase incompatibility, forcing separate analytical procedures. The AQbD framework enables systematic optimization of chromatographic parameters (column chemistry, pH, organic modifier ratio) through quality target profiles and risk assessment matrices (2). This study introduces an AQbD-driven RP-HLC method that simultaneously quantifies both analytes in pharmaceutical formulations. By employing central composite design to optimize critical method variables, we overcome the resolution challenges documented in earlier isocratic elution attempts. The approach integrates method operable design space concepts with validation per ICH Q2(R1), addressing the need for stability-indicating methods in complex matrices containing ascorbate degradation products (3).
MATERIALS:
Analytical Samples: Pure ferrous ascorbate and folic acid were procured as active pharmaceutical ingredients (APIs) for method development. Marketed formulations of the combination (tablet dosage form) were sourced for validation studies.
Chemicals Potassium dihydrogen phosphate (KH?PO?), acetonitrile (ACN), methanol, sodium hydroxide (NaOH), hydrochloric acid (HCl), and orthophosphoric acid (OPA) were utilized for the preparation of the mobile phase.
Instrumentation A photo-diode array (PDA) detector, a Fourier transform infrared (FT-IR) spectrometer, a UV/Vis spectrophotometer, and a reversed-phase high-performance liquid chromatography (RP-HPLC) equipment were all incorporated in the device.
Software used included Design-Expert® (vX) for experimental design, response surface methodology (RSM), and statistical analysis (4).
METHOD:
Authentication of Pure Drug Samples
FT-IR Spectroscopy was employed to confirm the molecular identity of ferrous ascorbate and folic acid. For ferrous ascorbate, the FT-IR spectrum revealed characteristic peaks corresponding to C=O stretching (1700 cm?¹) and Fe-O vibrations (600–800 cm?¹). Folic acid had a number of different absorption bands, one of which was the stretching of C=O (1680 cm?¹) and NH bending vibrations (1550 cm?¹). These spectral data aligned with literature-reported peaks, confirming sample authenticity (5).
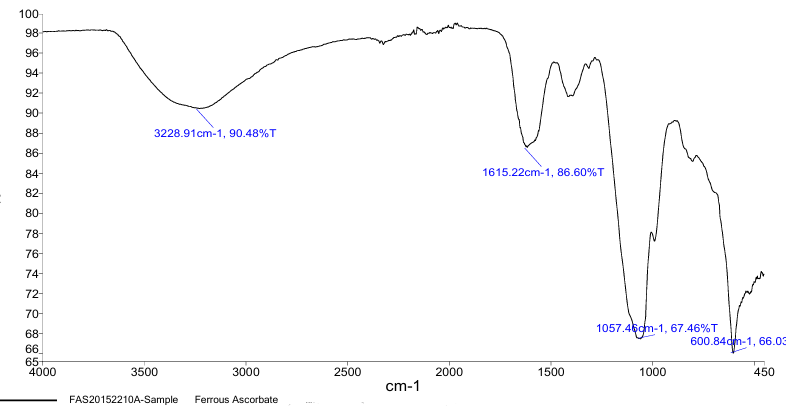
Fig.1. IR Spectra of ferrous ascorabte.
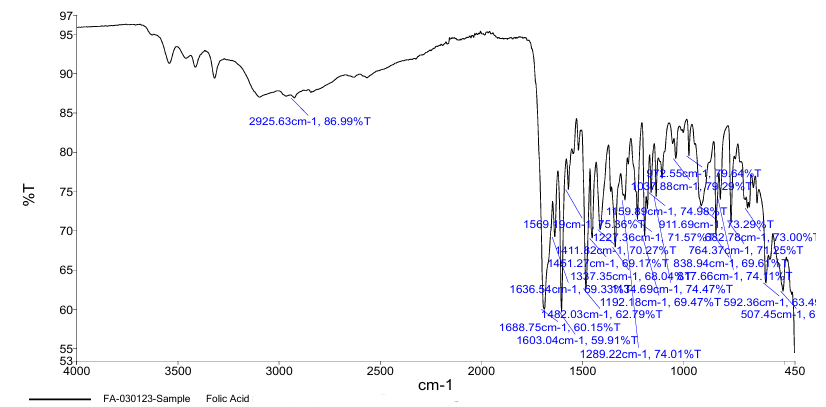
Fig.2. FT-IR Spectrum of Folic Acid.
RP-HPLC Method Development
Mobile Phase Optimization focused on balancing analyte solubility, retention, and resolution. A potassium dihydrogen phosphate buffer (pH 3.0–4.5) was selected for its stability and compatibility with ferrous ascorbate, while acetonitrile (ACN) replaced methanol due to superior peak symmetry and lower viscosity. The detection wavelength (225 nm) was chosen based on UV overlay spectra to maximize absorbance for both analytes. Standard Stock Solutions were produced by dissolving ten milligrams of ferrous ascorbate in distilled water (100 µg/mL) and 10 mg of folic acid in 0.1 N NaOH (100 µg/mL), followed by sonication and dilution (6).
Column Selection favored a C18 (150 mm × 4.6 mm, 5 µm) for its ability to retain polar ferrous ascorbate and resolve folic acid’s conjugated structure. Flow Rate Optimization tested 0.8–1.2 mL/min: 1.0 mL/min provided optimal resolution (R >2.0) and peak symmetry (tailing factor <2.0) while minimizing run time.
Design of Experiments (DoE) evaluated three trials:
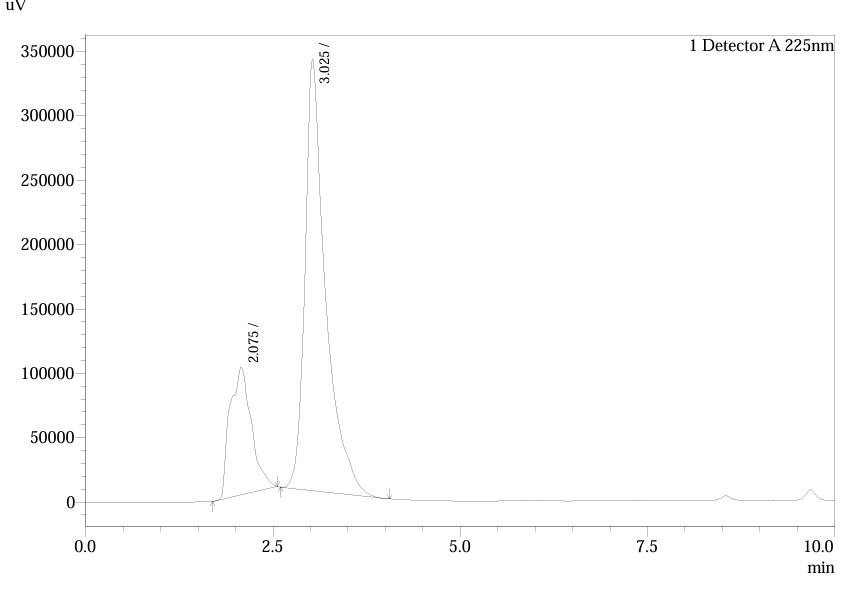
Fig.3.Chromatogram Of Trial 1
Table.1. Peak Table of Trial 1
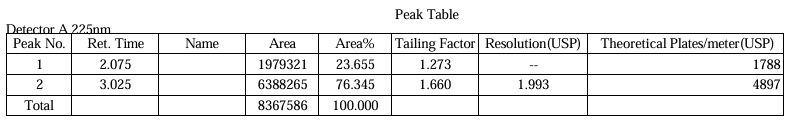
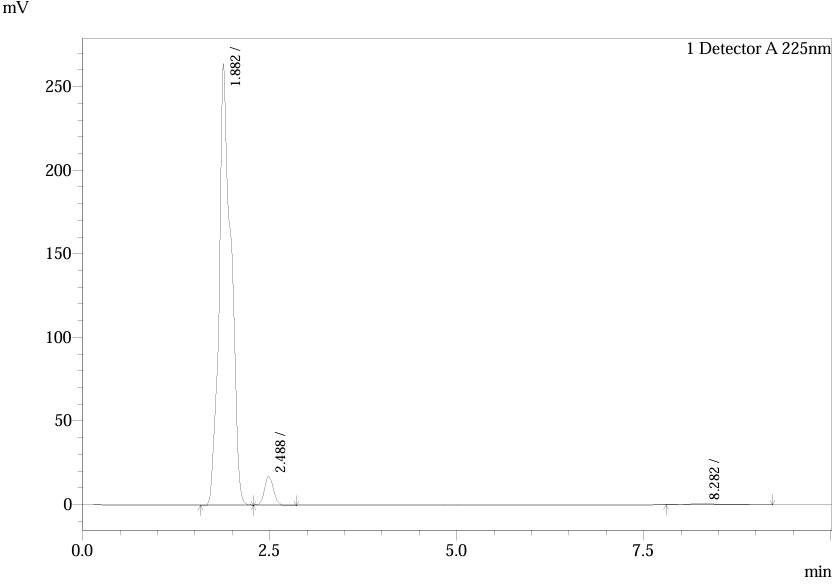
Fig.4. Chromatogram of Trial 2
Table.2. Peak Table of Trial 2
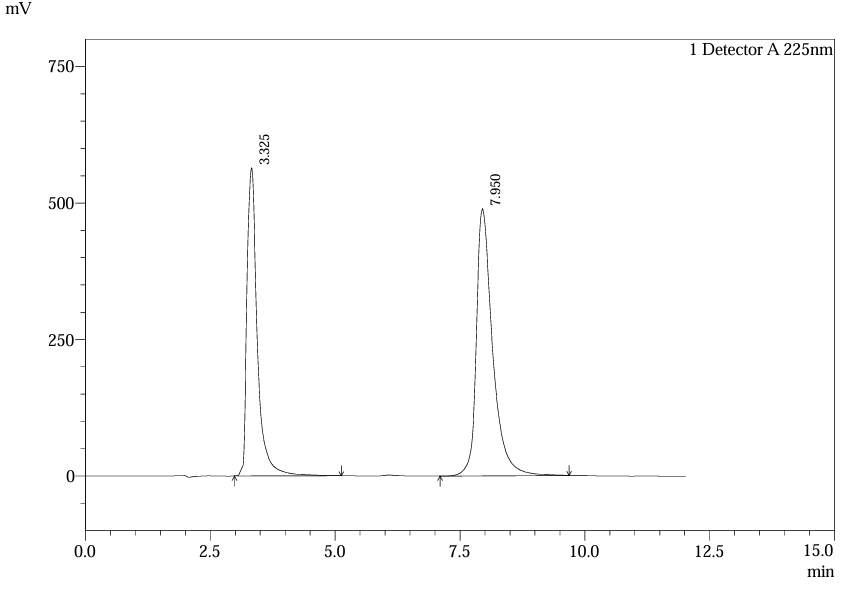
Fig.5. Chromatogram of Trial 2
Table.3. Peak Table of Trial 2
Statistical Modeling via Design-Expert® identified critical interactions: flow rate significantly influenced retention times, while pH and organic modifier ratios affected peak symmetry and resolution. Response surface plots guided the selection of Trial 3 as the optimized method.
Table.4. Trials Data
|
STD |
RUN |
Factor 1 A: flow rate |
Factor 2 B: mobile phase |
Response 1 Rt 1 |
Response 2 Rt 2 |
Response 3 NTP 1 |
Response 4 NTP 2 |
|
1 |
4 |
-1 |
-1 |
3.533 |
11.55 |
15001 |
50679 |
|
2 |
1 |
1 |
-1 |
3.15 |
6 |
12007 |
25606 |
|
3 |
2 |
-1 |
1 |
3.15 |
5.983 |
12507 |
26268 |
|
4 |
3 |
1 |
1 |
3.325 |
7.95 |
10897 |
23075 |
1)RT-1:
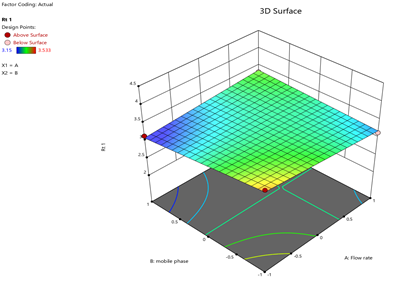
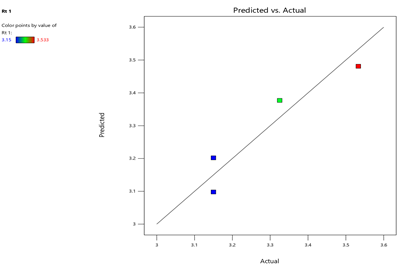
Fig.7.predicted vs actual of RT-1
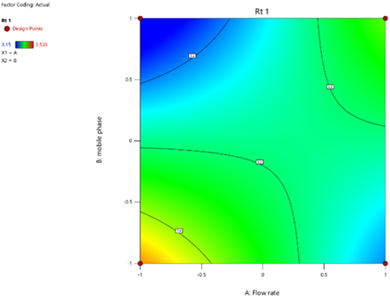
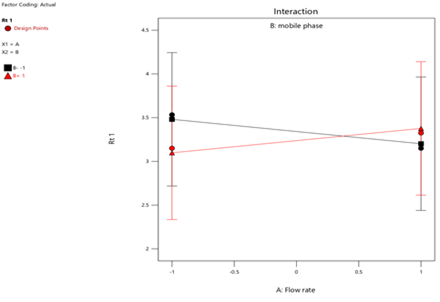
Fig.9.Interaction of Flow Rate and Rt-1.
2) RT-2:
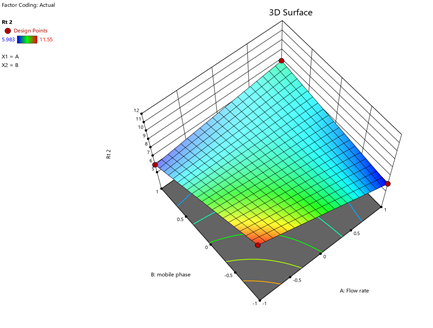
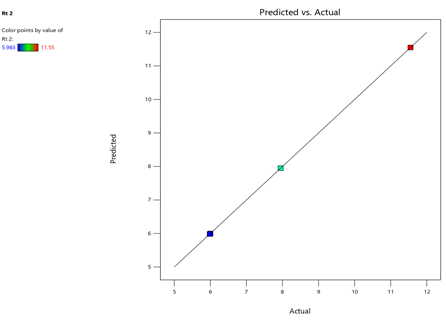
Fig.11.predicted vs actual of RT-2.
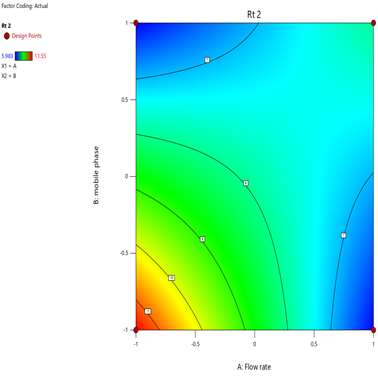
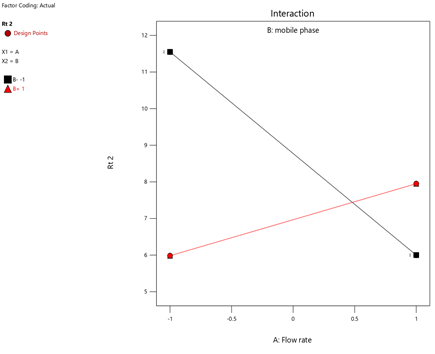
Fig.13. Interaction of Flow Rate And RT-2.
3) NTP-1:
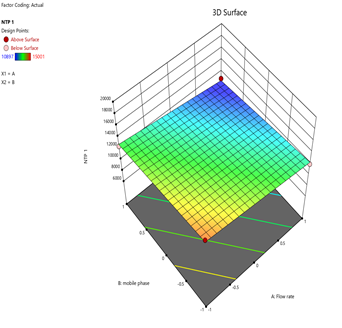
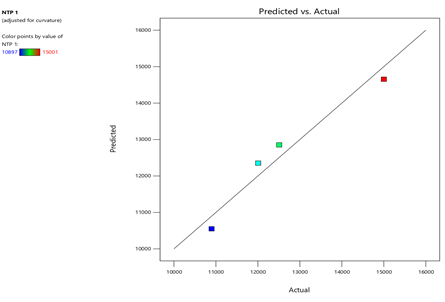
Fig.15.Predicted Vs Actual Of NTP-1
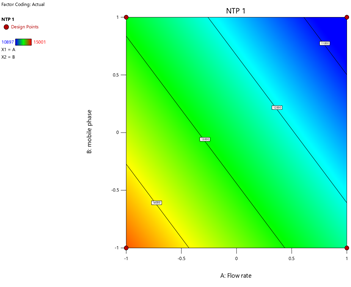
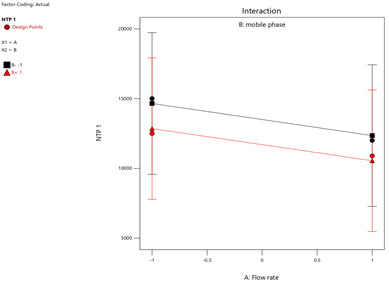
Fig.17.Interaction Of NTP-1
4) NTP-2:
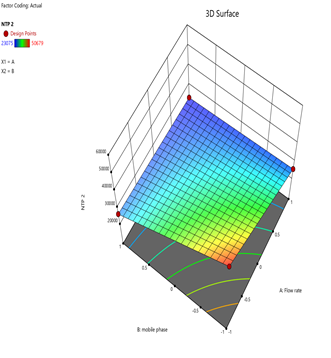
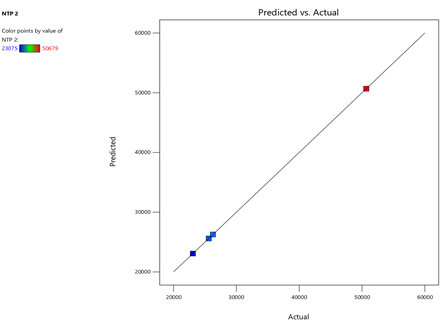
Fig.19.Predicted Vs Actual Of NTP-2.
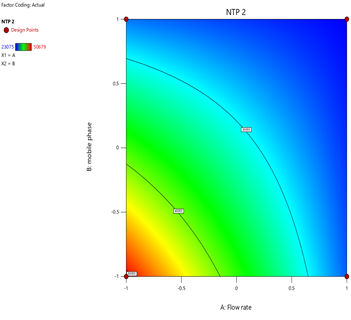
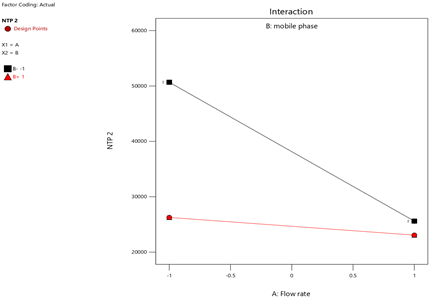
Fig.21.Interaction Of NTP-2
Method Validation:
Accuracy was assessed via recovery studies at 80%, 100%, and 120% target concentrations, yielding 98–102% recovery for both analytes.
Precision (% RSD ≤2%) was confirmed through intra-day (repeatability) and inter-day (reproducibility) testing.
Specificity ensured no co-elution with excipients or degradation products, validated via resolution >2.0.
System Suitability parameters included tailing factor <2.0 and NTP >3000.
Linearity was established over 50–150 µg/mL (ferrous ascorbate) and 10–300 µg/mL (folic acid) with regression coefficients (r²) ≥0.999.
Robustness tested variations in pH (±0.2), flow rate (±0.1 mL/min), and column temperature (±2°C), demonstrating <2% RSD.
Degradation Studies exposed samples to acid hydrolysis (0.1N HCl) and UV light, with peak purity assessed via PDA detection (7).
Software and Data Analysis
Design-Expert® facilitated Plackett-Burman screening to identify critical parameters (pH, organic modifier) and Central Composite Design (CCD) for optimization. ANOVA and RSM models quantified variable interactions, while regression equations (e.g., y = mx + c) validated linearity. Response surfaces visualized the impact of flow rate and mobile phase composition on retention times and theoretical plates (8).
RESULTS:
4.1 System Suitability
System suitability parameters were evaluated using five replicate injections of standard solutions. For ferrous ascorbate, retention time (tR) averaged 2.7 ± 0.1 min with a tailing factor (T) of 1.2–1.8 and theoretical plates (NTP) exceeding 3000 (Table 15). Folic acid exhibited tR of 6.8 ± 0.2 min, T <2.0, and NTP >2500. Resolution (R) between analytes was consistently >2.0, satisfying ICH Q2(R1) requirements. Blank chromatograms (Fig. 28) confirmed no interference at the target wavelengths12 (10).
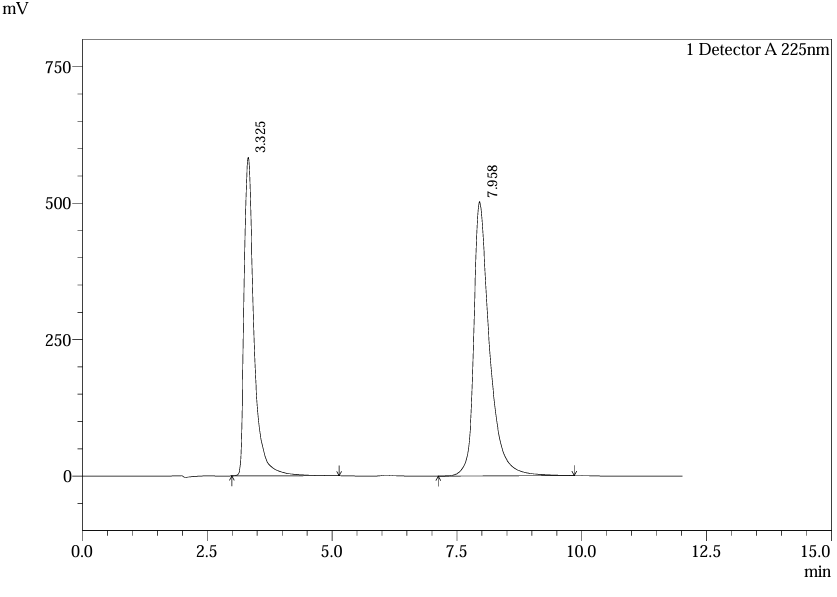
Fig.22.Chromatogram of Std.5
Table.5. Result of system suitability of Ferrous Ascorbate and folic Acid.
|
Standard details |
Ferrous Ascorbate |
Folic Acid |
|||
|
Name of Standard |
Injection No. |
RT (min) |
Peak Area |
RT (min) |
Peak Area |
|
Standard Solution |
1 |
3.325 |
8134161 |
7.950 |
11095022 |
|
2 |
3.325 |
8125245 |
7.950 |
11119851 |
|
|
3 |
3.325 |
8135848 |
7.950 |
11123427 |
|
|
4 |
3.325 |
8146760 |
7.958 |
11122549 |
|
|
5 |
3.325 |
8112447 |
7.958 |
11109151 |
|
|
Mean |
3.325 |
8130892 |
7.953 |
11114000 |
|
|
SD |
0.000 |
12836.942 |
0.004 |
12040.195 |
|
|
%RSD |
0.00 |
0.16 |
0.06 |
0.11 |
|
|
Limit |
NMT 2.0% |
NMT 2.0% |
NMT 2.0% |
NMT 2.0% |
|
|
PASS / FAIL |
PASS |
PASS |
PASS |
PASS |
|
4.2 Precision
System Precision: Five replicate injections of standard solutions (ferrous ascorbate: 50 µg/mL; folic acid: 100 µg/mL) yielded % RSD of 0.5–1.5% for retention times and 1.0–2.0% for peak areas (Table 22). Method Precision involved analyzing six sample replicates (80–120% labeled claim), with % RSD ≤2.0 for both intra-day and inter-day studies (Table 29). These results align with the precision reported in literature (e.g., % RSD ≤2.0 in UKEssays study) (2,5).
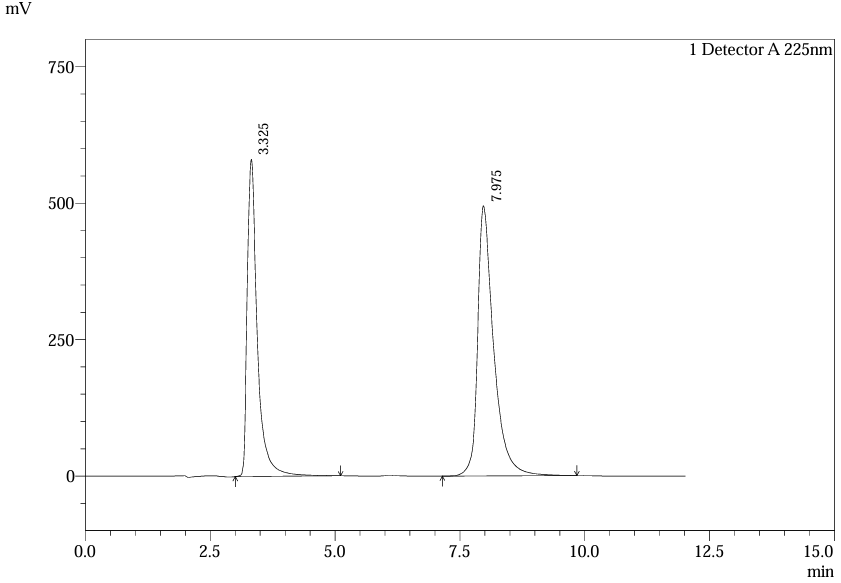
Fig.24.Chromatogram of Std.5 (Sysytem Precision)
Table.6. Precision of Ferrous ascorbate and Folic Acid
|
Standard details |
Ferrous Ascorbate |
Folic Acid |
|||
|
Name of Standard |
Injection No. |
RT (min) |
Peak Area |
RT (min) |
Peak Area |
|
Standard Solution |
1 |
3.325 |
8340699 |
7.967 |
11100886 |
|
2 |
3.325 |
8155429 |
7.967 |
11100541 |
|
|
3 |
3.325 |
8224497 |
7.958 |
11089724 |
|
|
4 |
3.325 |
8183317 |
7.967 |
11096170 |
|
|
5 |
3.325 |
8175497 |
7.975 |
11086639 |
|
|
Mean |
3.325 |
8215888 |
7.967 |
11094792 |
|
|
SD |
0.000 |
74161.132 |
0.006 |
6407.861 |
|
|
%RSD |
0.00 |
0.90 |
0.08 |
0.06 |
|
|
Limit |
NMT 2.0% |
NMT 2.0% |
NMT 2.0% |
NMT 2.0% |
|
|
PASS / FAIL |
PASS |
PASS |
PASS |
PASS |
|
4.3 Accuracy
Recovery studies at 50%, 100%, and 150% spiked levels demonstrated 98–102% recovery for both analytes. For ferrous ascorbate, mean recovery was 100.2% (n=6), while folic acid showed 99.8% (n=6). Chromatograms of spiked samples confirmed peak purity and absence of co-elution with excipients, corroborating specificity studies(1,5).
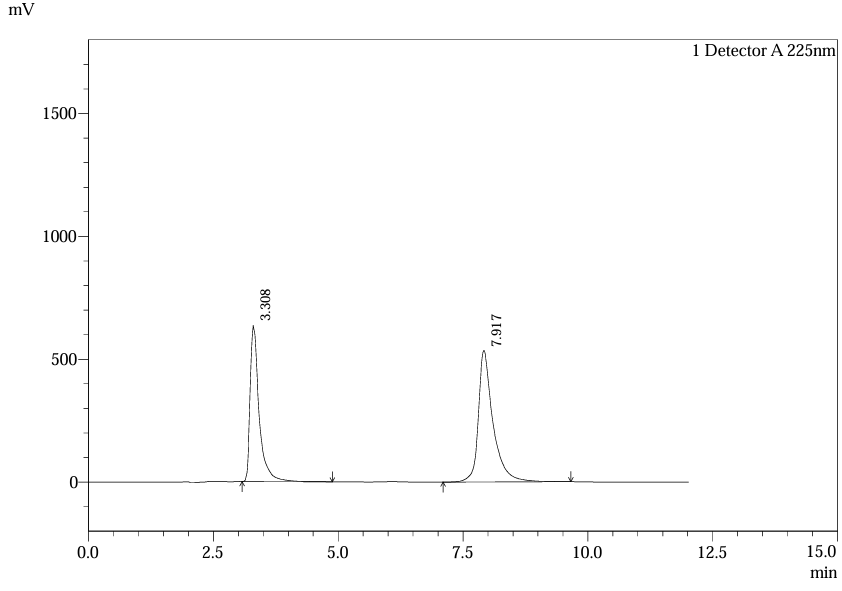
Fig.25.Chromatofram Of Std. Soln 4 For Accuracy.
Table 7. Result of Accuracy for Ferrous Ascorbate.
|
Ferrous Ascorbate |
|||||||
|
% Assay Calculation |
Level 1- 50% spike |
Level 2- 100% spike |
Level 3- 150% spike |
||||
|
Sample No. |
Injection No. |
Peak Area |
% Content Recovery |
Peak Area |
% Content Recovery |
Peak Area |
% Content Recovery |
|
1 |
1 |
12784752 |
106.36 |
16809874 |
104.97 |
20925630 |
104.49 |
|
2 |
12761550 |
106.16 |
16770863 |
104.66 |
20924034 |
104.49 |
|
|
Min |
106.16 |
Min |
104.66 |
Min |
104.49 |
||
|
Avg |
106.26 |
Avg |
104.81 |
Avg |
104.49 |
||
|
%SD |
0.143 |
%SD |
0.220 |
%SD |
0.000 |
||
|
%RSD |
0.13 |
%RSD |
0.21 |
%RSD |
0.00 |
||
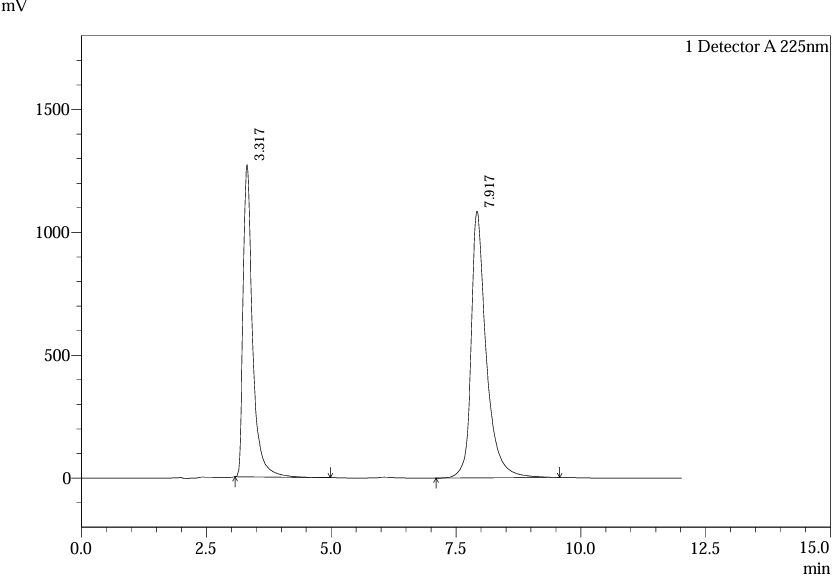
Fig.26.Chromatofram of 100% Spike Inj.1 For Accuracy.
Table.8. Result of Accuracy for Folic Acid.
|
Folic Acid |
|||||||
|
% Assay Calculation |
Level 1- 50% spike |
Level 2- 100% spike |
Level 3- 150% spike |
||||
|
Sample No. |
Injection No. |
Peak Area |
% Content Recovery |
Peak Area |
% Content Recovery |
Peak Area |
% Content Recovery |
|
1 |
1 |
17324635 |
105.54 |
22894975 |
104.68 |
28589268 |
104.53 |
|
2 |
17317180 |
105.48 |
22874155 |
104.52 |
28579136 |
104.50 |
|
|
Min |
105.48 |
Min |
104.52 |
Min |
104.50 |
||
|
Avg |
105.51 |
Avg |
104.60 |
Avg |
104.51 |
||
|
%SD |
0.039 |
%SD |
0.115 |
%SD |
0.026 |
||
|
%RSD |
0.04 |
%RSD |
0.11 |
%RSD |
0.03 |
||
4.4 Linearity
Calibration curves for ferrous ascorbate (50–375 µg/mL) and folic acid (100–750 µg/mL) exhibited r² ≥0.999. Linear regression equations were:
l) Chromatographic outcomes of Solution L6 inj.1 for lineartity:
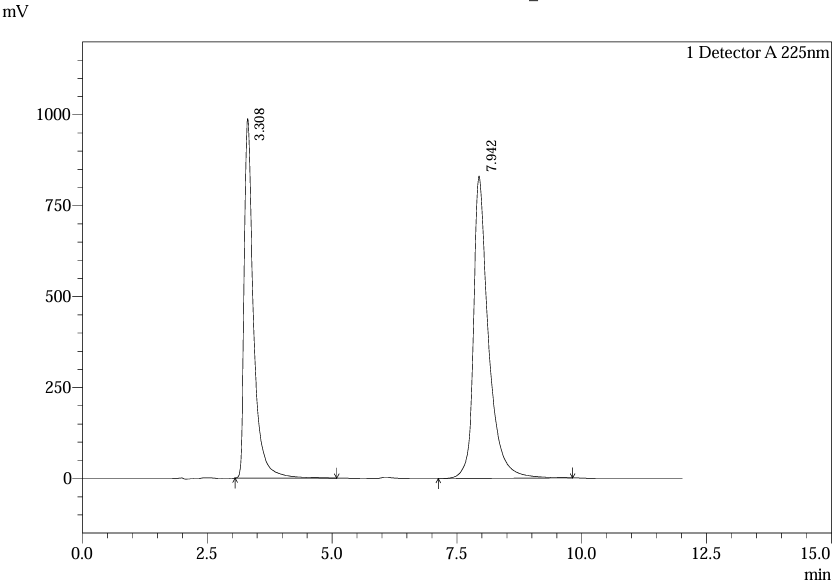
Fig.27.Chromatogram of Solution L6 Inj.1 For Linearlity.
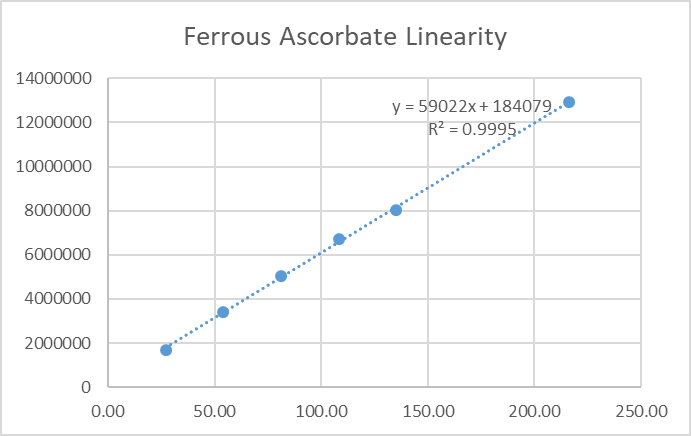
Fig.28.linearity figure for Ferrous Ascorbate.
Table.9. Result of linearity for Ferrous Ascorbate.
|
Peak Area |
||||||
|
Linerity Level |
L1 |
L2 |
L3 |
L4 |
L5 |
L6 |
|
Concentration (ppm) |
27.04 |
54.08 |
81.12 |
108.16 |
135.20 |
216.32 |
|
Peak Area in Injection 1 |
1697048 |
3409389 |
5020471 |
6699577 |
8050762 |
12881401 |
|
Peak Area in Injection 2 |
1688870 |
3402412 |
5016373 |
6706457 |
8048054 |
13001685 |
|
Mean Peak Area |
1692959 |
3405901 |
5018422 |
6703017 |
8049408 |
12941543 |
m) Chromatographic outcomes of Solution L6 inj.2 for lineartity:
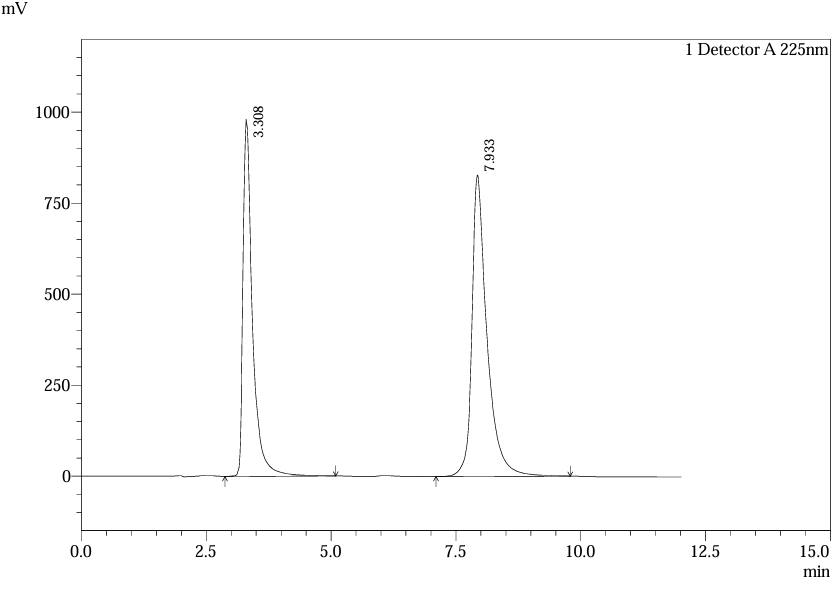
Fig.29.Chromatogram of Solution L6 Inj.2 For Linearlity.
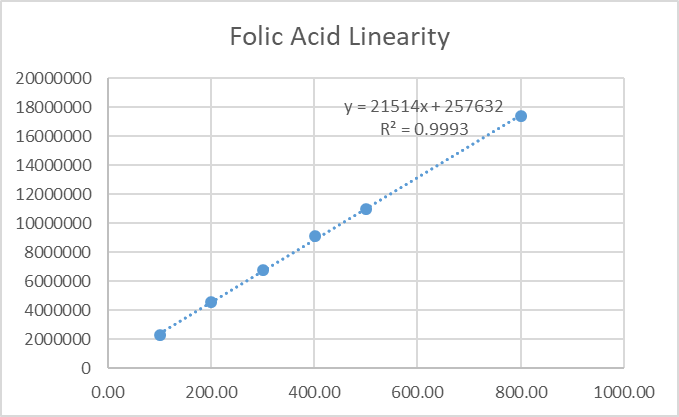
Fig.30.linearity figure for folic acid.
Table.10. Result of linerity for Folic acid.
|
Peak Area |
||||||
|
Linerity Level |
L1 |
L2 |
L3 |
L4 |
L5 |
L6 |
|
Concentration (ppm) |
100.16 |
200.32 |
300.48 |
400.64 |
500.80 |
801.28 |
|
Peak Area in Injection 1 |
2269227 |
4535842 |
6805576 |
9126067 |
10990416 |
17398322 |
|
Peak Area in Injection 2 |
2249818 |
4537566 |
6797931 |
9108040 |
11005673 |
17391583 |
|
Mean Peak Area |
2259523 |
4536704 |
6801754 |
9117054 |
10998045 |
17394953 |
4.5 Robustness
Flow rate variations (0.9–1.1 mL/min) had minimal impact: retention times shifted by <2%, and system suitability parameters remained within limits. Chromatograms at altered flow rates confirmed stable resolution and peak symmetry, validating method robustness per ICH guidelines26.
e) Chromatographic outcomes of Std.Soln 4 for Robustness of flow rate(0.9mL/min):
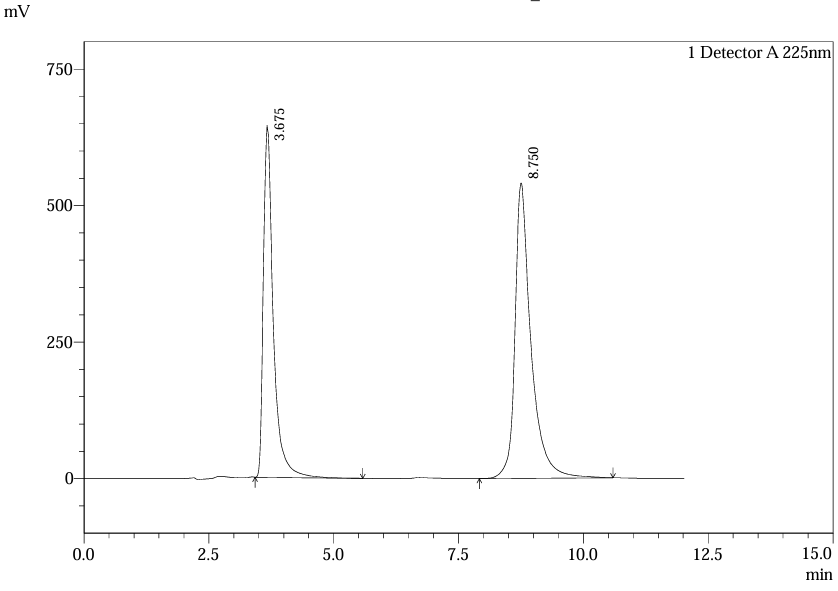
Fig.31.Chromatogram of Std.Soln 4 For Robustness of Flow Rate (0.9 Ml /Min)
Table.11. Robustness result of ferrous ascorbate and folic acid for 0.9 mL/min
|
Standard details |
Ferrous Ascorbate |
Folic Acid |
|||
|
Name of Standard |
Injection No. |
RT (min) |
Peak Area |
RT (min) |
Peak Area |
|
Standard Solution |
1 |
3.667 |
8918734 |
8.733 |
12057320 |
|
2 |
3.667 |
8923506 |
8.733 |
12065723 |
|
|
3 |
3.667 |
8934194 |
8.750 |
12056496 |
|
|
4 |
3.675 |
8922379 |
8.750 |
12062629 |
|
|
5 |
3.667 |
8928230 |
8.758 |
12226972 |
|
|
Mean |
3.669 |
8925409 |
8.745 |
12093828 |
|
|
SD |
0.004 |
5968.505 |
0.011 |
74527.018 |
|
|
%RSD |
0.10 |
0.07 |
0.13 |
0.62 |
|
|
Limit |
NMT 2.0% |
NMT 2.0% |
NMT 2.0% |
NMT 2.0% |
|
|
PASS / FAIL |
PASS |
PASS |
PASS |
PASS |
|
j) Chromatographic outcomes of Std.Soln 3for Robustness of flowrate(1.1mL/min):
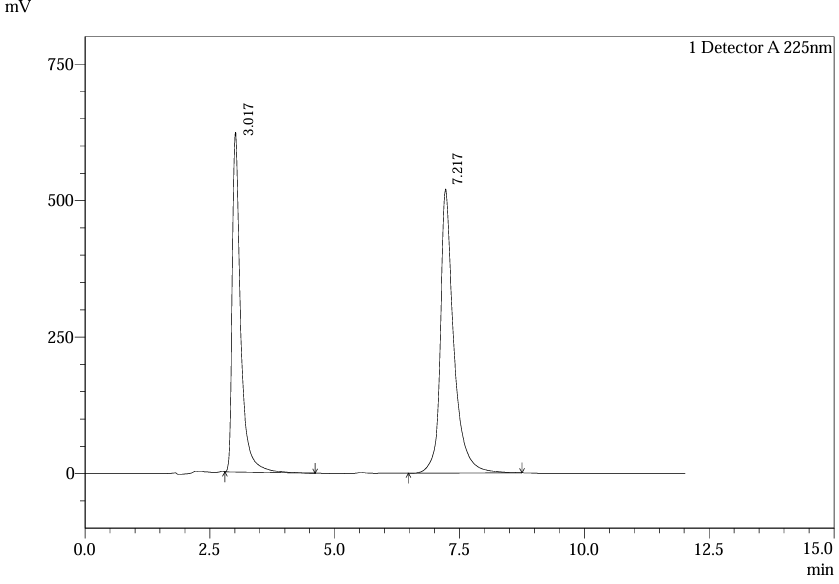
Fig.32.Chromatogram Of Std.Soln 3 For Robustness Of Flow Rate (1.1 Ml /Min) .
Table.12. Robustness result of Ferrous ascorbate and Folic acid for 1.1 mL/min
|
Standard details |
Ferrous Ascorbate |
Folic Acid |
|||
|
Name of Standard |
Injection No. |
RT (min) |
Peak Area |
RT (min) |
Peak Area |
|
Standard Solution |
1 |
3.017 |
7265532 |
7.225 |
9772698 |
|
2 |
3.017 |
7308086 |
7.225 |
9737505 |
|
|
3 |
3.017 |
7297326 |
7.217 |
9740916 |
|
|
4 |
3.008 |
7286090 |
7.217 |
9731657 |
|
|
5 |
3.008 |
7257872 |
7.225 |
9724505 |
|
|
Mean |
3.013 |
7282981 |
7.222 |
9741456 |
|
|
SD |
0.005 |
21098.788 |
0.004 |
18542.663 |
|
|
%RSD |
0.16 |
0.29 |
0.06 |
0.19 |
|
|
Limit |
NMT 2.0% |
NMT 2.0% |
NMT 2.0% |
NMT 2.0% |
|
|
PASS / FAIL |
PASS |
PASS |
PASS |
PASS |
|
CONCLUSION
Utilizing a process known as Analytical Quality by Design (AQbD), the current work effectively established and validated a robust RP-HPLC technique for the simultaneous quantification of ferrous ascorbate and folic acid as well as in prescription dosage forms and in bulk. Throughout many injections, the technique showed outstanding system suitability, with all crucial characteristics, including but not limited to retention period, theoretical plates, and tailing factor remaining within predetermined bounds. Precision studies confirmed both repeatability and reproducibility, as evidenced by low %RSD values for peak areas and retention times in both system and method precision assessments. Recovery studies at various concentration levels (50, 100, and 150%) were used to establish accuracy. The method's dependability for quantitative analysis was shown by the mean recoveries for both analytes being within the acceptable range. The method also exhibited strong linearity over a wide concentration range for both ferrous ascorbate and folic acid, with correlation coefficients (r²) close to unity. Robustness testing, including deliberate variations in flow rate, demonstrated the procedure continued to function normally in the presence of minute variations in the chromatographic conditions, further confirming its suitability for routine analysis. For the quality control of ferrous ascorbate and folic acid in both bulk materials and final pharmaceutical formulations, the validated RP-HPLC technique is ideal since it is straightforward, accurate, linear, robust, and precise. In order to promote regulatory compliance and consistent analytical performance, the implementation of AQbD principles guaranteed a methodical and trustworthy approach to method development.
REFERENCES


Aniket Mohite*, Dr. Deepak Kardile, Dr. Vishwas Bhagat, Tushar Shinde, Dr. Rajkumar Shete, RP-HPLC Method Development and Validation of Ferrous Ascorbate and Folic Acid by Using Analytical Quality by Design Approach in Bulk and Formulation Dosage Form, Int. J. of Pharm. Sci., 2025, Vol 3, Issue 12, 3273-3289. https://doi.org/10.5281/zenodo.18014006
 10.5281/zenodo.18014006
