
We use cookies to ensure our website works properly and to personalise your experience. Cookies policy
Kishori College Of Pharmacy Beed 431122.
Thin layer chromatography (TLC) was employed to study the properties and behavior of tofacitinib citrate. The aim was to develop a reliable method for the identification, separation, and analysis of this compound. The TLC technique involved using silica gel as the stationary phase and various solvent systems as the mobile phase. The results demonstrated that TLC is an effective analytical tool for monitoring the purity, identifying impurities, and assessing the stability of tofacitinib citrate. This study highlights the utility of TLC in the quality control and research of pharmaceutical compounds
Chromatography is a technique used to separate mixtures, discovered by M. Tswett in 1906. Thin layer chromatography (TLC) is performed on a sheet of glass, plastic, or aluminum foil coated with a thin layer of adsorbent material, usually silica gel, aluminum oxide, or cellulose. This adsorbent layer is known as the stationary phase. After applying the sample, a solvent or solvent mixture, referred to as the mobile phase, moves up the plate by capillary action. Different analytes ascend the TLC plate at varying rates, achieving separation. TLC can monitor the progress of a reaction, identify compounds in a substance, and determine the purity of a substance. The separation of compounds relies on the competition between the solute and the mobile phase for binding sites on the stationary phase. When using polar silica gel as the stationary phase, a more polar compound interacts more strongly with the silica, displacing the mobile phase from the binding sites, resulting in a lower Rf value. Conversely, the less polar compound moves higher up the plate, resulting in a higher Rf value.If a more polar solvent is used as the mobile phase, it can displace solutes from the silica binding sites more effectively, causing all compounds on the TLC plate to move higher. Adding more ethyl acetate to a mixture of ethyl acetate and heptane as the mobile phase increases the Rf values for all compounds. Changing the polarity of the mobile phase typically does not reverse the order of the compounds on the TLC plate. This paper does not aim to provide an exhaustive review of TLC applications in botanical screening but rather to offer a comprehensive blueprint with experimental examples showcasing the capabilities of this analytical technique. The paper aims to inspire those interested in plant analysis with simple, reliable, and cost-effective approaches. It also reflects on the distinction between standard TLC and high-performance TLC (HPTLC). While there is no official distinction between TLC and HPTLC, manufacturers denote analytical TLC plates as either TLC or HPTLC types. Some practitioners believe that using advanced auxiliary
instrumentation can enhance the separation result to justify calling it the HPTLC method. However, we believe that the stationary phase type alone should define the technique.
Principal Of TLC
Thin layer chromatography (TLC) involves using a thin plate, usually made of glass, plastic, or aluminum, coated with an adsorbent material such as silica gel or aluminum oxide as the stationary phase. The mobile phase is a solvent chosen based on the properties of the mixture’s components. TLC operates on the principle of differential adsorption, where compounds are distributed between the stationary phase and the mobile phase.
A small amount of the compound or mixture is applied near the bottom of the TLC plate. The plate is then placed in a developing chamber with a shallow pool of solvent below the applied sample. The solvent moves up the plate through capillary action, carrying different compounds at different rates based on their solubility and interaction with the stationary phase. Compounds that are more soluble in the solvent will move further up the plate, while those with a higher affinity for the stationary phase will remain closer to the starting point. The behavior of each compound in TLC is characterized by its Rf value, which is calculated by dividing the distance the compound travels by the distance the solvent front travels. The Rf value helps in identifying compounds based on their movement on the TLC plate. The principle of “like dissolves like” applies, meaning that compounds with similar physical properties to the mobile phase will stay in the mobile phase longer, moving further up the plate.
Steps in TLC
1.Preparation: A small amount of the mixture is dissolved in a suitable solvent. A spot of this solution is applied near one end of the TLC plate, known as the baseline, using a capillary tube or micropipette.
2.Development: The TLC plate is placed in a developing chamber containing a shallow layer of the mobile phase solvent. The solvent level must be below the baseline to avoid dissolving the sample spots. The chamber is usually covered to maintain a saturated atmosphere, reducing solvent evap vocation and improving reproducibility.
3.Separation: The solvent travels up the plate by capillary action, carrying the sample components with it. Different compounds travel at different rates depending on their affinities for the stationary and mobile phases. Compounds with a higher affinity for the stationary phase move more slowly, while those with a higher affinity for the mobile phase move more quickly.
4.Visualizzation: After the solvent front has moved a certain distance, the plate is removed from the chamber, and the position of the solvent front is marked. The separated spots are visualized
using methods like UV light, as many organic compounds fluoresce under UV light, revealing their positions on the plate.
5.Analysis: The positions of the separated spots are compared to standards or reference compounds. The distance traveled by each compound relative to the solvent front is measured and expressed as the Retention Factor (Rf value).
Factors Affecting TLC Separation
1.Nature of the Stationary Phase: The polarity and surface properties of the adsorbent layer significantly impact the separation process. For example, silica gel is suitable for polar compounds.
2.Mobile Phase Composition: The solvent’s polarity determines the rate at which different compounds move up the plate. A more polar solvent will move polar compounds faster, whereas a non-polar solvent will better carry non-polar compounds.
3.Sample Size: The amount of sample applied can affect the resolution. Overloading the plate can lead to streaking and poor separation.
4.Plate Thickness: The thickness of the stationary phase layer can influence the separation. Thicker layers can hold more sample but may lead to broader spots.
5.Development Time: The time allowed for the solvent to travel up the plate can affect the separation quality. Longer development times may lead to better separation.
Applications of TLC:
1.Identification: TLC can identify compounds by comparing their Rf values with those of known standards.
2.Purity Testing: It determines the purity of a substance by revealing impurities as additional spots on the plate.
3.Monitoring Reactions: Chemists use TLC to track the progress of chemical reactions by observing the appearance and disappearance of spots
4.Preparative TLC: Although typically an analytical technique, TLC can also be used to isolate and purify small quantities of compounds.
5.Determining Purity: The purity of a sample can be assessed with TLC. If two spots travel the same distance under identical conditions, they are considered the same compound. Any impurity will show up as additional spots.
6.Identifying Unknown Compounds: TLC can be used to purify, isolate, and identify natural products such as volatile oils, waxes, alkaloids, and steroids.
7.Determining Number of Components in a Mixture: If multiple different spots appear instead of one, it indicates that the material is a mixture.
8.Sample Efficiency: TLC uses very small amounts of sample, making it useful for testing the proper solvent for other separations or the effectiveness of separations like column chromatography.
9.Reaction Monitoring: In organic labs, TLC is commonly used to monitor the progress of a reaction. The reaction mixture can be sampled several times during the experiment.
10. Analysis: TLC can analyze the dye composition of fibers in forensic studies or identify compounds present in a substance.
11.Clinical Analysis: It is used in clinical studies for qualitative and quantitative analysis of biological and metabolic samples to detect diseases.
12.Semi-Quantitative Analysis: This can be performed by extracting the spot in a suitable solvent and determining it through volumetric analysis or other instrumental techniques.
13.Natural Product Separation: TLC is used for separating all classes of natural products and is established as an analytical tool in modern pharmacopoeias, including acids, alcohols, glycols, alkaloids, amines, macromolecules like amino acids, proteins, peptides, and antibiotics.
14.Purity Check: It checks the purity of samples.
15.Purification Process: TLC is used as a purification process.
16.Reaction Examination: It is used for examining reactions.
17.Identifying Organic Compounds: TLC is used for identifying organic compounds.
Advantages of TLC
1.Speed: TLC provides rapid results. The entire process, from sample application to Visualization, can often be completed in less than an hour, making it suitable for quick Analyses.
2.Cost-Effective: TLC is relatively inexpensive compared to other chromatographic Techniques like High-Performance Liquid Chromatography (HPLC) or Gas Chromatography (GC). The plates and solvents used are affordable, and there is no need For expensive instrumentation.
3.Versatility: TLC can be used to analyze a wide range of compounds, including organic, Inorganic, and biochemical substances. It is applicable in various fields such as Pharmaceuticals, food chemistry, environmental testing, and forensics
4.Sensitivity: TLC can detect minute amounts of substances, making it useful for trace Analysis. Special detection methods, such as fluorescence or iodine staining, can enhance Its sensitivity.
5.Multi-Sample Analysis: Multiple samples can be analyzed simultaneously on a single TLC Plate, which increases throughput and efficiency. This is particularly useful for comparative Studies and quality control. Qualitative and Semi-Quantitative Analysis: While TLC is primarily used for qualitative.
6.Analysis, it can also provide semi-quantitative data by comparing the intensity of spots with Standard references.
7.Visual Observation: The results are easily visualized by eye, often with the aid of UV light Or chemical staining. This direct observation helps in the quick identification of Compounds.
8.No Requirement for Sample Preparation: Many samples can be applied directly to the TLC Plate without extensive preparation, simplifying the workflow.
9.Documentation and Record Keeping: TLC plates can be stored and documented easily, Providing a permanent record of the analysis. This is beneficial for reference, Reproducibility, and validation purposes.
Disadvantage Of TLC:
1.Limited Resolution: TLC typically has lower resolution compared to other Chromatographic techniques like HPLC or GC. This means it may not effectively separate Closely related compounds or complex mixtures.
2.Semi-Quantitative Analysis: TLC is primarily qualitative, and while semi-quantitative Analysis is possible, it is less precise and accurate compared to techniques like HPLC, where Quantification is more straightforward and reliable.
3.Manual Operation: TLC requires manual application of samples and solvents, which can Introduce variability and human error. The process is less automated, making it labor-Intensive and potentially inconsistent.
4.Limited Detection Methods: The detection methods for TLC are more limited compared to other techniques. Visualization often relies on UV light or chemical stains, which may not Be as sensitive or specific as detectors used in HPLC or GC.
5.Plate Variability: The quality and uniformity of the TLC plates can vary, which affects Reproducibility and reliability of results. Variations in the thickness of the adsorbent layer Or the quality of the coating can impact the separation efficiency.
6.Solvent Consumption and Waste: Although TLC uses smaller amounts of solvents Compared to column chromatography, it still generates solvent waste. Disposal of organic Solvents must be managed properly to avoid environmental impact.
7.Limited Sample Capacity: TLC is suitable for small sample sizes, typically in the Microgram to milligram range. It is not suitable for preparative purposes or for analyzing Larger quantities of sample.
8.Limited by the Choice of Stationary and Mobile Phases: The range of stationary phases (adsorbents) and mobile phases (solvents) that can be used in TLC is limited compared to Other chromatographic techniques. This can restrict its applicability for certain types of Samples.
9.Non-Automated Process: While there are some semi-automated systems available, most TLC processes are manual, requiring careful attention and expertise from the operator. This Lack of automation can be a drawback in high-throughput environments.
10.Reproducibility Issues: Due to manual sample application, solvent development, and Environmental factors (e.g., humidity, temperature), achieving consistent and reproducible Results can be challenging in TLC.
11.Difficulty in Method Development: Developing an optimal method for separating complex Mixtures can be time-consuming and may require trial and error. This is particularly Challenging when dealing with new or unknown samples.
12.Not Ideal for Volatile Compounds: TLC is not suitable for very volatile compounds, as they May evaporate before or during the development process, leading to poor or no separation.
Limitations of TLC:
1Resolution: TLC may have lower resolution compared to high-performance liquid Chromatography (HPLC).
2.Quantitative Analysis: It is primarily qualitative; quantitative analysis requires additional Equipment and techniques.
3.Separation Efficiency: TLC generally provides lower resolution compared to other Chromatographic techniques like HPLC or GC. It may not effectively separate closely Related compounds or complex mixtures, making it less suitable for detailed analyses where High resolution is required.
4.Precision and Accuracy: While TLC can be used for semi-quantitative analysis, it is less Precise and accurate than techniques like HPLC. Variability in spot size and intensity can Make it difficult to achieve reliable quantitative results.
5.Operator Variability: The manual nature of TLC, including sample application, solvent Development, and spot visualization, introduces variability. Operator skill and experience Play a significant role in the consistency and reliability of the results.
6.Limited Detection Methods: TLC relies on visual detection methods such as UV light or Chemical stains, which may not be as sensitive or specific as the detectors used in HPLC or GC. This limits its ability to detect low concentrations of analytes.
7.Plate Variability: Differences in the quality and uniformity of TLC plates can affect Reproducibility. Variations in the thickness of the adsorbent layer or the quality of the Coating can impact separation efficiency and consistency.
8.Environmental Factors: Conditions such as humidity, temperature, and solvent saturation Can affect the development process, leading to inconsistent results.
9.Volatility of Compounds: TLC is not suitable for very volatile compounds, which may Evaporate before or during the development process, leading to poor or no separation.
10.Solvent Compatibility: The range of solvents and stationary phases available for TLC is More limited compared to HPLC or GC, which can restrict its applicability for certain types Of samples.
11.Small Sample Sizes: TLC is typically suitable for analyzing small sample sizes, in the Microgram to milligram range. It is not ideal for preparative purposes or for analyzing larger quantities of sample, which are better handled by other chromatographic techniques.
12.Labor-Intensive: Most TLC processes are manual, making them labor-intensive and time-Consuming, especially for high-throughput analyses. While some semi-automated systems Exist, they are not as widely used as automated systems in HPLC or GC.
13.Documentation and Record Keeping: Permanent Records*: While TLC plates can be stored And documented, the visual nature of the results can make detailed record-keeping more Challenging compared to digital data generated by automated chromatographic systems.
14.Trial and Error: Developing an optimal TLC method for separating complex mixtures can Be time-consuming and may require significant trial and error. This can be particularly Challenging when dealing with new or unknown samples.
15.High-Throughput Environments: In industrial settings where high-throughput analysis is Required, TLC may not be suitable due to its manual and less automated nature.
16.Regulatory Compliance: In some regulated industries, more precise and reliable Quantitative data are required, which may not be achievable with TLC.
TLC Procedure:
Thin Layer Chromatography (TLC) is a method used for the separation and identification of Compounds in a mixture. Here is a step-by-step procedure for performing TLC for tofacitinib Citrate:
Materials:
Procedure:
1.Preparation of the TLC Plate: Using a pencil and a ruler, draw a thin line (baseline) about 1-2 cm from the bottom edge of The TLC plate. This is where the sample will be spotted.Draw a light, straight line parallel to The baseline near the top of the plate, which will serve as the solvent front line.
2.Preparation of the Mobile Phase: Prepare the solvent system (mobile phase) for tofacitinib citrate. A common mobile phase Could be a mixture of ethyl acetate, methanol, and water in a specific ratio. The exact ratio May need optimization based on trial and error.
3.Sample Preparation: Dissolve a small amount of tofacitinib citrate in a suitable solvent (e.g., methanol) to make a Dilute solution. This should be done in a clean container. Use a capillary tube or micropipette to spot a small amount of the solution onto the baseline Of the TLC plate. Allow the spot to dry, and repeat if necessary to concentrate the sample.
4.Developing the Plate: Pour the mobile phase into the developing chamber to a depth of about 0.5 emplace the TLC plate in the chamber, ensuring that the baseline is above the solvent level. Cover the chamber and allow the solvent to rise up the plate by capillary action until it almost Reaches the solvent front line. This usually takes 10-20 minutes.
5.Drying the Plate: Remove the plate from the chamber and immediately mark the solvent front with a pencil. Allow the plate to dry completely.
6.Visualization: Examine the TLC plate under a UV lamp. Tofacitinib citrate may fluoresce under UV light, Making the spots visible. Alternatively, if the spots are not visible under UV light, a suitable Staining reagent can be applied to visualize the spots.
7.Analysis: Measure the distance traveled by the tofacitinib citrate spot (distance from the baseline to the
Literature Review:
1.Shashank Tiwari and Shreya Talreja Professor, Director (Academic and Research), Lucknow Model College of Pharmacy, Lucknow, India M. Pharm, Goel Institute of Pharmacy and Sciences, Lucknow, India” Corresponding Author: Shashank Tiwari, Professor, Director (Academic and Research), Lucknow Model College of Pharmacy, Lucknow, India. Abstract: In the field of analytical chemistry and various pharmaceutical fields the Separation techniques are widely used to study specific compounds from a mixture or a Complex material. One such separation technique is called Chromatography. It takes place On the basis of the relative volume of each solute present in the moving fluid stream. The Discovery of chromatography was done by Mikhail S. Tsvet. Who was a Russian botanist In the year 1901. The separation is done through stationary phase and a mobile phase. Chromatography is used for separation, analysis, and purification of various components Which can include food, pesticides, pharmaceuticals, tissue extracts etc. In this paper 2 Major types of chromatography are discussed; these include Paper Chromatography and Thin Layer Chromatography. The principles of both the types will be discussed and the Contrast will be established between the two in a tabular format.
2.Application of thin layer chromatography for qualitative analysis of gunpowder in Purpose of life prediction of ammunition. Abstract: Thin layer chromatography can be used to monitor the to monitor the progress of A reaction, identify compounds present in a given mixture, and determine the purity of a Substance. A number of enhancements can be made to the original method to automate the Differest steps, to increase the resolution achieved with TLC and to allow more accurate Quantitative analysis. This method is referred to as “high-performance TLC. Our goal is to Examine and to compare the quality of the results obtained by thin-layer chromatography, High-performance thin layer chmmatography and sacoum stability test in the analysis of Samples of gunpowders. Thin layer chromatography as a qualitative method has shown Good quality of nemalts thai preduction of the ammunition.
3.Thin-Layer Chromatography of Alkaloids on Cyanopropyl Bonded Stationary Phases. Part I. Abstract: Selected alkaloids are chromatographed on cyanopropyl-silica thin layers using Various nonaqueous and aqueous eluents. Because of the strong retention of these basic Compounds, nonaqueous eluents containing medium polar diluents, strongly polar Modifiers, and silanol blockers (ammonia or diethylamine) are required for separation. Likewise, aqueous eluents containing modifiers (acetonitrile, methanol, and Tetrahydrofuran), buffered aqueous solutions at pH 2-8, ion-pair reagents [octane sulfonic Acid sodium salt, sodium dodecyl sulphate, and bis-(2-ethylhexyl) phosphoric acid), or Silanol blockers (ammonia, tetrabutyl ammonium chloride, and diethyl amine) are Investigated. The separation selectivity as well as spot symmetry and efficiency system in The applied eluent systems are analyzed. The most selective and efficient systems are used In two-dimensional separations of isoquinoline alkaloids’ mixture and the plant extracts Chelidonium majus, Fumaria officinalis, and Glaucium flavum. Two-dimensional thin-Layer chromatography on cyanopropyl layer with diode array detection densitometry Enables the separation and identification of some alkaloids in plant extracts.
Aim And Objectives:
Plan Of Work
1.Literature Survey
2.Selection of Tufacitinis curate API Compatibility study of Tufacitinib citrate
• TLC (Thin-Layer Chromatography)
3.Identification of Tofacitinib citrine API-XRI
4.Evaluation Of Tofacitinib citrate

Drugs
Background:
Tofacitinib, marketed under the brand name Xeljanz by Pfizer, is a Janus kinase inhibitor, which is a type of intracellular enzyme involved in signaling pathways affecting hematopoiesis and immune cell function. It is approved by the FDA for treating moderate to severe rheumatoid arthritis in patients who do not respond adequately to methotrexate or cannot tolerate it. Additionally, tofacitinib has been studied in clinical trials for preventing organ transplant rejection and is being investigated for treating psoriasis. Common adverse effects include nausea, headache, and more severe immunologic and hematological issues.
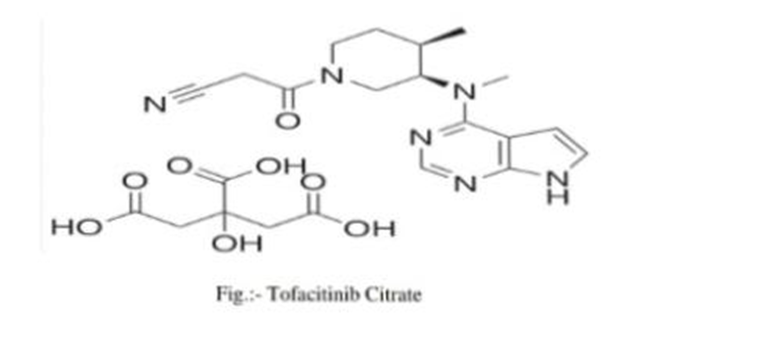
Tofacitinib Citrate:
Tofacitinib is prescribed for adults with moderately to severely active rheumatoid arthritis (RA) and active psoriatic arthritis. Patients typically receive 5 mg or 10 mg of tofacitinib twice daily. Common side effects include headaches, diarrhea, nausea, and upper respiratory tract infections. Before starting tofacitinib, patients should be tested for latent tuberculosis infections and monitored closely for signs of infection (fungal, viral, bacterial, or mycobacterial) during therapy. Treatment should not begin in the presence of active infections and should be paused if a serious infection occurs
Mechanism of action
heumatoid arthritis occurs when the immune system mistakenly attacks the body’s tissues, leading to inflammation and joint damage. This is caused by an imbalance of pro-inflammatory cytokines, which signal immune cells to cause tissue inflammation and joint damage through the JAK/STAT signaling pathway. Tofacitinib, a medication that targets JAKs, inhibits the phosphorylation and activation of STATs, reducing the inflammatory response in rheumatoid arthritis. The drug has an oral absorption rate of 74%, reaching peak plasma concentrations within 0.5-1 hour, and its absorption is not affected by fatty meals, although the maximum concentration is reduced by 32%.
Absorption: 74% oral absorption (absolute bioavailability), with peak plasma concentrations (T max) achieved in 0.5-1 hour. Administration with fatty meals does not alter AUC but Reduces Cmax by 32%.
Toxicity:
The minimum lethal dose in rats is 500 mg/kg, while the maximum asymptomatic dose in non-human primates is 40 mg/kg. In animal studies involving rats and monkeys, toxicity to the lymphatic system, immune system, bone marrow, and erythroid cells was observed. These studies used doses ranging from 1 mg/kg/day to 10 mg/kg/day over periods from 6 weeks to 6 months. In humans, lymphopenia, neutropenia, and anemia may occur, potentially necessitating an interruption or discontinuation of therapy if severe. Female rats showed reduced fertility at exposures 17 times the maximum recommended human dose, suggesting potential fertility impairment and harm to unborn children in humans. Carcinogenic potential has been noted, though there is no clear dose dependency. The Janus kinase (JAK) pathway’s role in red blood cell production and immune cell function means its inhibition can increase risks of anemia, neutropenia, lymphopenia, cancer, and infection. The impact of JAK inhibition on gastrointestinal perforation development remains unknown.
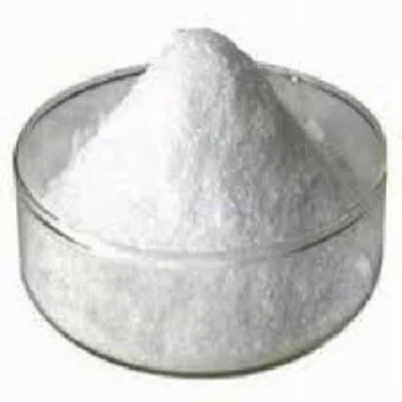
Fig1: Tofacitinib Citrate powder API
Volume of distribution
Vd= 87L after intravenous administration. Distribution is equal between red blood cells and Plasma.
Protein binding
40%, mostly bound to albumin.MetabolismMetabolized in the liver by CYP3A4 and CYP2C19. Metabolites produced are inactive.
Route of elimination
70% metabolized in the liver by CYP3A4 (major) and CYP2C19 (minor). Metabolites Produced are inactive. 30% renally eliminated as unchanged drug.
RESULT:
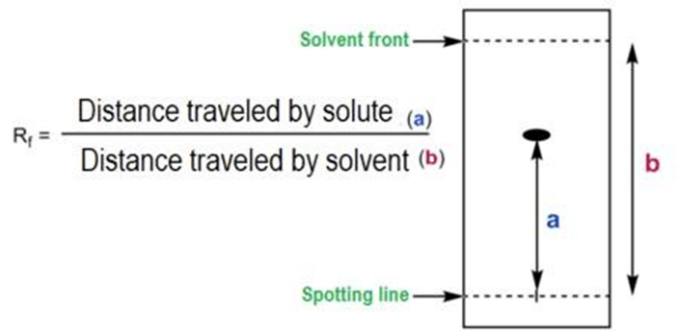
Formula:
Total solvent run= 5.2 cm
Sample run= 2.7cm
Rf=distance traveled by solute / Distance traveled by solvent
Rf= 2.7/5.2 =0.52. Rf value=0.52

Fig2: TLC PLATE
CONCLUSION:
In the thin layer chromatography (TLC) experiment, as the mobile phase ascended the TLC plate, it carried the ink from the marked dot upward. The pigment closest to the marked dot exhibited greater attraction to the stationary phase, which is the silica gel. Conversely, the pigment that traveled the farthest up the TLC plate showed a stronger attraction to the mobile phase, consisting of hexane and ethyl acetate solvent. Among the pigments, the light pink pigment, with an Rf value of 0.98, demonstrated the highest affinity for the mobile phase. The dark pink spot, with an Rf of 0.72, was nearest to the marked dot, indicating a stronger affinity for the stationary phase. In the column chromatography experiment, the royal blue dye separated first, indicating a higher attraction to the ethanol solvent and thus a faster separation. The green dye in test tube three, taking longer to separate, showed a greater affinity for the alumina powder. The first color dot on the TLC plate had the highest retention factor of 0.98, indicating that the light pink dye in the black ink mixture had the greatest affinity for the mobile phase, which was the hexane and ethyl acetate solvent.
REFERENCE


Balu Rathod*, B. S. Bhosale, Dr. Prachi Udapurkar, Jaydip Nagane, Dnyaneshwar Andhale, Review On To Study Of Thin Layer Chromatography Of Tofacitinib Citrate, Int. J. of Pharm. Sci., 2024, Vol 2, Issue 7, 662-672. https://doi.org/10.5281/zenodo.12706367
 10.5281/zenodo.12706367