1 Quality Specialist in Lupin Limited, Indore, Madhya Pradesh, India
2 Lloyd School of Pharmacy, Knowledge Park-II, Greater Noida, Uttar Pradesh, India 201306
3 Associate Professor in Pharmaceutics at L.B.S. College of Pharmacy, Jaipur
Root cause analysis (RCA) is a structured method for identifying the underlying causes of incidents, deviations, and errors. RCA helps distinguish direct causes, indirect causes, and contributing factors so that effective corrective and preventive actions (CAPA) can be implemented. Without a systematic approach or knowledge of which RCA tool to apply, issues recur because the true root causes remain unidentified. RCA is applicable to deviations, market complaints, adverse drug events, OOS/OOT/OOC investigations, laboratory Incidents, Regulatory Audits, and Self-inspections. Choice of RCA tools should match the risk level and the type of event. This paper describes the 1M to 10M framework as an expanded Ishikawa approach to support comprehensive RCA and CAPA in pharmaceutical & Biotechnology quality investigations. RCA reveals the sources of variation so that targeted improvement actions can be implemented and sustained. Actions that not address root causes may produce short-term gains but will not prevent the problem from returning. To maintain long-term improvement, deeper causes must be diagnosed and corrected. This chapter presents a consistent method for conducting RCA and standardizing its application. The focus is on identifying root causes of problems, although the same procedure applies when analyzing causes that prevent achievement of objectives. This Chapter Covers Practical RCA tools and guidance on when to use each, Case studies demonstrating RCA in real situations, Step-by-step examples showing how to identify, define, and verify specific causal factors. Each section equips the Investigators to choose appropriate tools, perform in-depth analysis, and implement corrective actions that deliver lasting results.
Root cause analysis uses multiple investigation tools to identify problems and their contributing factors. Root cause analysis Involves various Tools of Investigation Viz. Why- Why Analysis, Ishikawa Approaches (6 M Analysis), Pareto Analysis, Failure Mode and Effect Analysis (FMEA), Fault Tree Analysis etc. Root Cause Analysis (RCA) is a structured, team-driven process designed to uncover the fundamental causes of events that lead to undesired outcomes. By systematically examining contributing factors, RCA identifies breakdowns in processes and systems—not just surface-level symptoms—and guides the development of targeted corrective actions. The ultimate goal of RCA is to prevent recurrence by addressing the true source of the problem, ensuring long-term improvement and resilience in operations. Root Cause Analysis (RCA) is a critical Methodology for ensuring quality across all organizations, including those in the pharmaceutical industry (1,2). It focuses on identifying the initial action or condition that triggers a chain of events leading to a problem. By tracing issues back to their origin, RCA enables organizations to implement effective solutions that address the true source of the problem—rather than just its symptoms—thereby improving overall quality and preventing recurrence. Auditors & Investigators play a critical role in identifying and understanding deviations (3,4). They must examine each deviation in the context of past events or interventions to determine how specific actions may have contributed to the issue. This requires a thorough analysis of cause-and-effect relationships. To support this process, Root Cause Analysis (RCA) tools are employed to uncover the underlying reasons behind deviations or poor outcomes. These tools help auditors move beyond surface-level symptoms and pinpoint the true source of the problem, enabling effective corrective and preventive actions.
Key Aspects of Root Cause Analysis (RCA) in Regulatory
Root Cause Analysis (RCA) plays a critical role in maintaining compliance and driving quality improvements across regulated industries. Its application ensures that organizations not only resolve issues but also prevent their recurrence (5). Some of Key Functions which are involved in Root cause analysis are mentioned below to understand the basic Role and Fundamentals in Pharmaceutical Industry (6).
Further to Assess the Problem and Identification of Root cause the Pharmaceutical and Biotechnological industries used many Tools which is part of Different Regulatory bodies and Guidelines. As per Current Regulations and their Strategic process 6M Analysis are commonly used to determine the causes for Implementation of Effective CAPAs. The commonly used 6M elements are explained and determined here to assess the Probability of Non-Conformance Report (7).
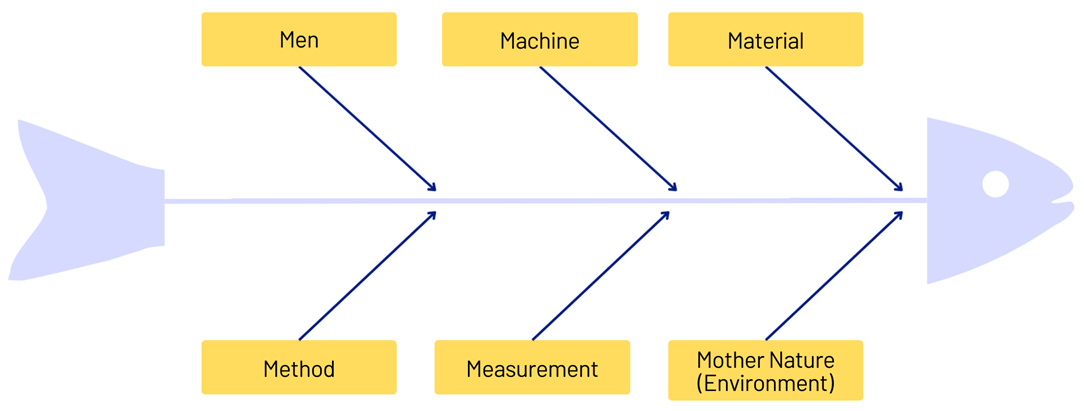
Fig 1: An Ishikawa fishbone diagram could possibly be used to discover root causes (6M Analysis for Implementation of Effective CAPAs).
As mentioned above, The Fishbone diagrams visually identify potential Problem causes by categorizing factors into six main branches. These branches represent the Men, Machine, Material, Method, Measurement, and Mother Nature as cause categories. Furthermore, these tool helps the teams in brainstorming for identification of root causes, prioritize actions, and improve quality systematically (8).
Limitations of 6M elements on Core Investigation:
The 6M Analysis, while widely used in manufacturing investigations, has notable limitations. Its scope is primarily designed for manufacturing processes, making it less relevant for service-based industries without significant adaptation. The approach often oversimplifies complex issues and may overlook systemic causes. Although the “Man” element addresses operator-related factors, it fails to capture broader human aspects such as organizational culture, leadership, and Psychological influences. Furthermore, the framework does not account for dynamic changes in processes, technology, or external factors like market conditions and regulatory requirements. In practice, the analysis can devolve into a brainstorming exercise without integrating actual process data, reducing its accuracy and effectiveness.
Expanded Factors of Root Cause Analysis:
Based upon the formal discussion with the contributing team and leaders, it is find out that 6M factors are not always impactful for assessment of problem causing and implementation of effective CAPA. Hence to address the Psychological Factors and Industrial Factors, the additional 4M Analysis expands in the traditional 6M framework specifically relevant to Pharmaceutical Investigations. This enhanced approach ensures systematic coverage of potential causes, addressing gaps in the original model. By including these factors as the framework provides a more holistic view of process variability and Risks. It supports both Proactive and Reactive Problem-Solving, enabling organizations to identify Root causes more effectively and implement robust corrective and preventive actions (CAPA).
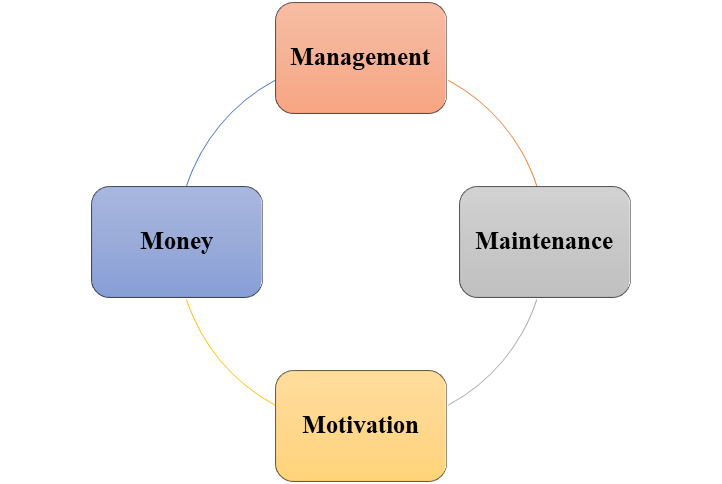
Fig 2: Proposed expansion of 4M Analysis in the traditional 6M framework to Pharmaceutical Investigations
Case Study:
On the basis of Aforesaid Factors, a formal/Predicted Investigation/Contributing factor assessment are performed to addressed the Role of Each Contributing Factor in the Investigation Outcome to Facilitates the Problem Causing Statement, which is mentioned below as: -
Problem Statement: -
On 04-April-2024,There is a failure to throughly review any unexplained discrpancy whether or not batch has been already distributed.
Specifically,
After analysis of samples of Abcd Batch (Batch No. XXXX) for the test of Assay, analyst observed that results of Content for Batch No. XXXX does not conform to Specification (Specification No.SPE-0025).
The samples of Abcd Batch were received from your other unit for analysis on 02-Apr-2025. The analysis was performed on 04-Apr-2025 using HPLC instrument No. HPLC-001 located in Laboratory of your esteemed firm. Results of the analysis are tabulated in the table No: 01 are as follows:
Scope of Investigation:
Investigation carried out by verifying Analyst Qualification Record, Raw Data, Instrument Calibration status, Instrument Malfunctioning verification, used Chemical status, Sample and Standard preparations, used Glassware (Plastic ware), Environmental condition, interaction with Analyst, verification of method validation data, verification with previously analyzed batch. Preliminary investigation was performed.
Details of Investigation:
Preliminary Investigation:
Inference from Preliminary Investigation:
Extended Investigation through 1M to 10M Technique:
Analysis of Sample ABCD Batch No. XXXX was performed by analyst Mr. Ram Kumar on HPLC instrument No. HPLC-001 by using column ID C-253 against sample set ID: ABCD_ASSAY. Analyst qualification records verified and found that analyst is trained and qualified to perform test by HPLC. Details of analyst qualification is given in table 1. During preliminary investigation check point are verified like raw data, used chemical status, SST-SOL, Standard and Sample preparations details, used plastic ware during analytical activity, followed analytical procedure by analyst with respect of STP (STP-0025). No any obvious error is identified. All the plastic ware used for sample preparation were properly cleaned and same were rinsed with diluent before taking sample for sample solution preparation. Further, Methodology used in analytical activity was verified with respect of applicable STP (STP No. STP-0025) and No discrepancy was observed. Instrument method parameters as defined in Standard test procedure are verified and No any error was observed in methodology. The weight taken for preparation of system suitability solution, Standard Solution and sample solution are verified and found in line with requirement. Further interaction has been done with Analyst and analyst followed written procedure as mentioned in STP (STP-0025) with all necessary precautions. Hence no any error was identified during interaction with analyst.
Inference:
Instrument calibration details & Preventive maintenance details were verified and found that all the respective instruments were calibrated and used within calibration validity period also the preventive maintenance of instrument was done as per schedule. Details of calibration tabulated in table 1. Results of system suitability were found satisfactory during analysis. No pressure fluctuation, instrument malfunction or any other error related to instrument performance were observed during analysis.
Inference:
Sampling of material was done at xyz unit. Samples were packed as per the recommended packaging conditions. Chemical and reagent used in analysis were verified and found within validity period & used as per STP (Table 1).
Inference:
Analytical Method was already Validated at Validation Laboratory (VR-0400). Retention time and area counts of all the analytes in SST-SOL and Standard Solution found satisfactory. System Suitability found meeting the acceptance criteria throughout the sample set. Analytical method was successfully transferred to manufacturing site. Refer analytical method transfer report No.: AMT-095. No discrepancy w.r.t. method performance was identified during Validation Method Transfer and routine analysis.
Inference:
Test Data Sheet (TDS-0118) was verified and compared with procedure defined in Standard Test Procedure (STP-0025). Found observations are following: The weights taken for analysis were as per standard test procedure. System Suitability Solution, Standard Solution and Test Sample prepared as per defined methodology. Hence weighing and dilution error can be ruled out. Area of Analyte peak in Standard Solution found satisfactory and comparable with the previous Trend data, hence the error related to standard preparation and material used for standard preparation has been ruled out. Same column (C-253) used for the analysis as mentioned in the Standard Test Procedure. Retention time and peak shape of all the analyte found satisfactory and also all the system suitability parameter found within the acceptance criteria. Hence error related to column performance has been ruled out. All the calculations and formulas used to calculate the results were verified. This calculation was performed by using validated calculator (CAL-012), Requalification date: 23-Feb-2027).
Inference:
The subjected samples of batch no. XXXX were received from XYZ Unit. Sample were kept in a box containing ice packs. After receiving the sample at Validation Laboratory, samples were kept inside the Refrigerator (REFR-005) to maintain 2-8°C temperature. Samples were kept at room temperature for about 30 minutes to attain the room temperature before weighing. While weighing the sample for analysis, utmost care was taken to minimize the exposure to the environment. After preparation, samples solution was stored inside sample compartment of instrument at controlled temperature. Analytical Laboratory functions under controlled temperature conditions and no deviation related to temperature excursion was reported from date of receipt (23-Apr-2025) to date of analysis (25-Apr-2025).
Inference:
All Financial aspects i.e. budgeting of Laboratory, Resources availability verified and there is no concern was observed. In the Last Financial Year -2024 (April-2024 to March-2025), Consumption of Chemical Inventory Record verified and found that All Chemicals related to analysis execution are available in sufficient quantity. Further, Interaction with all Laboratory Analysts/Reviewers was initiated to confirm the communication regarding cost reduction concerns and no anomaly observed. In the Financial Year -2024 (April-2024 to March-2025), Total Laboratory Budget are approved in suffice amount.
Inference:
Daily Work Allocation Log was verified and found that Group Leader Plan the activity before a day ago and analyst accept the Planning on same day. Organogram of the respective team was verified and found that Analyst report directly to the group leader regarding daily work allocation. There are No multiple channels are included for follow-ups. Further analyst interview were placed to confirm the same and analyst confirmed that he was report to group leader directly. There is no multiple channel are included for follow-ups and assigning the task. All Laboratory Polices, Standard operating procedures verified and there are no any understanding gap was observed.
Inference:
Calibration and Preventive maintenance schedulers has been verified and found that all the Calibration and Preventive maintenance activity was executed and completed within schedule date. Breakdown Checklist and Service Record of instruments/equipment’s has been verified and found that no any major repairing activity was performed in between the Calibration and Analysis time period. Record of available spare parts was verified and found that Spare part which is used during preventive maintenance activity are available in stock. Further indent record of all available part and replaced part was verified and found that all Spare parts are quality product and matches with the instrument make/model. Instrument master lists was verified to confirm the instrument age and found that all the instruments are not older than expected and working in smooth condition (Details mentioned in table no.1). Training Record on Operation, Calibration and Preventive Maintenance for Instruments/ Equipment’s verified and found that respective analyst are qualified on following SOPs. Training Record of Service Engineers verified and found that Service Engineer are trained to perform the PM activity for respective Instruments/ Equipment’s. Technical Agreements of Service Providers are verified and found that Service Provider follows all the guidelines and term/Conditions mentioned in agreement.
Inference:
Psychological Factor of the respective analyst was evaluated w.r.t following attributes Employee Portal was verified from Human Resources Department to confirm the resignation of the employee and found that Employee was not initiated any Resignation till date. Communication with near/dear colleagues of the respective analyst was initiated to verifying the “Low Motivation” i.e. reduced Attention/Delay Response with Group Leader and found that Analyst was fully motivated with the Group Leader and their sub ordinates. There are No understanding gap was observed behind them. Any momentary distraction w.r.t Hooter alarm, specific urgency of EHS, loud noise at work station was verified and No anomaly observed. Previous History of Laboratory Incidents are evaluated with the analyst and found satisfactory. Analyst was more vigilantly involved in their regular activities. Further there are No major incidence are logged due to Human error. Further, incentive programme of the respective analyst were evaluated from joining to till date. Analyst are well satisfied from their yearly incentives and promotions.
Inference:
Table 1: Analytical study details including analysis date and analyst qualification status.
|
Analysis Date (04 April, 2025) |
||||
|
Name of Analyst |
Qualification date |
Requalification due date |
||
|
Ram Kumar |
21-04-2023 |
02-01-2026 |
||
|
Instrument Name |
Instrument ID |
Calibration Due date |
||
|
HPLC |
HPLC-001 |
20/05/2025 |
||
|
Analytical Balance |
BAL-004 |
Daily |
||
|
Sonicator |
SON_002 |
22-March-2026 |
||
|
Refrigerator |
REFR-005 |
20-May-2025 |
||
|
Instrument Name |
Instrument ID |
Installation Date |
||
|
HPLC |
HPLC-001 |
18/04/2020 |
||
|
Analytical Balance |
BAL-004 |
17/01/2019 |
||
|
Sonicator |
SON_002 |
20/12/2021 |
||
|
Refrigerator |
REFR-005 |
18/05/2021 |
||
|
Parameter |
Result |
Acceptance criteria |
||
|
Theoretical plates for Analyte peak in the chromatogram obtained from SST-SOL and |
Initial |
20532 |
NLT 10000 |
|
|
BKT-1 |
21214 |
|||
|
The % Relative Standard Deviation of the Peak area of Analyte peak in the chromatograms obtained from six replicate injections of STD SOL. |
0.21 |
NMT 2.0 |
||
|
Solution Name |
Area of Analyte peak |
Area of Analyte peak |
Area of Analyte peak |
|
|
SST-SOL |
18.856 |
36.163 |
21.235 |
|
|
STD-SOL |
5951.479 |
NA |
NA |
|
|
Tests |
Specification Limit |
Batch No. (xxxx) |
||
|
Assay |
Between 24.88 to 27.5 |
24.17 |
||
|
Name of Standard |
W.S. No. |
Potency (%) |
Validity |
|
|
bbb |
123 |
99.9 |
Aug-2025 |
|
|
Chemical/ Reagents |
Batch No. |
Validity |
||
|
ccc |
456 |
29-11-2025 |
||
Benefits of Expanded RCA Framework: 6M vs 10M
The expanded 10M Root Cause Analysis (RCA) framework builds upon the traditional 6M model to better suit the complexity of modern pharmaceutical and regulated environments. While the 6M model focuses largely on technical and process-related factors, today’s quality challenges often arise from organizational decisions, financial constraints, maintenance systems, and human behavior. The 10M approach therefore provides a broader and more realistic lens for investigations, improving the depth, reliability, and preventive value of RCA.
Key Benefits of the 10M Framework:
CONCLUSION
The 1M to 10M framework provides a disciplined, multi-dimensional checklist for RCA in pharmaceutical investigations. Applying these elements ensures comprehensive coverage of Human, Technical, Material, Environmental, Financial, Managerial, Maintenance, and Motivational factors. When investigations do not immediately identify a root cause, the framework guides the collection of targeted additional evidence and supports robust CAPA planning. The extended 1M to 10M review reveal a single, clear root cause. All conventional Laboratory, Method, and Environmental factors were investigated and ruled out based on available records and trend data. Furthermore, impact of Motivation related factor viz. Understanding Gap, Attention Gap, Behaviour Gap & Skill Gap has been ruled out.
REFERENCES

Abhishek Singhal, Nishant Gaur, Dr. Garvendra Singh Rathore, Root Cause Analysis via 1m to 10M in Pharmaceutical Industry for Implementation of Effective Corrective and Preventive Action, Int. J. of Pharm. Sci., 2026, Vol 4, Issue 3, 4154-4164. https://doi.org/10.5281/zenodo.19354789
 10.5281/zenodo.19354789
