Abstract
A simple, accurate, precise, and economical Q-absorbance ratio UV-spectrophotometric method was developed and validated for simultaneous estimating Rosuvastatin Calcium and Ezetimibe in combined tablet dosage form. The solvent used was a 1:1 t mixture of Isopropyl alcohol and distilled water. Two wavelengths 244nm (?max of Rosuvastatin Calcium) and 240nm (Isoabsorptive point) were selected to estimate Rosuvastatin Calcium and Ezetimibe for the Q-Absorbance ratio method. The drug concentration was determined using the ratio of absorbance at the iso-absorptive point (?1 = 240 nm) and the ?max of Rosuvastatin Calcium (?2 = 244 nm). This method is linear for both drugs in the range of 5 to 25 ?g/ml at ?1 (R2 = 0.998) and at ?2 (R2 = 0.997) for Rosuvastatin Calcium, and Ezetimibe in the range of 5 to 25 ?g/ml for found at ?1 (R2 = 0.9992) and ?2 (R2 = 0.9993). The percentage recovery was 102.11 % of Rosuvastatin Calcium and 99.72 % of Ezetimibe by standard addition method. The LOD was found to be 1.126 ?g/ml and 1.400 ?g/ml for Rosuvastatin Calcium at ?1 and ?2 respectively. The LOD was found to be 0.713 ?g/ml and 0.396 ?g/ml for Ezetimibe at ?1 and ?2 respectively. The LOQ was found to be 3.412?g/ml and 4.240?g/ml for Rosuvastatin Calcium at ?1 and ?2 respectively. The LOQ was found to be 2.162?g/ml and 1.199?g/ml for Ezetimibe at ?1 and ?2 respectively. The method was precise as % RSD was found to be less than 2 in Repeatability and Interday for Rosuvastatin Calcium and Ezetimibe. The % assay of analyte drugs in the combined tablet dosage form was found to be 101.41% of Rosuvastatin Calcium and 99.24 % of Ezetimibe which showed good applicability of the developed method.
Keywords
Rosuvastatin Calcium, Ezetimibe, Q-absorbance ratio method, iso absorptive point.
Introduction
The absorbance ratio method allows for the simultaneous estimation of two components by utilizing the property that the ratio of absorbances at any two wavelengths remains constant regardless of the concentration or path length. This method involves measuring the absorption at two selected wavelengths, one of which is an iso-absorptive point and the other being the ?max of one of the two components.1 Hypolipidemic drugs, or lipid-lowering medications, are used to reduce high levels of lipids, such as cholesterol and triglycerides, in the blood.2,3 Rosuvastatin calcium (ROS) is a potent statin used as a hypolipidemic drug. It is Chemically known as calcium (E)-7-[4-(4-fluorophenyl)-6-isopropyl-2 [methyl(methylsulfonyl)amino]pyrimidin-5 yl](3R,5S)-3,5-dihydroxyhept-6-enoate. It is an HMG-CoA reductase inhibitor that reduces cholesterol synthesis in the liver.4 This results in lower LDL cholesterol, increased HDL cholesterol, and reduced triglycerides. With a molecular formula of C44H54CaF2N6O12S2, rosuvastatin calcium is effective in managing dyslipidaemia, although monitoring for side effects like muscle pain and liver enzyme changes is necessary.5
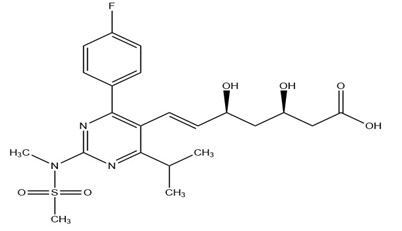
Fig 1: Structure of Rosuvastatin Calcium
Ezetimibe (EZE) is a cholesterol absorption inhibitor used to lower cholesterol levels by preventing cholesterol absorption from the small intestine. Its chemical name is (3R,4S)-1-(4-fluorophenyl)-3-[(3S)-3-(4-fluorophenyl)-3-hydroxypropyl]-4-(4-hydroxyphenyl) azetidin-2-one, with a molecular formula of C24H21F2NO3 and a molecular weight of 409.43 g/mol.6 Ezetimibe inhibits the NPC1L1 protein, reducing intestinal cholesterol delivery to the liver and lowering plasma cholesterol levels. It is used to treat primary hyperlipidaemia, homozygous familial hypercholesterolemia, and homozygous sitosterolaemia, and is often combined with statins. Common side effects include headache and diarrhoea, while serious ones include myopathy and hepatitis.7
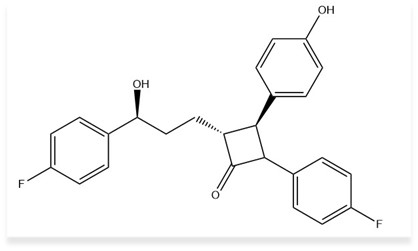
Fig 2: Structure of Ezetimibe
Ezetimibe combined with rosuvastatin considerably reduces LDL cholesterol levels by leveraging complementary mechanisms: rosuvastatin reduces cholesterol synthesis in the liver, whereas ezetimibe limits cholesterol absorption in the intestine. This synergy results in greater LDL-C lowering and better cardiovascular outcomes than monotherapy. Furthermore, the combination can reduce the requirement for higher statin doses, aiding individuals with statin intolerance, and has the potential to improve adherence through single-pill formulations.8,9 A detailed survey of analytical literature revealed that several analytical methods like High-performance Thin Layer Chromatography, High-performance Liquid Chromatography, and UV Spectrophotometric determination of Rosuvastatin calcium and ezetimibe either alone or from combined tablet dosage form are available. Still, the existing UV methods use costly solvents for the estimation. The main objective of the present work is to develop and validate a simple, sensitive, reproducible, and cost-effective UV spectrophotometric Q absorption ratio method for the simultaneous determination of Rosuvastatin Calcium and Ezetimibe in combined tablet dosage form.
MATERIALS AND METHODS
Reagents and Chemicals:

Instrumentation

Preparation of stock solutions and calibration curves
Standard solutions of calibration curves for spectrophotometric measurements were prepared by dissolving ROS and EZE in isopropyl alcohol (IPA): water mixture (50:50) to obtain the concentration of 1mg/ml for each compound. For calibration, the above solutions were prepared containing ROS and EZE OF 5 - 25 µg/ml by diluting the stock standard solution with IPA: Water in standard volumetric flasks(10ml). The solutions were scanned in the wavelength range of 200-400nm.
Selection of wavelength
After initially stabilizing the instrument for 30 minutes, the blank correction was done using an Isopropyl alcohol: water mixture (50:50 v/v). Then 10 µg/ml solution of Rosuvastatin calcium and Ezetimibe were scanned separately in UV region ranging from 200 nm to 400 nm. The absorption spectra were observed with maximum absorption at 232 nm and 244 nm for ROS and EZE respectively. From the overlay spectra, two wavelengths were selected one at 240 nm which was the iso-absorptive point and the other at 244 nm, ?max of Rosuvastatin calcium. Statistical parameters like slope, intercept, coefficient of correlation and SD were determined.
Analysis of Standard Drug Mixture
Weighed accurately 20 mg of Rosuvastatin calcium and 10 mg of Ezetimibe and transferred to a 10 ml standard flask. The drug mixture was then allowed to dissolve in a sufficient quantity of Isopropyl alcohol: water mixture (50:50 v/v) and then made up the volume to 10 ml with the same. From this a final solution was prepared have a concentration of 20 µg/ml Rosuvastatin calcium and 10 µg/ml Ezetimibe and the absorbance was measured at 240nm and 244nm.
Analysis of tablet formulation
Twenty tablets of ROZAVEL EZ 20 were weighed and powdered. A quantity of powder equivalent to 20 mg was weighed and transferred to a glass stoppered flask. The powder was extracted with a 5 ml Isopropyl alcohol: water mixture (50:50 v/v) by sonication for 10 minutes and filtered made up to 10ml in a standard flask. From the above solution, accurately pipetted out 1ml and transferred to a 100 ml standard flask. The volume was made up to the mark using the same solvent to obtain a concentration of 20 µg/ml of ROS and 10 µg/ml of EZE. Six different mixtures were prepared as above and the absorbance of final solutions was measured at 240 nm and 244 nm. The results are tabulated in Table 1.
Validation of proposed method
The developed method was validated according to ICH guidelines Q2(R2).14
Accuracy
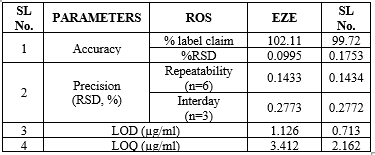
The accuracy of the developed method was determined by calculating the percentage recoveries of ROS and EZE by the standard addition method. A known amount of standards of ROS and EZE (80%, 100%, and 120%) were added to the pre-analysed sample solutions of tablet dosage forms. The amounts of ROS and EZE were estimated and the results are shown in Table 3. The values proved that the method is accurate.
Precision
Precision studies were done at two levels, Repeatability and Intermediate precision. The precision of the developed method was checked by repeatedly scanning (n = 6) standard solutions of ROS (20 ?g/ml) and EZE (10 ?g/ml). The % RSD values were found to be below 2% which indicates that the proposed methods are repeatable (Table 3). The intermediate precision for the proposed method was determined by estimating the same standard solution of ROS and EZE for three different days(interday). The results are reported in terms of % relative standard deviation (% RSD). The % RSD values were found to be below 2% which indicates that the proposed method is precise (Table 3).
Linearity
Calibration curves were constructed by plotting absorbance vs. concentrations of ROS and EZE, at their respective ?max and the regression equations were calculated. The calibration curves were plotted over the five different concentrations in the range of 5-25 ?g/ml for both ROS and EZE (Fig. 6 and Fig. 7). The optical parameters and statistical parameters are depicted in Table 2.
LOD & LOQ
The LOD and LOQ were estimated from five calibration curves drawn for each drug in their respective linearity range and calculated by the following equation.
LOD = 3.3 (?/S) LOQ= 10(?/S)
Where, ?= Standard deviation of y-intercepts of regression lines S= Slope of Calibration curves.
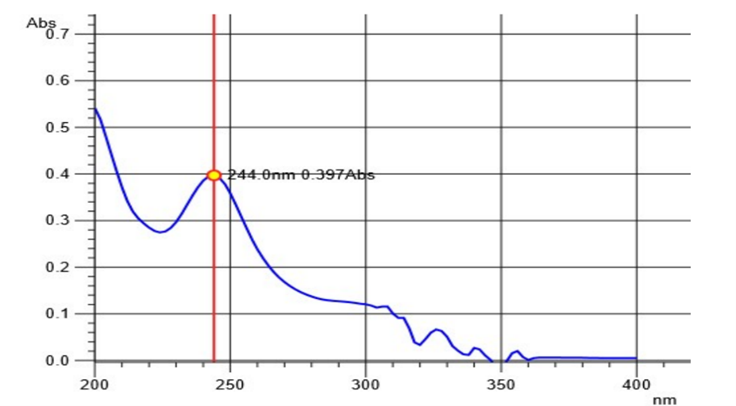
Fig 3: UV Absorption Spectrum of Rosuvastatin Ca at 244 nm
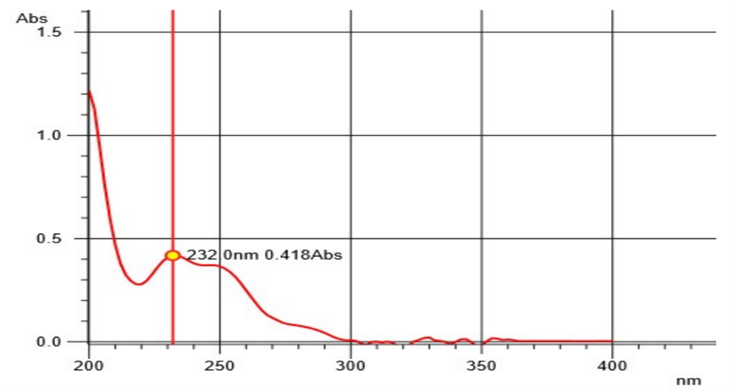
Fig 4: UV Absorption Spectrum of Ezetimibe at 232 nm
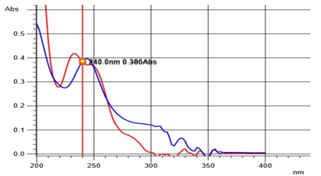
Fig 5: Overlay Spectrum of Rosuvastatin Ca RS and Ezetimibe RS
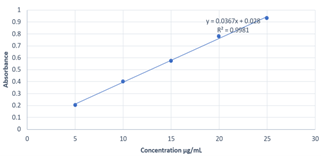
Fig 6: calibration curve of ROS at 240 nm
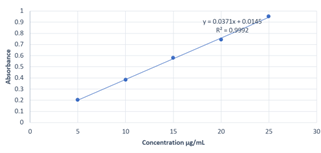
Fig 7: calibration curve of EZE at 240 nm
Table 2: Summary of the various determination parameters of the Q absorbance method.

Table 3: Overview of the validation criteria for the proposed methods.
SUMMARY AND CONCLUSION
The proposed method has the advantages of simplicity and ease for identifying and quantifying Rosuvastatin (ROS) and Ezetimibe (EZE) in combination tablet dose forms. This research work introduces a new simple and accurate method for the simultaneous estimation of ROS and EZE in tablet dosage forms. The method was effectively validated following ICH guidelines Q2(R2). The new method showed high linearity, precision, accuracy, limit of detection (LOD), and limit of quantification (LOQ). Furthermore, the method involves the use of class 3 solvents, which are less hazardous, environmentally friendly, and cost-effective. The proposed method is a dependable strategy for ensuring accurate results, and is suitable for routine analysis and quality control of pharmaceutical formulations comprising these drugs, whether individually or in combined dosage forms.
ACKNOWLEDGEMENT
The authors express their gratitude to the College of Pharmaceutical Sciences, Govt. Medical College, Thiruvananthapuram, Kerala for providing facilities to carry out the research work.
CONFLICT OF INTEREST
There is no conflict of interest
REFERENCES
- Singh G, Kumar D, Sharma D, Singh M, Kaur S. Q-Absorbance ratio spectrophotometric method for the simultaneous estimation of prednisolone and 5-Amino salicylic acid in tablet dosage form. Journal of applied pharmaceutical science. 2012 Jul 30;2(7):222-6.
- Smith RJ, Anania FA, Cziraky MJ, et al. Statins and cholesterol: current state and future directions. Am J Cardiol. 2023;184:16-26.
- Catapano AL, Pirillo A, Norata GD, et al. Fibrates in the management of dyslipidemias. Atherosclerosis. 2016;253:1-10.
- DrugBank Online. Rosuvastatin [Internet]. Available from: https://go.drugbank.com/drugs/DB01098
- PubChem. Rosuvastatin calcium [Internet]. Available from: https://pubchem.ncbi.nlm.nih.gov/compound/Rosuvastatin-calcium
- DrugBank Online. Ezetimibe [Internet]. Available from: https://go.drugbank.com/drugs/DB00973
- PubChem. Ezetimibe [Internet]. Available from: https://pubchem.ncbi.nlm.nih.gov/compound/Ezetimibe
- Aronow HD, Cannon CP. Ezetimibe and cardiovascular outcomes. N Engl J Med. 2015;372(25):2451-2458.
- Kosoglou T, et al. Pharmacodynamic interaction between ezetimibe and statins. Clin Pharmacol Ther. 2005;77(5):386-394.
- Nagvenkar P, Celina N. Simultaneous analysis of ezetimibe and rosuvastatin by Q absorption ratio method. Research Journal of Pharmacy and Technology. 2023;16(9):4276-80.
- Sireesha D, Monika ML, Bakshi V. Development and validation of UV spectrophotometric method for the simultaneous estimation of rosuvastatin and ezetimibe in pharmaceutical dosage form. Asian Journal of Pharmaceutical Analysis. 2017;7(3):135-40.
- Telrandhe R. Development and validation of UV spectrophotometry and RP-HPLC method for simultaneous determination of rosuvastin and clopidogrel in tablet dosage form. Asian Journal of Pharmaceutical Analysis. 2018;8(1):25-32.
- Indian Pharmacopoeia. Indian Pharmacopoeia Commission, Ghaziabad; 2018 vol 3. P.3141-3144
- International Conference on Harmonization, ICH Q2(R2): Validation of Analytical Procedure; March 2024.
- International Conference on Harmonization, ICH Q2(R1): Validation of Analytical Procedure: Text and methodology, ICH Secretariat, Geneva 2005
- Tripathi K. Essentials of Medical Pharmacology. 8th ed. New Delhi: Jaypee Brothers Medical Publishers (P) Ltd; 2013


 RAHUL RAJAN R S*
 Anitha Thomas


 10.5281/zenodo.13646983