Centre for Pharmaceutical Sciences, Institute of Science and Technology, Jawaharlal Nehru Technological University Hyderabad, Kukatpally, Hyderabad, 500085, Telangana, India
A new, simple, precise, rapid, selective and stability reversed-phase high performance liquid chromatographic (RP-HPLC) method has been developed and validated for the simultaneous quantification of Empagliflozin and Linagliptin in pure form and its pharmaceutical dosage form. The method is based on Phenomenex Gemini C18 (4.6×250mm) 5µ column. The column is maintained at 40°C throughout the analysis. The total run time is about 10 min. The method is validated for specificity, accuracy, precision and linearity, robustness and ruggedness, system suitability, limit of detection and limit of quantitation as per international conference of harmonization (ICH) Guidelines. inter-day precision (<2%) and robustness. The advantages of this method are good resolution with sharper peaks and sufficient precision. The results indicate that the method is suitable for the routine quality control testing of marketed tablet formulations.
Combined dosage forms are mostly preferred these days as compared to single dosage forms. Linagliptin and empagliflozin is available in combined pharmaceutical dosage form. The brand name is Glyxambi containing 25 mg of Empagliflozin and 5 mg of Linagliptin used in the treatment of diarrhea1. Literature survey reveals that various analytical methods have been reported for single dosage forms. The present paper aims to report a simple, accurate, precise, RPHPLC method for estimation of linagliptin and empagliflozin in combined dosage forms.
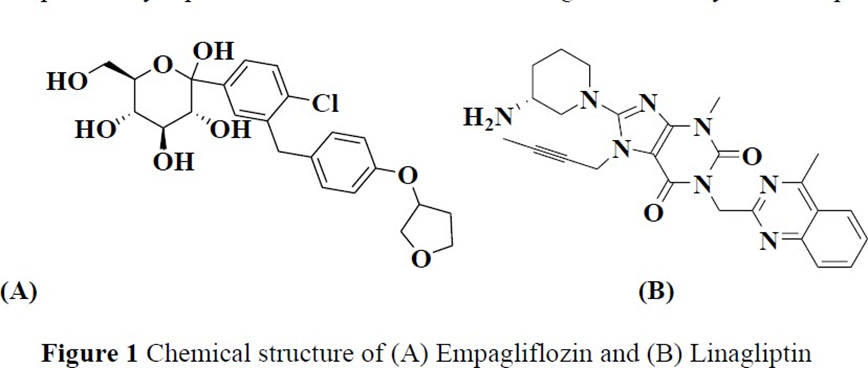
Diabetes mellitus (DM) belongs to a category of metabolic disorder, characterized by chronic hyperglycaemia occurring due to deficiency in insulin secretion or action or both. People with type 2 DM are susceptible to various short term as well as long term complications including premature deaths and coma [1]. The combination of linagliptin and empagliflozin is on the market as tablets formulation for oral use for the management of type 2diabetes and cardiovascular risk. Empagliflozin (EMPA) is used as a sodium glucose cotransporter-2 (SGLT-2) inhibitor to improve glycemic control in adult patients with type 2 diabetes. SGLT-2 co-transporters reabsorb glucose from the glomerular filtrate in kidney and the glucuretic action resulting from inhibition of SGLT-2 which reduces renal absorption and lowers down the renal threshold for glucose, therefore increases glucose excretion which reduces hyperglycaemia and also helps in blood pressure reduction[2, 3]. Chemically EMPA is 1- chloro-4-(glucopyranos-1-yl)-2-(4-(tetrahydrofuran-3-yloxy)benzyl)benzene and having empirical formula is C23H27ClO7 with molecular weight 450.91 g/mole (Fig. 1A). Linagliptin (LINA) is having competitive, reversible DPP-4 inhibitory action which is responsible for DPP-4 breakdown reduction of GLP-1 and glucose-dependant insulinotropic polypeptide (GIP). From beta cells of the pancreas, GLP-1 and GIP stimulate the release of insulin during inhibiting release of glucagon from pancreatic beta cells. These effects together reduce the breakdown of glycogen in the liver and increase insulin release in response to glucose[3-5]. Chemically LINA is (R)-8-(3-aminopiperidin-1-yl)-7-but-2-ynyl-3-methyl-1-(4- methylquinazolin-2-ylmethyl)-3,7-dihydro-purine- 2,6-dione and having empirical formula is C25H28N8O2 with molecular weight 472.5422 g/mole (Fig. 1B). Literature review revealed that few methods were described for the determination of EMPA and LINA alone or in combination with other drugs from pharmaceutical dosage forms and in human plasma including spectrophotometry[6-9], ultra-performance liquid chromatography (LC)[10], LC–mass spectroscopy[11], and high-performance LC (HPLC)[12-27] techniques. The aim of the present work is to develop and validate simple, fast and reliable reverse-phase HPLC method with ultraviolet (UV) detection for the simultaneous determination of EMPA and LINA in pure and pharmaceutical dosage forms. The proposed method can overcome the problems in all previously reported HPLC methods such as long time of analysis and expensive detectors.
2. MATERIALS AND METHODS
2.1 Optimized chromatographic conditions
Suitable high performance liquid chromatography equipped with UV-visible detector was used. HPLC (waters, 2695 separation module) SOFTWARE (Empower, version 2.0) Column: Waters C18, 50mm x 4.6 Wavelength: 210 nm Injection Volume: 10µL Column Temperature: Ambient Flow Rate: 1.0mL/min Retention time of Linagliptin and empagliflozin are 4.666 and 2.551 min respectively.
Linagliptin and empagliflozin were received as gift sample from Leeford Healthcare Pvt. Ltd. Ludhiana and Tanishka Pharmaceuticals Pvt. Ltd. Baddi. The pharmaceutical preparations of combination of linagliptin and empagliflozin that is RACIGYL-O tablets (Mankind) contains 100mg of racecadotril and 200mg of ofloxacin was procured from local market. The solvents used for method development and validation were Methanol AR Grade, HPLC grade Methanol (S.D fine chemicals ltd, Mumbai, India), HPLC grade Acetonitrile and water for HPLC (Finar Chemicals Ltd., Mumbai, India)
HPLC system of WATERS (Milford, USA) composed of 515 HPLC pump as a solvent delivery system equipped with Rheodyne injection valve with a 50 μL loop. The chromatographic separation was performed with a WATERS, 2695 separation module HPLC instrument equipped with UV-VISIBLE detector and Empower software, version 2.0. The Waters X bridge Stainless steel C18 column (250 mm ×4.6 mm, 5μm) packed with ODS chemically bounded porous silica particles were used as stationary phase for analysis. BL- 220H analytical balance (Shimadzu corporation, Japan), an ultrasonic cleaner (Frontline FS 4, Mumbai, India) and Digital pH meter (LI 612 pH analyzer, Elico Ltd., Ahmadabad), were used in the study.
The optimal composition of the mobile phase was determined to be acetonitrile, methanol and water pH 2.7 maintained by ortho-phosphoric acid in the ratio (40:40:20 v/v). The mobile phase was filtered through nylon 0.22 μm membrane filters and was degassed to remove the air before use (30 min). Stock solution was prepared by dissolving Linagliptin and empagliflozin (50 mg each) that were weighed accurately and separately transferred into 25 mL volumetric flasks. All the drugs were dissolved in 25 mL of mobile phase to prepare standard stock solutions. After the immediate dissolution, the solution was sonicated and made up the volume with mobile phase. These standard stock solutions were observed to contain 2000mcg/mL of RAC and OFL. Appropriate volume from this solution was further diluted to get appropriate concentration levels according to the requirement. From the stock solutions, dilutions were made in the concentration range of 60, 80, 100, 120, 140μg/mL for RAC and 120, 160, 200, 240, 280μg/mL for OFL.
Mobile phase was prepared by mixing acetonitrile (HPLC grade), methanol (HPLC grade) and HPLC water pH 2.7 (40:40:20 v/v). Mixture was shaken vigorously and sonicated for 30 min prior to use.
Stock solutions and sample solutions of Linagliptin and empagliflozin and its binary mixture were prepared by adding accurately weighed 50 mg of Linagliptin and empagliflozin separately in 25 mL volumetric flask containing 15 mL of mobile phase. The flasks were then sonicated for 10 min and the volume was made up to the mark by using mobile phase. These standard stock solutions were containing 2000μg/mL of RAC and OFL. Stock solutions were used to prepare desired concentration range as per sample calibration range.
Twenty tablets were weighed and emptied. The equivalent weight was calculated and according to average weight, required drug was taken in volumetric flask to obtain 100mg of RAC and 200mg of OFL in single dilution i.e. according to the label claim of the formulation. The dilutions were first sonicated and then filtered through 0.22-micron filter paper.
The test concentrations for Linagliptin and empagliflozin in HPLC method development were found to be 100μg/mL and 200μg/mL respectively. The calibration curve was prepared by injecting the concentrations of 60-140 μg/mL of RAC and 120-280 μg/mL of OFL in mixture solution manually in triplicate to the HPLC system at detection wavelength of 210 nm. Mean of n=5 determinations was plotted as the standard curve. The calibration curve was tested by validating it with inter-day and intra-day measurements. Linearity, accuracy and precision were performed for both inter-day and intra-day measurements.
The methods were validated according to International Conference on Harmonization Q2B guidelines (2005) for validation of analytical procedures to determine the linearity, sensitivity, precision and accuracy for each analyte. Calibration curves were generated with appropriate volumes of working standard solutions for HPLC. For HPLC assay method validation, the test concentrations were found to be 100μg/mL of EMF and 200μg/mL of LNG. Linearity of the proposed method was carried out by the preparation of 60%, 80%, 100%, 120% and 140% of Linagliptin and empagliflozin test concentration i.e.60, 80, 100, 120,140 μg/mL for empagliflozin and 120, 160, 200, 240, 280 μg/mL for Linagliptin. The linearity was evaluated by the least square regression method using weight data.
Both precision and accuracy were determined with standard quality control samples (in addition to calibration standards) prepared in triplicates at different concentration levels covering the entire linearity range. Precision is defined as a degree of repeatability of an analytical method under normal operational conditions. The precision of the assay was determined by repeatability (intra-day) and intermediate precision (interday) and reported as %R.S.D. for a statistically significant number of replicate measurements. The intermediate precision was carried out by comparing the assays on 3 different days and the results documented as standard deviation and %R.S.D7.
Accuracy is the percent of analyte recovered by assay from a known added amount. For the measurement of accuracy, data from nine determinations over three concentration levels covering the specified range were determined. The samples containing 80%, 100%, and 120% of test concentrations were spiked with 100%of standard solution in HPLC and percentage recovery was calculated8.
The limit of detection (LOD) is defined as the lowest concentration of an analyte that an analytical process can reliably differentiate from background levels. The limit of quantification (LOQ) is the lowest concentration of the standard curve that can be measured with acceptable accuracy, precision and variability9. The LOD and LOQ were calculated as
LOD =3.3σ/S
LOQ =10σ/S
Where σ is the standard deviation of the lowest standard concentration and S is the slope of the standard curve.
The stability of Linagliptin and empagliflozin in mobile phase was assessed by analyzing the sample concentrations at 1 h, 4 h, 9 h, 24 h, 48 h and 60 h. The concentrations used in this study were 100μg/mL for Linagliptin and 200μg/mL for empagliflozin prepared from stock solution of pure form and powdered tablet sample, respectively. Six replicate samples for each concentration were assayed at each time point. The stability was tested over a period of three days at room temperature.
The effect of intentional variation in analytical conditions such as detection wavelength, mobile phase flow rate and mobile phase composition on the retention time and peak area was investigated one by one.
For the assay estimation of marketed formulation by HPLC, Weighed 10 tablets. Accurately weighed powder sample equivalent to 100mg of Linagliptin and 200mg of empagliflozin was dissolved in a 100 mL volumetric flask containing mobile phase. The solution was kept for sonication for 20 min, filtered through Whatmann filter paper No. 41. Aliquot of this solution was diluted to produce the concentration of100μg/mL for RAC and 200μg/mL for OFL. (n= 6).
RP-HPLC spectrophotometric methods were developed for Linagliptin and empagliflozin which can be conveniently employed for routine analysis in pharmaceutical dosage forms and will eliminate unnecessary tedious sample preparations. The chromatographic conditions were optimized in order to provide a good performance of the assay. The retention time of Linagliptin and empagliflozin in tablets formulation were found to be 2.551 min and 4.666 min respectively. The chromatograms have been shown in (Fig3 (a)). Various system suitability parameters are shown in Table 1. A five point calibration curve was constructed with working standards and was found linear (r2 ≥0.998 and 0.997) for Linagliptin and empagliflozin over their calibration ranges. The slopes were calculated using the plot of drug concentration versus area of the chromatogram. The developed HPLC method was accurate, precise, reproducible and very sensitive shown in fig (3).
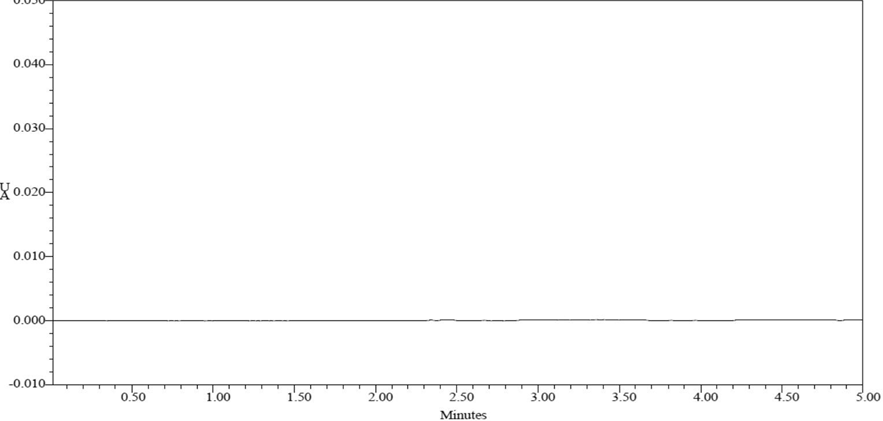
Fig-: Chromatogram showing blank (mobile phase preparation)
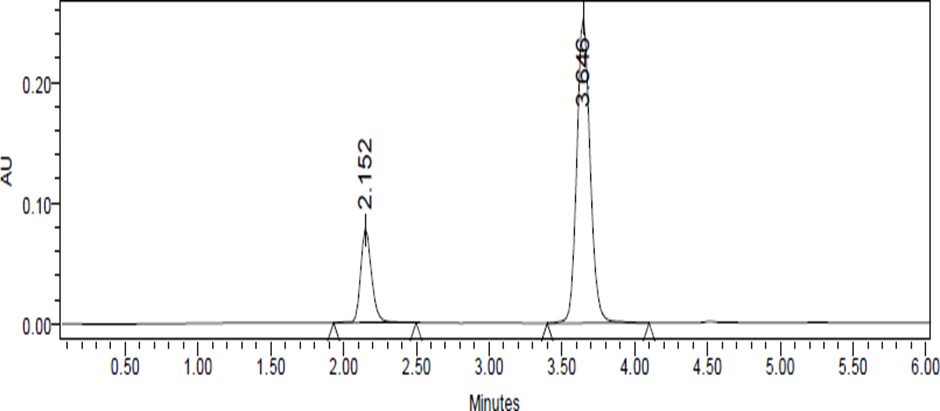
Fig.3.Typical chromatogram showing EMPF and LINA
System suitability
System suitability
System suitability parameters such as number of theoretical plates, HETP and peak tailing are determined. The results obtained are shown in Table 1
Table-1. Results of system suitability for Empagliflozin
|
Sr. No. |
Peak Name |
RT |
Area (µV*sec) |
Height (µV) |
USP |
USP |
|
1 |
Empagliflozin |
2.152 |
526856 |
78569 |
1.63 |
5856 |
|
2 |
Empagliflozin |
2.157 |
528794 |
78545 |
1.63 |
5874 |
|
3 |
Empagliflozin |
2.141 |
526598 |
78954 |
1.62 |
5869 |
|
4 |
Empagliflozin |
2.133 |
524875 |
78224 |
1.63 |
5897 |
|
5 |
Empagliflozin |
2.166 |
526584 |
78965 |
1.62 |
5829 |
|
Mean |
|
|
526741.4 |
|
|
|
|
Std. Dev. |
|
|
1392.398 |
|
|
|
|
% RSD |
|
|
0.264342 |
|
|
|
Linearity
The calibration curve was linear over the concentration range of 5-25 and 1-5μg/ml for EMPA and LINA. The linearity was represented by a linear regression equation as follows:
Y (EMPA) = 43.57conc+6.888 (r2 = 0.999)
Y (LINA) = 252.8conc+5.372 (r2 = 0.999)
Table-2. Results of system suitability for Linagliptin
|
Sr. No |
Peak Name |
RT |
Area (µV*sec) |
Height (µV) |
USP Plate Count |
USP Tailing |
Resolution |
|
1 |
|
3.6 |
16459 |
2685 |
5869 |
1.48 |
10.01 |
|
2 |
Linaglip |
3.6 |
16485 |
2678 |
5874 |
1.49 |
10.01 |
|
3 |
Linaglip |
3.6 |
16457 |
2685 |
5864 |
1.48 |
9.99 |
|
4 |
Linaglip |
3.6 |
164528 |
2687 |
5826 |
1.49 |
10.01 |
|
5 |
Linaglip |
3.6 |
164859 |
2685 |
5824 |
1.48 |
10.02 |
|
Mean |
|
|
16468 |
|
|
|
|
|
Std. |
|
|
1618.3 |
|
|
|
|
|
% |
|
|
0.0982 |
|
|
|
|
Table .3.Linearity data of Empagliflozin and Linagliptin
|
Linagliptin |
Empagliflozin |
||
|
Concentration (µg/mL) |
Average Peak Area |
Concentration (µg/mL) |
Average Peak Area |
|
20 |
665985 |
10 |
185689 |
|
40 |
1298698 |
20 |
349852 |
|
60 |
1927852 |
30 |
521541 |
|
80 |
2548545 |
40 |
685986 |
|
100 |
3162468 |
50 |
848265 |
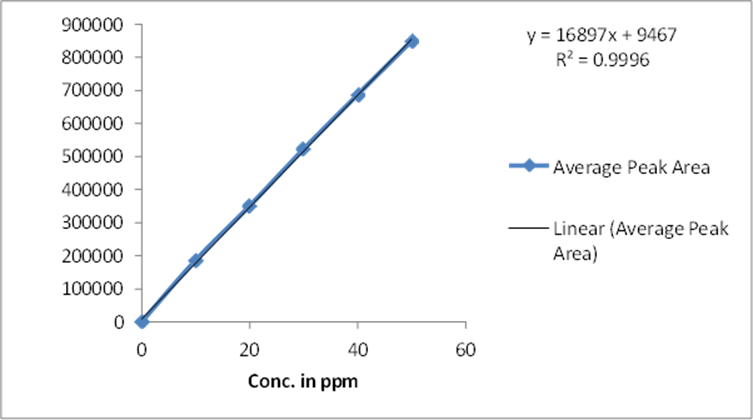
Fig-: Calibration Curve of Empagliflozin
System suitability parameters such as number of theoretical plates, HETP and peak tailing are determined.
The results obtained are shown in Table 1
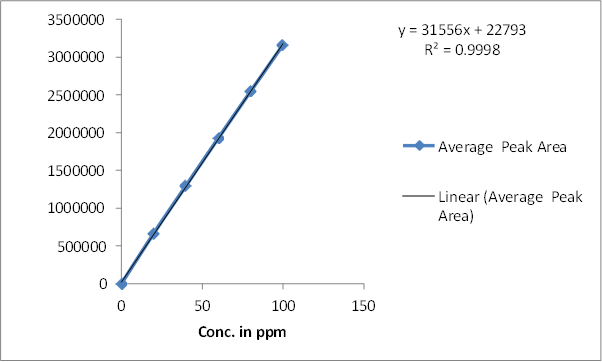
Fig-: Calibration Curve of Linagliptin
Accuracy
Method accuracy was performed by adding known amounts of EMPA and LINA to the preanalysed tablet solution and then comparing the added concentration with the found concentration. Three levels of solutions were made which correspond to 80%, 100% and 120% of the nominal analytical concentration (15, 3μg/ml for EMPA and LINA). Each level was made in triplicate Table 2. The mean percentage recoveries obtained for EMPA and LINA was 98.77-99.12% and 98.48-99.03% respectively and RSD was less than 2.
Precision
Repeatability
The repeatability was performed for five replicate at five concentrations in linearity range 5, 10, 15, 20 and 25 g/ml for EMPA and 1, 2, 3, 4 and 5 g/ml for LINA indicates the precision under the same operating condition over short interval time and results were found within acceptable limits (RSD < 2) as shown in summary table 6 & 7.
Intermediate precision
Five dilutions in three replicates were analyzed on two different days and by two analysts for day-to-day and analyst-to-analyst variations and results were found within acceptable limits (RSD < 2) as shown in summary table 6 & 7.
Robustness
As per ICH norms, small but deliberate variations in concentration of the mobile phase were made to check the method’s capacity to remain unaffected. The ratio of mobile phase was change from, acetonitrile: methanol (50:50 % v/v) to (45:55 % v/v). Results of robustness are reported in in summary table.
Detection limit and quantitation limit
The LOD and LOQ of developed method were calculated based on the standard deviation of response and slope of the linearity curve table 4.
Table 4 Results of LOD and LOQ
|
NAME |
LOD (µg/ml) |
LOQ (µg/ml |
|
EMPF |
0.129 |
0.321 |
|
LINA |
0.213 |
0.456 |
Analysis of tablets
The concentration of EMPA and LINA in the tablets formulation was found to be 99.7 and 98.40%. The low values of % RSD indicate that the method is precise and accurate in Table 5.
Table 5.Analysis of tablet formulation
|
|
EMPF |
LINA |
|
Label Claim (mg) |
10mg |
5mg |
|
% Found (mg) |
9.96 |
4.78 |
|
% Assay |
99.1 |
98.70 |
|
% RSD |
0.025 |
0.043 |
SUMMARY
Table 6. Summary of validation data for Empagliflozin:
|
Sr. No |
Parameter |
Observation |
Acceptance criteria |
|
1 |
System suitability: Theoretical plates Tailing %RSD |
5859 1.62 0.9 |
Not less than 2000 Not more than 2 Not more than 2.0% |
|
2 |
Specificity: %Assay |
99.63% |
98-102% |
|
3 |
Method Precision: (%RSD) |
0.277 |
Not more than 2.0% |
|
4 |
Linearity: Slope Correlation coefficient (r2) |
10-50 µg/ml 16897 0.999 |
≤0.99 |
|
5 |
Accuracy: Mean % recovery |
100.37% |
98 - 102% |
|
6 |
Robustness
|
All the system suitability parameters are within the limits |
|
Table 7.Summary of validation data for Linagliptin:
|
Sr. No |
Parameter |
Observation |
Acceptance criteria |
|
1 |
System suitability: Theoretical plates Tailing %RSD |
7965 1.48 0.1 |
Not less than 2000 Not more than 2 Not more than 2.0% |
|
2 |
Specificity: %Assay |
99.63% |
98-102% |
|
3 |
Method Precision: (%RSD) |
0.090 |
Not more than 2.0% |
|
4 |
Linearity: Slope Correlation coefficient (r2) |
20-100 µg/ml 27563 0.999 |
≤0.99 |
|
5 |
Accuracy: Mean % recovery |
100.34% |
98 - 102% |
|
6 |
Robustness
|
All the system suitability parameters are within the limits. |
|
CONCLUSION
In the present investigation, a simple, sensitive, precise and accurate RP-HPLC method was developed for the quantitative estimation of Empagliflozin and Linagliptin in bulk drug and pharmaceutical dosage forms. This method was simple, since diluted samples are directly used without any preliminary chemical derivatisation or purification steps. Empagliflozin was found to be soluble in organic solvents such as ethanol, DMSO, and dimethyl formamide; it is very slightly soluble in water, slightly soluble in Acetonitrile and ethanol, sparingly soluble in methanol, practically insoluble in toluene. Linagliptin was found to be very slightly soluble in water (0.9 mg/mL). Linagliptin is soluble in methanol (ca. 60 mg/mL), sparingly soluble in ethanol (ca. 10 mg/mL), very slightly soluble in isopropanol (<1 mg/mL), and very slightly soluble in acetone. Methanol: TEA Buffer (65:35 v/v) was chosen as the mobile phase. The solvent system used in this method was economical. The %RSD values were within 2 and the method was found to be precise. The results expressed in Tables for RP-HPLC method was promising. The RP-HPLC method is more sensitive, accurate and precise compared to the Spectrophotometric methods. This method can be used for the routine determination of Empagliflozin and Linagliptin in bulk drug and in pharmaceutical dosage forms.
CONFLICT OF INTEREST
The authors confirm that this article content has no conflict of interest
REFERENCES


Divya Jyothi, Dr. S. Shobha Rani, Simultaneous Estimation of Empagliflozin and Linagliptin in Bulk and Pharmaceutical Dosage Form by Reverse Phase-High Performance Liquid Chromatography, Int. J. of Pharm. Sci., 2025, Vol 3, Issue 11, 358-368. https://doi.org/10.5281/zenodo.17515692
 10.5281/zenodo.17515692
