Department of Quality Assurance, Shri D D Vispute College of Pharmacy and Research Center, Panvel, Navi Mumbai
For the Measurement and Quantification of Empagliflozin and Sitagliptin Phosphate, A rapid, simple, sensitive, and reliable RP-HPLC technique using a Jasco HPLC System with PDA detection was designed and validated. The RP-HPLC elusion was carried out at Isosbestic point 246nm with 1 mL/min flow rate using column BDS Hypersil C18 (250*4.6mm, 5 ?m) with Potassium Dihydrogen Phosphate Buffer (pH3.5): Acetonitrile (50:50 v/v) as the mobile phase. The wavelength was 246 nm, and the 1 ml/min was the flow rate. The column temperature was maintained at 25 °C. Empagliflozin and sitagliptin phosphate were shown to have retention durations of 3.5 and 5.6 minutes, accordingly. The LOD (limits of detection) & LOQ (limits of quantitation) for Empagliflozin were 5.02?g/mL and 15.23?g/mL, correspondingly, whereas for Sitagliptin phosphate they were 45.10?g/mL and 136.68?g/mL. The drug was analysed by developed method following stress conditions like; hydrolytic, photolytic, oxidative, and thermal degradation studies. The suggested process has been validated per the ICH Q2 (R1) guidelines.
A stability-indicating assay methodology is described as: "A validated quantitative analytical approach that can detect changes over time in the physical, chemical, or microbiological features of the drug substance and drug products can be used to assess the concentration of active components and degradation products precisely and without interference."1 For stability-indicating assay techniques the standard method for preparing samples is forced degradation/stress testing. "Testing the stability of drug substances and products under settings different from those used for accelerated stability testing" is the description of required degradation/stress testing.2. The medicine may deteriorate by 5 to 20% if it is exposed to extreme pH (NaOH or HCl solutions of several strengths) at high temperatures, UV light, hydrogen peroxide (at room temperature), as well as dry heat (in an oven) over an extended period. These experiments usually entail trial and error. A methodical approach should be aplied in place of this trial-and-error technique, that was labor-intensive, frequently costly, and time-consuming3–4.
Empagliflozin:
Empagliflozin, a gliflozin-class drug, was authorised for treating type 2 diabetes in adults in 2014. Boehringer Ingelheim and Eli Lilly & Company5 created it. Empagliflozin prevents SGLT-2 (sodium-glucose cotransporter-2), causing sugar in blood to be eliminated and removed in the urine. It is commonly used in type 2 diabetics to reduce blood glucose levels2. It can decrease the danger of cardiovascular fatalities and congestive heart failure in individuals with type 2 diabetes. Empagliflozin inhibits SGLT-2, a sodium-glucose cotransporter located mostly in the kidney's proximal tubules. About 90% of the reabsorption of glucose into the bloodstream is attributed to SGLT-2. By inhibiting reabsorption in the kidney and its excretion through urine, blocking SGLT-2 lowers blood glucose levels6–8.
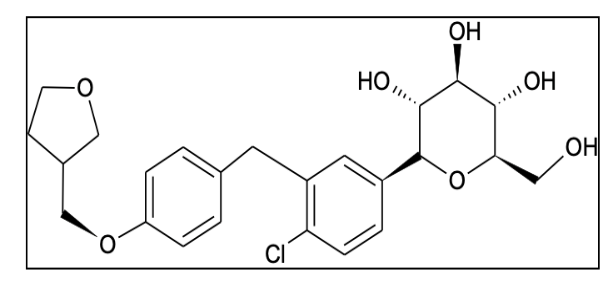
Figure 1: Structure of Empagliflozin
IUPAC Name:
(2S,3R,4R,5S,6R)-2-[4-chloro-3-({4-[(3S)-oxolan-3yloxy]phenyl}methyl)phenyl]-6-(hydroxymethyl)oxane-3,4,5-triol
Molecular Formula: C23H27ClO7
Molecular Weight: 450.9 g/mol
Half-life:12.4 hours
Solubility: In methanol sparingly soluble; and in ethanol and ACN slightly soluble
Category: Anti-diabetic
Sitagliptin Phosphate:
Sitagliptin phosphate is a dipeptidyl peptidase-4 (DPP-4) inhibitor that is taken orally to treat hyperglycemia. This enzyme-inhibiting drugs is used to treat type 2 diabetes mellitus alone or in combination with other oral antihyperglycemic drugs. Sitagliptin works by competitively inhibiting the enzyme DPP-4. This enzyme degrades the incretins GLP-1 and GIP, gastrointestinal hormones secreted in response to a meal. They can boost insulin secretion while suppressing glucagon release by inhibiting GLP-1 and GIP inactivation. This brings blood glucose levels closer to normal9-13.
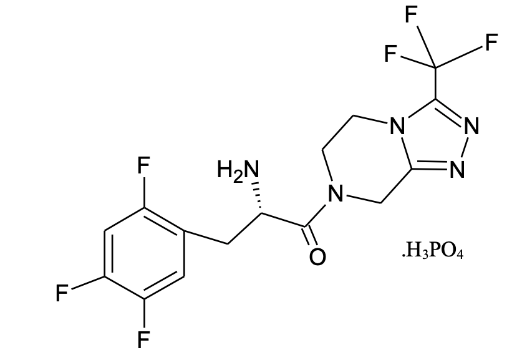
Figure 2: Structure of Sitagliptin Phosphate
IUPAC Name:
(“3R)-3-amino-1-[3-(trifluoromethyl)-6,8-dihydro-5H-[1,2,4]triazolo[4,3-a]pyrazin-7-yl]-4-(2,4,5-trifluorophenyl)butan-1-one;phosphoric acid
Molecular Formula: C16H18F6N5O5P
Molecular” Weight: 505.31g/mol
Half-life: 8 to 14 hours
Solubility: Water-soluble; very weakly soluble in ethanol
Category: Anti-diabetic
According to the literature review, different analytical processes have been stated for the individual analysis of Empagliflozin & Sitagliptin phosphate, as well as for their combinations with other drugs. However, for the simultaneous estimation of Sitagliptin phosphate and Empagliflozin, only a limited number of techniques exist. For the immediate estimation of empagliflozin and sitagliptin phosphate in their combination dose form, no stability-indicating RP-HPLC technique has been created. The objective is to validate and develop a straightforward, accurate, precise, and specific RP-HPLC technique that indicates the stability for quantifying sitagliptin phosphate and empagliflozin.
MATERIALS AND METHODS:
Instrument: The absorbance of Empagliflozin and Sitagliptin phosphate was determined using a Shimadzu 1800 UV-VIS spectrophotometer. For HPLC analysis, a Jasco Extrema LC-4000 system with a PDA detector was employed, and ChromNAV software was used for data analysis.
Chemicals and Reagents: The Empagliflozin’s working standard was kindly provided by Metrochem API Private Limited, Andhra Pradesh, while the Sitagliptin phosphate working standard was sourced from Morepen Laboratories Limited, Himachal Pradesh. HPLC-grade Acetonitrile and Methanol had been procured from the Merck Life Science Pvt. Ltd., and Potassium dihydrogen phosphate had been obtained from Rankem.
Chromatographic Conditions:
A Jasco Extrema LC-4000 HPLC system with a photodiode array detector was employed. ChromNAV software was used on a computer to monitor and analyze the output signal. A BDS Hypersil C18 column (250×4.6 mm, 5 ?m) was used to achieve separation. Acetonitrile and potassium dihydrogen phosphate buffer were mixed 50:50 (v/v) to create mobile phase, which had a 1 mL/min flow rate. At 246nm, detection took place while the temp. of the column has been kept at 25°C. The volume of the injection was 10?L. The diluent was a 60:40 v/v ratio of methanol to water. Table 1 displays the optimal circumstances.
Table 1: Chromatographic Conditions
|
Column |
BDS Hypersil C18 (250*4.6mm,5 ?m) |
|
Mobile Phase |
Potassium Dihydrogen Phosphate Buffer: Acetonitrile (50:50 v/v) pH adjusted to 3.5 |
|
Wavelength |
246nm |
|
Flow rate |
1mL/min |
|
Injection volume |
10 ?L |
|
Run time |
10 min |
|
Temperature |
250C |
|
Diluent |
Methanol:Water (60:40 v/v) |
|
Elusion mode |
Isocratic |
Methods:
Preparation of Potassium Dihydrogen Phosphate Buffer(0.01M): In 1000milliliters of water, dissolve 1.36grams of potassium dihydrogen phosphate. Use orthophosphoric acid to bring the pH down to 3.5.
Preparation of Standard solution: Separately weigh 100mg of sitagliptin phosphate and empagliflozin, then transfer each to a 100mL volumetric flask that has been cleaned and dried. To achieve a concentration of 1000?g/mL, add a 50:50 v/v mixture of methanol as well as water to each flask. Sonicate the solutions until they are completely dissolved. Using the same solvent, dilute 10mL of the 100mL of standard stock solution, resulting in a conc. of 100 ?g/mL, to create a sub-stock solution.
Preparation of Sample solution: The sample stock solution was made by precisely weighing twenty tablets and crushing them into a fine powder. A 100 mL volumetric flask was filled with a measured quantity of the powder, which was equal to 100mg of sitagliptin phosphate and 10 mg of empagliflozin. To ensure full solubility, the powder was dissolved in a methanol: water combination and then sonicated. The stock solution (1Ml) was put into a volumetric flask (10mL) along with diluted with the diluent to the appropriate level to produce a solution having a 100?g/mL of concentration.
Method Development and Validation of HPLC:
The suggested analytical technique was verified based on the ICH requirements (Q2 R1) for parameters like ruggedness, specificity, linearity, and system applicability.
Forced Degradation Studies:
1mL of the filtered stock solution had been moved to a volumetric flask of 10 mL & diluted including diluent to 10 mL to conduct forced deterioration studies. For each stress condition, three sample solutions were ready at a concentration of 10 ppm for EMPA and 100 ppm for SITA. These solutions were subjected to the following stress conditions:
Acidic Degradation:
Acidic degradation was induced by mixing 1N HCl of 1 mL to the sample. After 24 hours, the mixture had beeen neutralized using 1mL of NaOH (1N). Finally, solution was made up of target concentration.
Alkaline Degradation:
Alkaline degradation was performed by adding 1 mL of NaOH (1N) to the sample. After 24 hours, with 1N HCl of 1 mL, the mixture was neutralized. Finally, the solution was made up of target concentration.
Oxidative Degradation:
Oxidative degradation was carried out by treating the sample with 1 mL of 30% (v/v) hydrogen peroxide (H?O?) for 24 hours. Finally, the solution was made up of target concentration.
Thermal Degradation:
To perform thermal degradation, API was positioned in a petri dish as well as baked at 60°C for two hours. To evaluate the sample's stability, a 10 µL solution had been mixed into the system.
Photolytic Degradation:
The sample has been exposed to UV light for two hours in a UV chamber in order to assess photolytic deterioration. Ten microliters of solution were added to the device in order to record the chromatograms and evluate the sample stability.
RESULTS AND DISCUSSION:
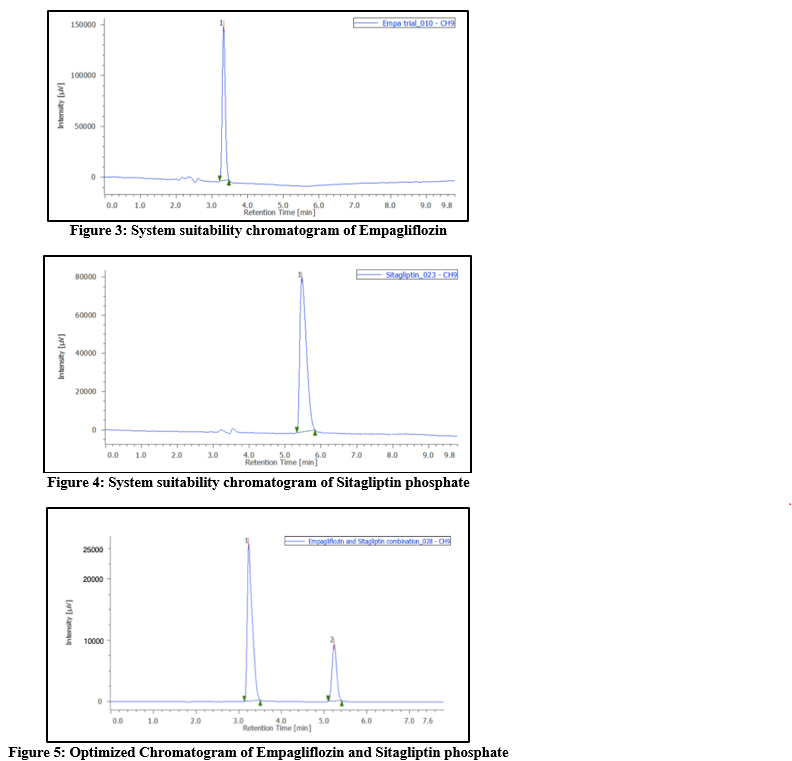
System suitability: Following the recommended protocol, a standard solution of empagliflozin and sitagliptin phosphate was made and six injections were made into the HPLC system. The suitability parameters of the system were assessed using the standard chromatograms and the percentage RSD of the tailing factor, retention duration, theoretical plates, as well as peak regions from 6 replicate injections. The results have been shown in Table 2, and all parameters were determined to be within the permissible range.
Table 2. System suitability for Empagliflozin and Sitagliptin phosphate
|
Parameters |
Empagliflozin |
Sitagliptin phosphate |
|
Retension time |
3.327 |
5.625 |
|
Peak area |
894328 |
16390 |
|
Theoretical plates |
7388 |
7574 |
|
Symmetry factor |
1.187 |
1.292 |
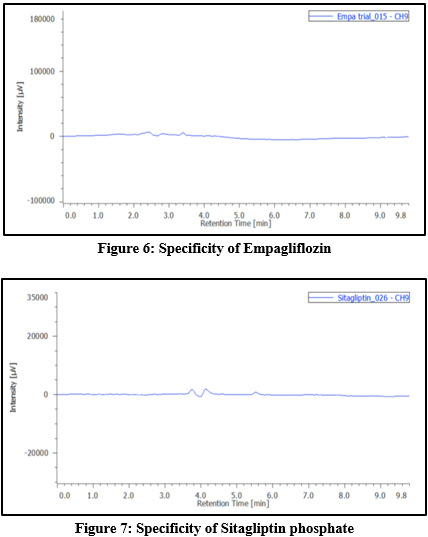
Specificity: The analytical method must be capable of distinguishing and resolving all process impurities, including both known and unknown degradation impurities, observed during stress testing.
Linearity: Standard solutions were prepared with concentrations of 10-60?g/mL for Empagliflozin and 100-600?g/mL for Sitagliptin phosphate. After injecting these solutions, a graph showing the relationship between concentration and peak area was created. The resulting straight line confirmed the linearity of the methodology. The linearity data is described in Table 3 for Empagliflozin and sitagliptin phosphate.
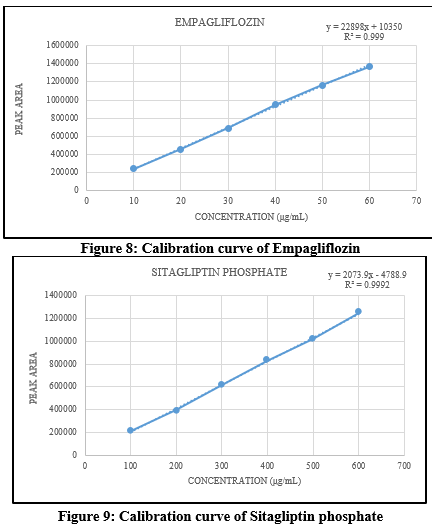
Table 3. Linearity of Empagliflozin and Sitagliptin phosphate
|
Sr. No. |
Empagliflozin |
Sitagliptin phosphate |
||
|
Concentration(?g/mL) |
Peak Area |
Concentration(?g/mL) |
Peak Area |
|
|
1. |
10 |
241351 |
100 |
214831 |
|
2. |
20 |
459555 |
200 |
394694 |
|
3. |
30 |
688195 |
300 |
617200 |
|
4. |
40 |
947555 |
400 |
830745 |
|
5. |
50 |
1164849 |
500 |
1020966 |
|
6. |
60 |
1369156 |
600 |
1248123 |
Accuracy: To evaluate recovery, known quantities of the drugs were added to the placebo at levels corresponding to 50percent, 100percent, and 150percent of the labeled claim of the marketed formulation. For every stage, three samples were made. After the solutions had been examined, the calibration curve was used to calculate the recovery percentage. Tables 4 and 5 display the accuracy findings.
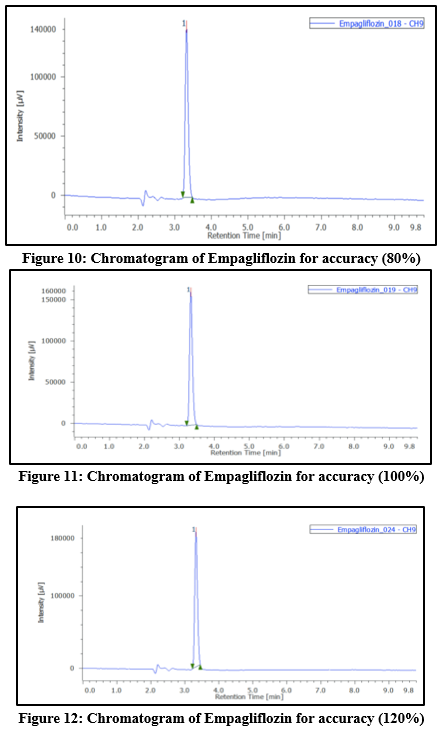
Table 4. Accuracy data of Empagliflozin
|
Level |
Peak area |
calculated concentration |
% recovery |
mean concentration |
standard deviation |
%RSD |
|
0.8 |
832951 |
35.92457857 |
99.30% |
35.75737328 |
0.236720267 |
0.662018055 |
|
831496 |
35.8610359 |
|||||
|
822920 |
35.48650537 |
|||||
|
1 |
927410 |
40.04978601 |
100.72% |
40.29292223 |
0.294053238 |
0.729788811 |
|
940461 |
40.61974845 |
|||||
|
931061 |
40.20923225 |
|||||
|
1.2 |
1016492 |
43.94016945 |
101.54% |
44.6851399 |
0.666465527 |
1.49147016 |
|
1045907 |
45.22477946 |
|||||
|
1038252 |
44.89047078 |
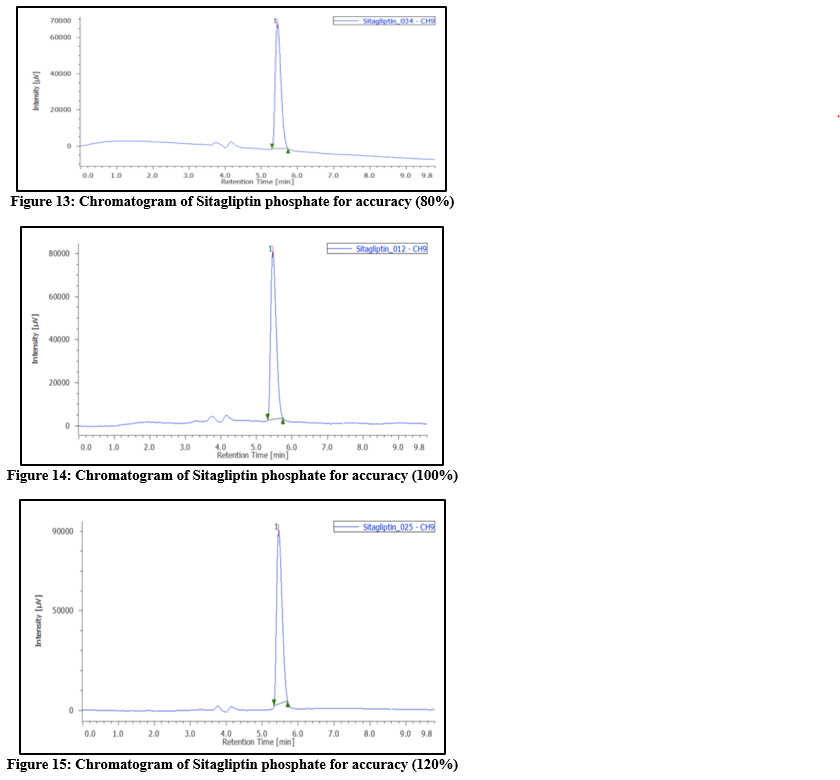
Table 5: Accuracy data of Sitagliptin phosphate
|
Level |
Peak area |
calculated concentration |
% recovery |
mean concentration |
standard deviation |
%RSD |
|
0.8 |
745674 |
357.242442 |
99.43% |
357.9727888 |
0.9159627 |
0.25587495 |
|
749320 |
359.000482 |
|||||
|
746572 |
357.675442 |
|||||
|
1 |
833028 |
399.363084 |
100.23% |
400.9523603 |
1.67616579 |
0.41804612 |
|
839956 |
402.70365 |
|||||
|
835988 |
400.790347 |
|||||
|
1.2 |
918994 |
440.814456 |
100.26% |
441.1754504 |
2.38520415 |
0.54064752 |
|
915213 |
438.991321 |
|||||
|
925021 |
443.720575 |
Precision: Intra-day precision was assessed by preparing samples from the same batch at three different concentrations, with 3 replicates for all concentrations. Inter-day precision was evaluated by analyzing the dosage form in triplicate over three consecutive days. Additionally, precision was confirmed by injecting the standard solution 6 times. The outcomes were reported as %RSD.
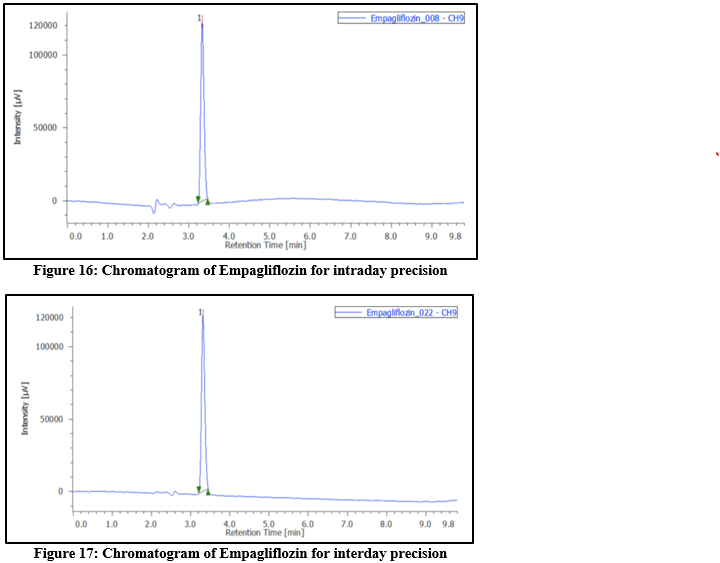
Table 6: Results of Intraday and Interday precision by RP-HPLC method for Empagliflozin
|
Sr. No. |
Sample Name |
Intraday |
Interday |
|
Concentration 30 ?g/mL |
Area |
||
|
1 |
TEST_1 |
706872 |
691116 |
|
2 |
TEST_2 |
697375 |
693340 |
|
3 |
TEST_3 |
689391 |
672151 |
|
4 |
TEST_4 |
700765 |
703531 |
|
5 |
TEST_5 |
704219 |
704655 |
|
6 |
TEST_6 |
700835 |
709021 |
|
|
|||
|
Mean |
699909.50 |
695636 |
|
|
|
|||
|
SD |
6094.25 |
13417.00 |
|
|
|
|||
|
%RSD |
0.87 |
1.93 |
|
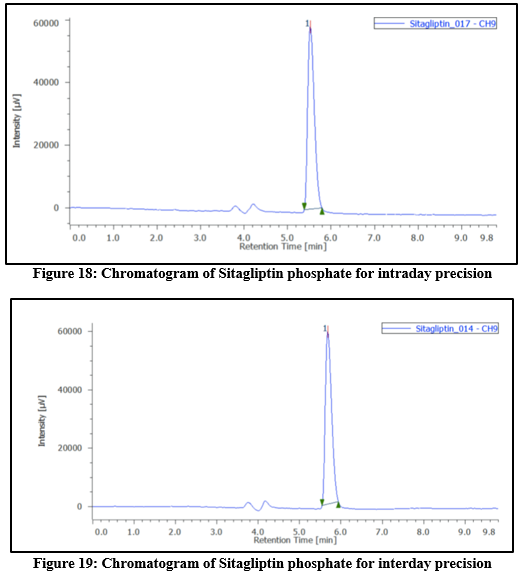
Table 7: Results of Intraday and Interday precision by RP-HPLC method for Sitagliptin phosphate
|
Sr. No. |
Sample Name |
Intraday |
Interday |
|
Concentration 300 ?g/mL |
Area |
||
|
1 |
TEST_1 |
617945 |
616654 |
|
2 |
TEST_2 |
624804 |
604425 |
|
3 |
TEST_3 |
611992 |
613485 |
|
4 |
TEST_4 |
606876 |
621457 |
|
5 |
TEST_5 |
616273 |
621189 |
|
6 |
TEST_6 |
611850 |
627563 |
|
|
|||
|
Mean |
614956.67 |
617462.17 |
|
|
|
|||
|
SD |
6186.61 |
7978.89 |
|
|
|
|||
|
%RSD |
1.01 |
1.29 |
|
Limit of Detection (LOD) and Limit of Quantitation (LOQ):
The LOQ & LOD had been used to assess the method's sensitivity. These were computed by infusing a succession of diluted solutions with known concentrations, yielding signal-to-noise ratios of 10:1 for LOQ as well as 3:1 for LOD. In contrast to LOQ values of 15.23µg/mL and 136.68µg/mL, respectively, the LOD values for EMPA and SITA have been 5.02 µg per mL and 45.10 µg per mL. These results demonstrate that the method is highly sensitive.
Robustness:
Intentional modifications to the chromatographic conditions were used to evaluate the method's robustness. This involved varying parameters such as flow rate (± 2%), temperature (± 5°C), and wavelength (± 2nm). The flow rate had been adjusted between 0.8mL per min and 1.2mL per min, and the mobile phase’s composition was altered by 5%. The method showed consistent performance under lower flow rate conditions. The %RSD values obtained during the study were below 2%, indicating that the method is robust and reliable.
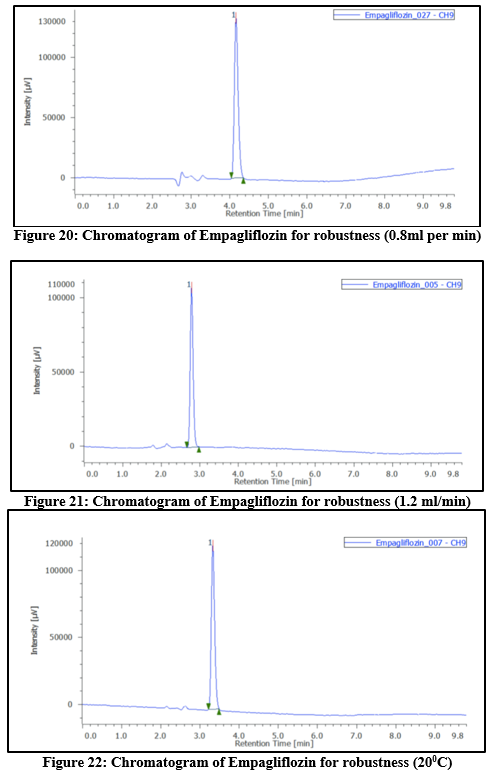
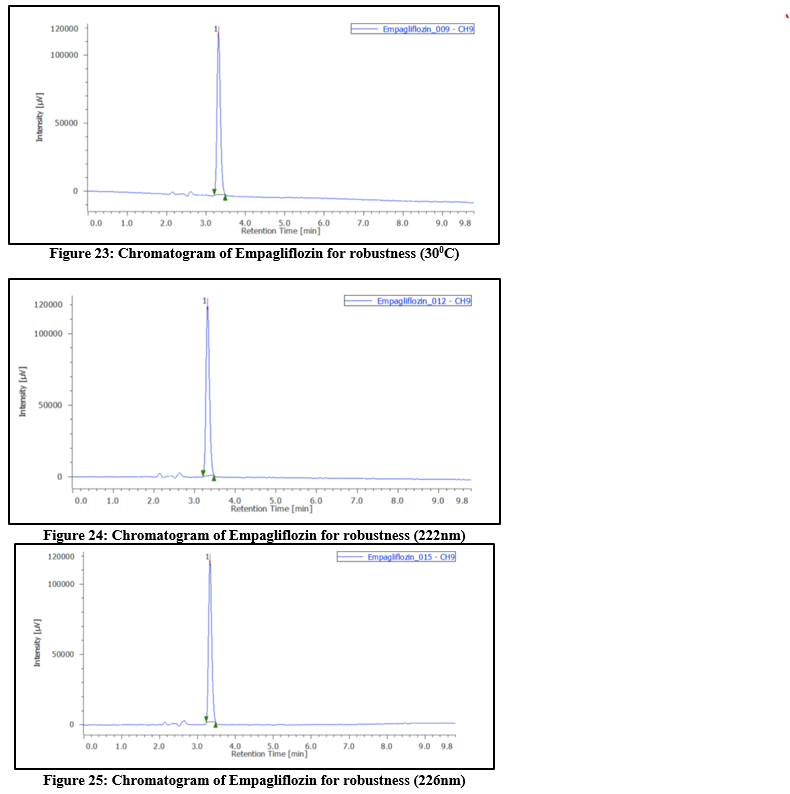
Table 8: Robustness results at different temperature, flow rate and wavelength for Empagliflozin
|
SR NO. |
1 |
2 |
3 |
MEAN |
SD |
%RSD |
||
|
FLOW RATE |
1.2ml/min |
AREA |
572348 |
578570 |
560597 |
570505 |
9127.14 |
1.60 |
|
RT |
2.783 |
2.787 |
2.783 |
3 |
0.00 |
0.08 |
||
|
NTP |
6626 |
6711 |
6714 |
6684 |
49.96 |
0.75 |
||
|
0.8ml/min |
AREA |
912164 |
893682 |
884795 |
896880 |
13962.00 |
1.56 |
|
|
RT |
4.16 |
4.15 |
4.147 |
4 |
0.01 |
0.16 |
||
|
NTP |
8599 |
8724 |
8936 |
8753 |
170.36 |
1.95 |
||
|
TEMP |
20°C |
AREA |
713298 |
724268 |
705846 |
714471 |
9266.82 |
1.30 |
|
RT |
3.337 |
3.327 |
3.313 |
3 |
0.01 |
0.36 |
||
|
NTP |
7342 |
7326 |
7315 |
7328 |
13.58 |
0.19 |
||
|
30°C |
AREA |
710366 |
723936 |
715779 |
716694 |
6831.08 |
0.95 |
|
|
RT |
3.317 |
3.317 |
3.313 |
3 |
0.00 |
0.07 |
||
|
NTP |
7276 |
7264 |
7254 |
7265 |
11.02 |
0.15 |
||
|
WAVELENTH |
222nm |
AREA |
703083 |
708675 |
707382 |
706380 |
2927.56 |
0.41 |
|
RT |
3.32 |
3.32 |
3.31 |
3 |
0.01 |
0.17 |
||
|
NTP |
7483 |
7413 |
7267 |
7388 |
110.21 |
1.49 |
||
|
226nm |
AREA |
664787 |
663413 |
672451 |
666884 |
4870.15 |
0.73 |
|
|
RT |
3.327 |
3.317 |
3.32 |
3 |
0.01 |
0.15 |
||
|
NTP |
7675 |
7567 |
7392 |
7545 |
142.82 |
1.89 |
||
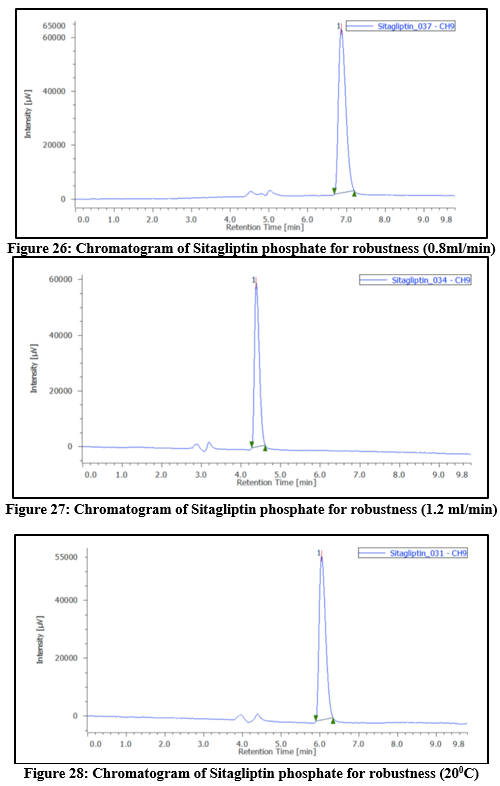
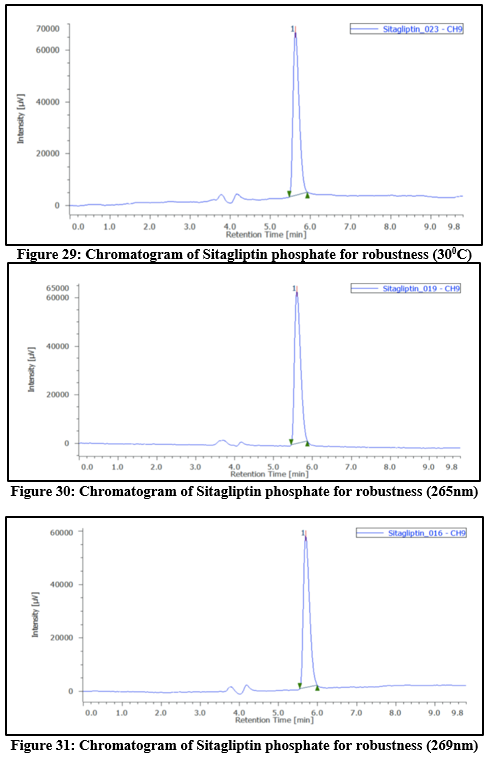
Table 9: Robustness outcomes at different temperatures, flow rates, as well as wavelength for Sitagliptin phosphate
|
SR NO. |
1 |
2 |
3 |
MEAN |
SD |
%RSD |
||
|
FLOW RATE |
1.2ml/min |
AREA |
791405 |
771222 |
766150 |
776259 |
13359.73 |
1.72 |
|
RT |
6.863 |
6.803 |
6.787 |
7 |
0.04 |
0.59 |
||
|
NTP |
6074 |
6139 |
6130 |
6114 |
35.22 |
0.58 |
||
|
0.8ml/min |
AREA |
497640 |
486223 |
482453 |
488772 |
7907.86 |
1.62 |
|
|
RT |
4.383 |
4.407 |
4.403 |
4 |
0.01 |
0.29 |
||
|
NTP |
5963 |
6010 |
6003 |
5992 |
25.36 |
0.42 |
||
|
TEMP |
20°C |
AREA |
668324 |
653316 |
651324 |
657655 |
9293.44 |
1.41 |
|
RT |
5.973 |
6.04 |
6.027 |
6 |
0.04 |
0.59 |
||
|
NTP |
6025 |
5996 |
5988 |
6003 |
19.47 |
0.32 |
||
|
30°C |
AREA |
651310 |
663556 |
658772 |
657879 |
6171.61 |
0.94 |
|
|
RT |
5.773 |
5.623 |
5.603 |
6 |
0.09 |
1.64 |
||
|
NTP |
6144 |
6354 |
6360 |
6286 |
123.01 |
1.96 |
||
|
WAVELENTH |
265nm |
AREA |
675853 |
677577 |
669985 |
674472 |
3980.03 |
0.59 |
|
RT |
5.597 |
5.683 |
5.703 |
6 |
0.06 |
0.99 |
||
|
NTP |
5889 |
6027 |
6085 |
6000 |
100.68 |
1.68 |
||
|
269nm |
AREA |
620252 |
612540 |
602649 |
611814 |
8823.95 |
1.44 |
|
|
RT |
5.693 |
5.68 |
5.687 |
6 |
0.01 |
0.11 |
||
|
NTP |
6020 |
6072 |
6158 |
6083 |
69.69 |
1.15 |
||
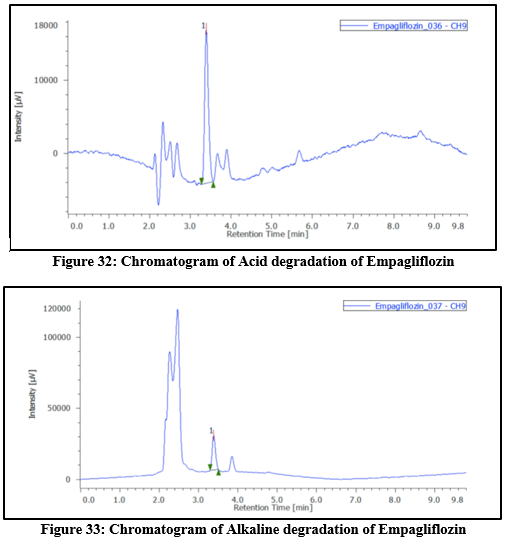
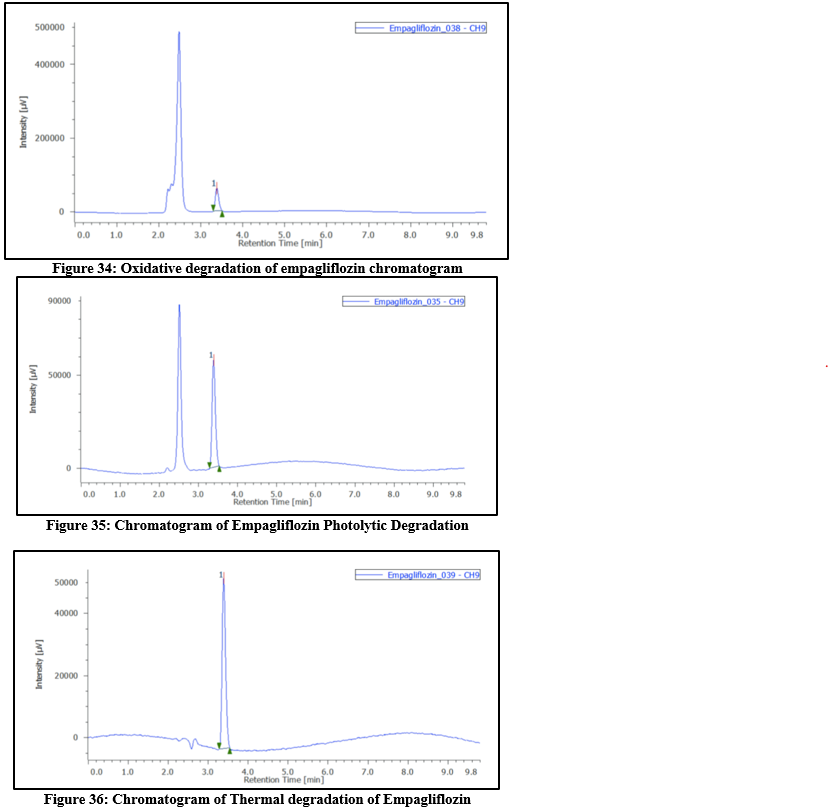
Table 10: Degradation study of Empagliflozin
|
Sr. No. |
Type |
Condition |
Time(hrs) |
Conc |
Area |
?gradation |
|
1 |
Acid |
1M HCL |
24 |
10 |
135910 |
0.43 |
|
2 |
Alkaline |
1M NaOH |
24 |
10 |
140194 |
0.41 |
|
3 |
Oxidative |
30% H2O2 |
24 |
10 |
349773 |
0.44 |
|
4 |
Thermal |
60oC |
2 |
10 |
331673 |
0.37 |
|
5 |
Photolytic |
UV Chamber |
2 |
10 |
340165 |
0.4 |
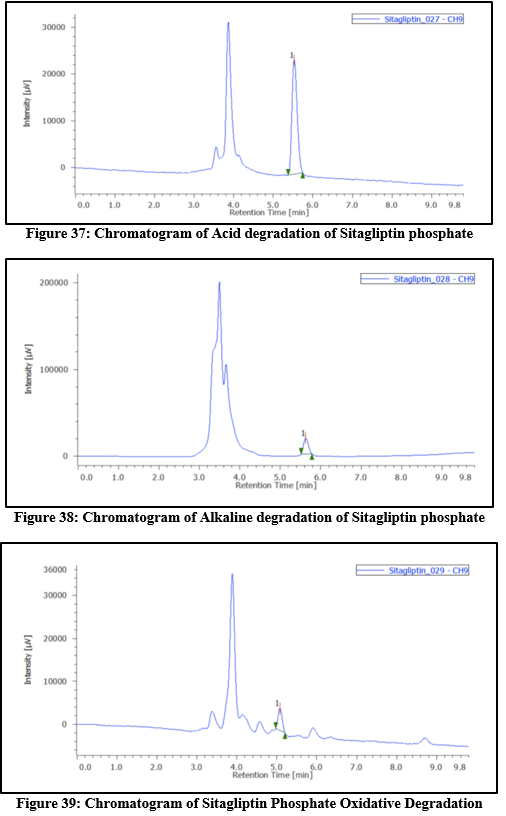
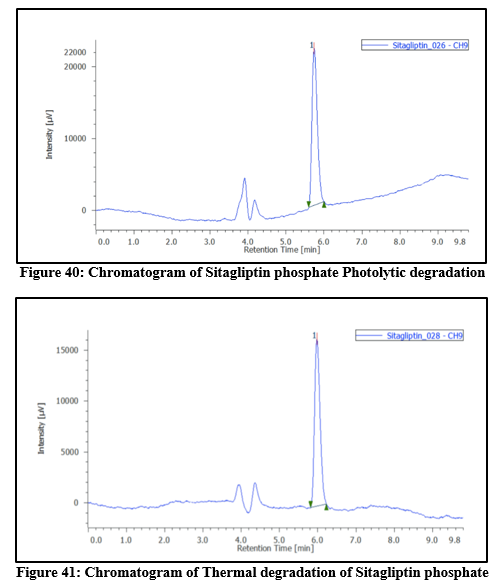
Table 11: Degradation study of Sitagliptin phosphate
|
Sr. No. |
Type |
Condition |
Time(hrs) |
Conc |
Area |
?gradation |
|
1 |
Acid |
1M HCL |
24 |
10 |
224130 |
0.04 |
|
2 |
Alkaline |
1M NaOH |
24 |
10 |
151560 |
0.29 |
|
3 |
Oxidative |
30% H2O2 |
24 |
10 |
36113 |
0.83 |
|
4 |
Thermal |
60oC |
2 |
10 |
163247 |
0.24 |
|
5 |
Photolytic |
UV Chamber |
2 |
10 |
213282 |
0.007 |
CONCLUSION
To estimate empagliflozin and sitagliptin phosphate simultaneously, a stability-indicating RP-HPLC method had been created and verified. As stated by ICH criteria, the approach was determined to be robust, specific, accurate, and exact. To evaluate the durability of the medications, stress degradation tests were conducted in alkaline, acidic, thermal, oxidative, and photolytic environments. The method successfully separated drugs from their degradation products, confirming its suitability as a stability-indicating technique. This technique is dependable for stability testing and routine quality control of empagliflozin and sitagliptin phosphate in pharmaceutical formulations. It is suitable for monitoring product quality and identifying degradation products throughout the drug’s shelf life.
REFERENCES


Mukesh Patil*, Achal Thakur, Ashish Jain, Stability Indicating Method Development and Validation, Stress Degradation Studies for Empagliflozin and Sitagliptin Phosphate by Using RP-HPLC, Int. J. of Pharm. Sci., 2024, Vol 2, Issue 12, 2017-2037. https://doi.org/10.5281/zenodo.14466172
 10.5281/zenodo.14466172
