
We use cookies to ensure our website works properly and to personalise your experience. Cookies policy
JIIU’s Ali-Allana College of Pharmacy Akkalkuwa, Dist: Nandurbar, 425 415. (M.S) India
The present study focuses on the optimization and validation of a simple, accurate, and precise Reverse Phase High-Performance Liquid Chromatographic (RP-HPLC) method for the quantification of betaxolol hydrochloride in bulk drug and nanoformulations. The chromatographic separation was achieved using a C18 column with a suitable mobile phase, maintaining an optimal flow rate and detection wavelength. The method was validated as per ICH guidelines for parameters including linearity, accuracy, precision, specificity, robustness, limit of detection (LOD), and limit of quantitation (LOQ). The method exhibited excellent linearity within the selected concentration range, with a correlation coefficient (R²) close to 1. Results indicated high recovery and low %RSD values, confirming the method's accuracy and precision. The developed RP-HPLC method is suitable for routine quality control and stability analysis of Betaxolol hydrochloride in both bulk drug and nanoformulation dosage form
Betaxolol hydrochloride is a cardio selective beta-adrenergic receptor blocking agent used in the treatment of hypertension and glaucoma. Betaxolol hydrochloride was approved by the US Food and Drug Administration (FDA) for the treatment of hypertension as 10 mg and 20 mg tablets for oral administration. The initial dose of betaxolol hydrochloride in hypertension is ordinarily 10 mg once daily, either alone or added to diuretic therapy. If the desired response is not achieved, the dose can be doubled after 7 to 14 days.1,2 Few methods have been reported for the quantitative determination of betaxolol hydrochloride in tablet formulations by high performance liquid chromatography (HPLC) and spectrophotometric procedures. These reported methods were not validated as per ICH guidance for specificity and forced degradation studies. Therefore, they are not suitable for the quantification of the betaxolol hydrochloride drug products. The proposed assay is able to separate betaxolol hydrochloride from tablet ingredients and from unknown degradation products within 10 minutes. This assay was validated according to the International Conference on Harmonization (ICH) guidelines.(10)
Fig No 1: Structure of Betaxolol Hydrochloride
Betaxolol hydrochloride, with the IUPAC name 1-[4-[2-(cyclopropylmethoxy) ethyl]phenoxy]-3-(propan-2-ylamino)propan-2-ol hydrochloride and CAS number 63659-19-8, is an odourless cardioselective beta-adrenergic antagonist. It lowers intraocular pressure and blood pressure by blocking beta receptors in the eye and heart. The drug has high bioavailability (90%), a half-life of 14–22 hours, and is absorbed in the small intestine. It's slightly water-soluble but dissolves better in organic solvents like methanol. It’s generally safe, though high doses may cause bradycardia or systemic toxicity. It's metabolized by the liver and primarily excreted through the kidneys. (1-10)
High-Performance Liquid Chromatography (HPLC)
High-Performance Liquid Chromatography, also known as High-Pressure Liquid Chromatography, is a type of column chromatography that is commonly used in biochemistry and analysis to separate, identify, and quantify active chemicals. It is a popular analytical technique for separating, identifying, and quantifying each element of a mixture. HPLC is a sophisticated column liquid chromatography technology. The solvent normally flows through the column due to gravity, but in the HPLC process, the solvent is pushed under high pressures of up to 400 atmospheres so that the sample can be separated into different constituents based on differences in relative affinities. HPLC generally comprises a column that contains packing material (stationary phase), a pump that drives the mobile phase(s) through the column, and a detector that detects the molecule retention times.(17_19)
RP-HPLC (Reversed-phase HPLC):
The stationary phase of RP-HPLC is non-polar, and the mobile phase is polar or moderately polar. The nation of hydrophobic interaction underpins RP-HPLC. The non-polar stationary phase will hold analytes that are comparatively less polar in a combination of components for a longer period than those that are substantially more polar.
MATERIAL AND METHOD
The Active Pharmaceutical Ingredient Betaxolol Hydrochloride API powder – 20 g is procured from Indoco Remedies. USDMF – 02530. Expiry- October 2027. Selection of Marketed nanoformulation: Nanoformulation of Betaxolol Hydrochloride. Betoptic S A marketed nanoformulation containing 0.25% of Betaxolol Hydrochloride is used for method development. It is a branded drug from Alcon limited. The list of drug chemical and instrument used in this this research are represented below table
Table 01. The list of drug and chemicals used in the study:
|
Drug/Chemical |
Grade |
Source/Manufacturer |
|
Betaxolol Hydrochloride |
USP |
Indoco Remedies |
|
Betoptics (0.25%) |
Nanoformulation Dosage form |
Tata 1 mg / FDC Ltd. |
|
Distilled Water |
AR Grade |
Research lab fine Chem industries |
|
Water for HPLC |
HPLC Grade |
Thermosil fine Chem industries |
|
Sodium Dihydrogen O- Phosphate |
AR Grade |
Thermosil fine Chem industries |
|
Sodium Mono-hydrogen O- Phosphate |
AR Grade |
Thermosil fine Chem industries |
|
HCl |
AR Grade |
Thermosil fine Chem industries |
|
NaOH Flakes |
AR Grade |
Thermosil fine Chem industries |
Selection of Instruments and Apparatus:
High performance liquid chromatography (HPLC) is selected as analytical method for the estimation and identification of Betaxolol Hydrochloride and nanoformulation as suspension.
Table 02. The list of instruments used in the study
|
Component |
Brand/model/software |
Manufacturer / supplier |
|
HPLC |
Agilent Tech. Gradient System with auto injector |
Agilent-Model 1100 |
|
Analytical Balance |
Shimadzu-1mg Sensitivity |
Shimadzu Kyoto Japan |
|
pH Meter |
Model EQ-610 |
Equiptronics, Mumbai, India |
|
Ultrasound Sonicator |
180 W - IEC Power Plug |
SV Electronics, Maharashtra, India |
|
UV-Visible |
Shimadzu 1800 |
Shimadzu |
RESULT AND DISCUSSION
Absorption Spectra of Betaxolol Hydrochloride:
The absorption spectrum of Betaxolol Hydrochloride was determined using methanol as a solvent. The sample was analysed using UV- Spectrophotometer at the wavelength range between 200nm – 400nm. The lambda (λ) max was found out at 226 nm Absorption Spectrum was indicate
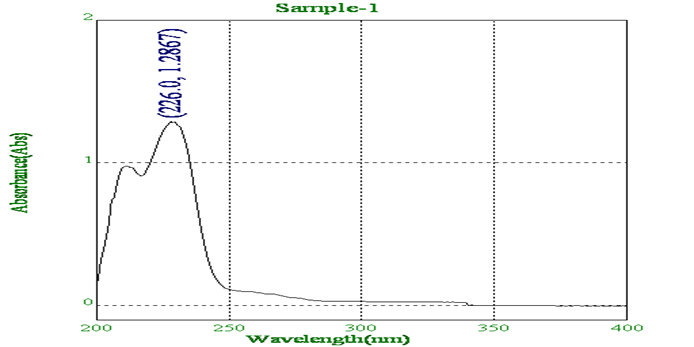
Fig No 02 Absorption spectra of Betaxolol Hydrochloride
Preparation of sample solution
Preparation of Betaxolol Hcl Standard Solutions
Stock Solution (Stock-I) Preparation:
An appropriate quantity of Betaxolol HCl was weighed and dissolved to obtain a concentration of 500µg/mL. The Betaxolol HCl was dissolved in methanol, and the volume was made up to 10 mL in a volumetric flask. This solution was labelled as Stock Solution-I (500 µg/mL Betaxolol HCl).
Preparation of Working Standard Solutions:
Preparation of 5 µg/mL Standard Solution:The 5 µg/mL standard solution was prepared by taking 0.1 mL of Stock-I (500 µg/mL) using a calibrated micropipette. This was transferred into a 10 mL volumetric flask, and the volume was made up to 10 mL with diluent. The solution was mixed well, achieving a final concentration of 5 µg/mL Betaxolol HCl.
Preparation of 10 µg/mL Standard Solution:
The 10 µg/mL standard solution was prepared by taking 0.2 mL of Stock-I (500 µg/mL) and transferring it into a 10 mL volumetric flask. The volume was made up to 10 mL with the mobile phase, and the solution was mixed well, achieving a final concentration of 10 µg/mL Betaxolol HCl.
Preparation of 15 µg/mL Standard Solution:
Similarly, the 15 µg/mL, 20 µg/mL, and 25 µg/mL standard solutions were prepared by taking 0.3 mL, 0.4 mL, and 0.5 mL of Stock-I (500 µg/mL), respectively. Each was transferred into a 10 mL volumetric flask, made up to 10 mL with the mobile phase, and mixed well to ensure uniformity
Preparation of 20 µg/mL Standard Solution:
For Suspension Sample Solution Preparation (Stock-II), 5 grams of ALCON BETOPTIC S 0.25% Eye Suspension was accurately weighed and transferred into a 10 mL volumetric flask. Sufficient methanol was added to dissolve the contents, followed by sonication or vortexing to ensure complete extraction of Betaxolol HCl. The volume was made up to 10 mL with methanol, mixed thoroughly, and labelled as Suspension Stock Solution II. The prepared solution was estimated to contain 500 µg/mL Betaxolol HCl
Preparation of 25 µg/mL Standard Solution
For Suspension Sample Solution Preparation (Stock-II), 5 grams of ALCON BETOPTIC S 0.25% Eye Suspension was accurately weighed and transferred into a 10 mL volumetric flask. Sufficient methanol was added to dissolve the contents, followed by sonication or vortexing to ensure complete extraction of Betaxolol HCl. The volume was made up to 10 mL with methanol, mixed thoroughly, and labelled as Suspension Stock Solution II. The prepared solution was estimated to contain 500 µg/mL Betaxolol HCl
Suspension Sample Solution Preparation (Stock-II)
To prepare a stock solution from the commercial ophthalmic suspension (ALCON BETOPTIC 0.25%) for use in assay of Betaxolol Hcl accuracy validation
Procedure:
5g ALCON BETOPTICS 0.25% Eye Suspension were accurately weighed into a 10 mL volumetric flask. Sufficient methanol was added to dissolve or disperse the contents. The mixture was sonicated or vortexed thoroughly to ensure complete extraction of Betaxolol HCl. The volume was then made up to 10 mL with methanol. The solution was mixed well to ensure homogeneity and labeled as Suspension Stock Solution II. The prepared solution was assumed to contain Betaxolol HCl at a concentration of 500 µg/mL
Assay Solution Preparation
To prepare a 20 µg/mL solution from Stock-II for the assay of Betaxolol Hcl.
Procedure:
Accuracy Solution Preparation
To assess the accuracy of the analytical method by performing recovery studies at 80%, 100%, and 120% levels of the target concentration (5 µg/mL), using Suspension Stock-II and corresponding standard solutions.
Preparation of 10 µg/mL Solution from Stock-II
Preparation of Accuracy Levels
For accuracy solution preparation, recovery studies were conducted at 80%, 100%, and 120% of the target concentration (5 µg/mL). The 10 µg/mL solution from Stock-II was prepared by pipetting 0.2 mL of Suspension Stock-II (500 µg/mL) into a 10 mL volumetric flask, making up the volume to 10 mL with diluent, and mixing well.
For accuracy level preparations:
The 80% accuracy level (4 µg/mL) was prepared by adding 0.1 mL of Suspension Stock-II, 0.08 mL of 4 µg/mL Betaxolol standard solution, and making up the volume to 10 mL with diluent, followed by thorough mixing.
The 100% accuracy level (5 µg/mL) was prepared similarly with 0.1 mL of Suspension Stock-II and 0.1 mL of 5 µg/mL Betaxolol standard solution, with the final volume adjusted to 10 mL.
The 120% accuracy level (6 µg/mL) was prepared by adding 0.1 mL of Suspension Stock-II, 0.12 mL of 6 µg/mL Betaxolol standard solution, and adjusting the volume to 10 mL before mixing thoroughly
Optimized chromatographic condition
Validation of Analytical Method for Betaxolol Hydrochloride
Analytical method validation is a crucial process that ensures the reliability, precision, and accuracy of the method used for determining the concentration of Betaxolol Hydrochloride in pharmaceutical formulations. The validation parameters include linearity, range, limit of detection (LOD), limit of quantification (LOQ), precision, specificity, assay, accuracy, and robustness.
1. Linearity
A standard stock solution of Betaxolol Hydrochloride was prepared at a concentration of 1000 μg/mL in methanol. From this stock solution, a secondary solution of 100 μg/mL was prepared. This solution was used to generate a range of six different concentrations to assess linearity. Linearity, which represents the relationship between peak area and concentration, was evaluated by analysing five different concentrations of Betaxolol Hydrochloride over the range of 5-25 μg/mL. A linear regression analysis was performed, and the correlation coefficient (r²) was calculated to determine the linearity of the method.
2. Range:
The range of an analytical method is defined as the interval between the upper and lower concentration levels of the analyte that have been successfully validated with precision, accuracy, and linearity. In this study, the validated concentration range for Betaxolol Hydrochloride was found to be 5-25 μg/mL.
3. Limit of Detection (LOD) and Limit of Quantification (LOQ)
Limit of Detection (LOD):
According to ICH guidelines, the LOD represents the lowest quantity of Betaxolol Hydrochloride that can be detected by the analytical method but cannot be quantified precisely. The formula used to calculate LOD is:
LOD = 3.3σ / S
where:
Limit of Quantification (LOQ):
The LOQ represents the lowest amount of Betaxolol Hydrochloride that can be quantified accurately and precisely. The formula used to calculate LOQ is:
LOQ = 10σ / S
where:
σ = Standard deviation of the Y-intercept
S = Slope of the calibration curve
4. Precision:
Precision was evaluated by performing intraday and interday variation studies to assess the reproducibility of the method.
Intraday Precision: Three different concentrations of Betaxolol Hydrochloride were analysed within a single day, and the % RSD (Relative Standard Deviation) was calculated.
Interday Precision: The same three concentrations were analysed over three consecutive days, and the % RSD values were determined to evaluate day-to-day reproducibility.
5. Specificity
Method specificity was confirmed by peak purity profiling studies. The peak purity values were found to be greater than 997, indicating that no interference occurred from degradation products, impurities, or matrix effects, ensuring that the analytical method selectively detects Betaxolol Hydrochloride.
6. Assay
The assay was performed using a nanoemulsion containing Betaxolol Hydrochloride. A stock solution was prepared by dissolving 2.5 g of the marketed formulation in 10 mL of methanol, resulting in a concentration of 1000 μg/mL (Stock II). A 20 μg/mL sample was prepared by taking 0.2 mL of this solution and diluting it to 10 mL with solvent. This sample solution was injected into the analytical system, and the peak area was recorded. The concentration and percentage purity were calculated using the linear regression equation.
7. Accuracy
To determine the accuracy of the method, recovery studies were conducted by spiking a known amount of standard Betaxolol Hydrochloride into the sample solution at three different concentration levels: 80%, 100%, and 120%.
The base concentration of the sample solution was 5 μg/mL of Betaxolol Hydrochloride. The percent recovery was determined using the linear regression equation, confirming the method’s accuracy.
8. Robustness
The robustness of the analytical method was evaluated by introducing variations in mobile phase composition, detection wavelength, and flow rate. The impact of these changes on peak area was studied to assess the method's stability under slight modifications.
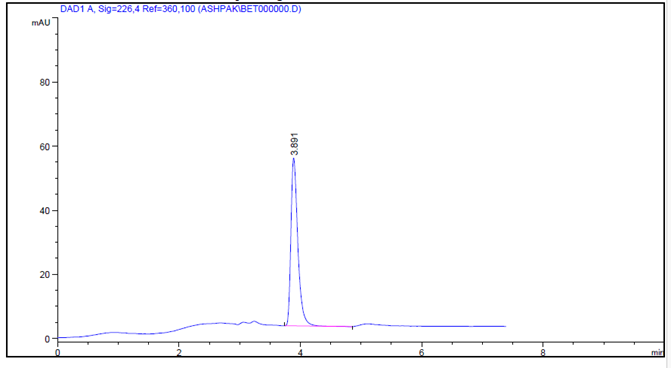
Fig No 03- optimized chromatographic condition
Table No 03: Linearity data for betaxolol hydrochloride
|
Method |
Conc. µg/ml |
Peak area (µV.sec) |
Average peak area (µV.sec) |
S.D. of Peak Area |
% RSD of Peak Area |
|
|
1 |
2 |
|||||
|
RP-HPLC Method |
5 |
213 |
211.69 |
212.3450 |
0.93 |
0.44 |
|
10 |
449.67 |
452.8 |
451.2350 |
2.21 |
0.49 |
|
|
15 |
692.39 |
694.04 |
693.2150 |
1.17 |
0.17 |
|
|
20 |
952.61 |
955.4 |
954.0050 |
1.97 |
0.21 |
|
|
25 |
1203.41 |
1207.85 |
1205.6300 |
3.14 |
0.26 |
|
|
|
Equation |
y = 49.78x-43.51 |
||||
|
R2 |
0.9997 |
|||||
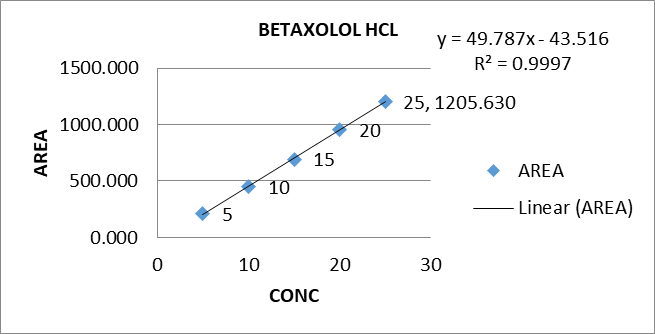
Fig. no 04: Calibration curve of Betaxolol hydrochloride
Table No.04. Result of Recovery data for Betaxolol Hcl
|
METHOD |
Drug |
Level (%) |
Amt. taken (μg/ml |
Amt. Added (μg/ml |
Area Mean* ± S.D. |
Amt. recovered Mean *±S.D. |
%Recovery Mean *± S.D. |
|
RP-HPLC Method |
BHCL |
80% |
5 |
4 |
9.00±0.025 |
4.00±0.025 |
99.88±0.62 |
|
100% |
5 |
5 |
0.99±0.037 |
4.99±0.037 |
99.72±0.74 |
||
|
120% |
5 |
6 |
10.97±0.039 |
5.97±0.039 |
99.52±0.65 |
Table No. 05: Result of Intraday and Inter Day Precision Studies On RP-HPLC
|
METHOD |
Drug |
Concn (µg/ml) |
Intraday Precision |
Interday Precision |
||
|
Mean± SD |
%Amt Found |
Mean± SD |
%Amt Found |
|||
|
RP- HPLC METHOD |
BHCL |
10 |
452.35±1.92 |
99.61 |
453.10± 2.64 |
99.76 |
|
15 |
714.67±0.78 |
101.54 |
710.47±1.57 |
100.97 |
||
|
20 |
955.69±1.04 |
100.36 |
954.46±0.96 |
100.24 |
||
Table No. 06: Repeatability studies on RP-HPLC for Betaxolol Hcl
|
Method |
Concentration of Betaxalol Hcl (mg/ml) |
Peak area |
Amount found (mg) |
% Amount found |
|
RP- HPLC Method For BHCL |
10 |
450.91 |
10.08 |
100.08 |
|
10 |
450.91 |
|||
|
|
Mean |
10.08 |
100.08 |
|
|
SD |
5.35 |
|||
|
% RSD |
1.18 |
|||
Table No. 07 Result of Robustness Study of Betaxolol Hcl
|
Parameters |
Conc.(µg/ml) |
Amount of detected(mean ±SD) |
%RSD |
|
Chromatogram of comp change 64 Meoh +36WATER |
10 |
448.83±2.16 |
0.48 |
|
Chromatogram of comp change 66 MEOH + 34 Water |
10 |
445.83±0.45 |
0.10 |
|
Chromatogram of comp change wavelength change 225 nm |
10 |
466.2±0.88 |
0.19 |
|
Chromatogram of comp change wavelength change 227 nm |
10 |
425.33±1.24 |
0.29 |
6. Limit of Detection
The LOD is the lowest limit that can be detected. Based on the S.D. deviation of the response and the slope the limit of detection (LOD) may be expressed as
LOD = 3.3 (SD)/S
Where, SD = Standard deviation of Y intercept S = Slope
Limit of detection = 3.3 X 43.51/49.78 = 2.884451(μg/mL)
The LOD of Betaxalol Hcl was found to be 2.884451 (μg/mL) analytical method that concluded
8. Limit of Quantification
The LOQ is the lowest concentration that can be quantitatively measured. Based on the S.D. deviation of the response and the slope,
The quantitation limit (LOQ) may be expressed as:
LOQ = 10 (SD)/ S
Where, SD = Standard deviation Y intercept
S = Slope
Limit of Quantitation = 10 X43.51 /49.78 =8.740458 (μg/mL)
The LOQ of Betaxolol Hcl was found to be 8.740458 (μg/mL), analytical method that concluded.
Statistical data analysis (DOE)
Optimization Data Analysis Preliminary experiments were performed by using Taguchi screening Method to identify the critical factors and to set their levels (maximum and minimum) for the experimental design. In this step The following parameters were investigated: selection of a chromatographic Column (C8 and C18), column temperature, mobile phase (ratio of MEOH :buffer), concentration of the buffer if present In the mobile phase, buffer ph, injection volume, mode of flow (isocratic/gradient) as well as determining the ideal flow rate. Based on the results obtained from the Taguchi screening, multiple linear regression analysis (MLRA) was applied for the studied Design using Design Expert® software version 13.0 to fit the full second-order polynomial equations with added Interaction terms. The method chosen to optimize separation of Betaxolol hydrochloride with the shortest analysis time was Full Factorial Design (FFD) with two replicates at the centre point (middle level). The independent variables were investigated and their low, Medium, and high levels described in Table below the QbD trials. The evaluated Responses (dependent variables) were the no. Of theoretical plates (Y1), assay (Y2), and tailing factor (Y3). Prediction of the optimum Composition was carried out using overlay plotting, brute Force method, and numeric approach of desirability function. Overlay Plot (i.e., combined contour plot) option in the software was Also embarked upon to locate the optimum composition. Within This optimal area, an optimum chromatographic condition was located by trading off different responses. The prognosis of the Optimum analytical condition was also conducted using numerical Optimization technique/with help of Design Expert software. The Full Factorial Design Validation Fifteen runs were done, selected from grid search data, prepared as per the chosen composition(s), and evaluated for the critical Quality attributes (CQA), viz. Number of theoretical Plates (TP), Assay, and tailing factor (TF). The predicted and observed Responses were compared, and linear correlation plots were constructed Percent bias (error) was calculated with respect to the Observed responses and the residual plots were also constructed For TP, assay, and TF.
Table. 08: Transaction factor levels for FFD response
|
Levels |
Methanol |
Flow rate |
|
-1 |
59 |
0.8 |
|
0 |
60 |
0.9 |
|
+1 |
61 |
1. |
The layout of actual design of DOE with the subsequent response results are shown in table no.09as given below,
Table No- 09: Layout of Actual Design of DOE
|
|
|
|
Factor 1 |
Factor 2 |
Response 1 |
Response 2 |
Response 3 |
Response 4 |
|
Std |
ID |
Run |
A:Methanol |
B:Flow Rate |
RT |
PA |
TP |
TF |
|
|
|
|
% |
min |
MIN |
A |
n |
r |
|
6 |
9 |
1 |
65 |
0.8 |
3.891 |
415.165 |
6057 |
0.61 |
|
2 |
3 |
2 |
60 |
0.9 |
5.693 |
442.796 |
6656 |
0.58 |
|
1 |
1 |
3 |
60 |
0.7 |
5.693 |
442.796 |
6656 |
0.58 |
|
5 |
8 |
4 |
65 |
0.9 |
3.574 |
294.405 |
1074 |
0.62 |
|
7 |
9 |
5 |
65 |
0.8 |
3.891 |
415.165 |
6057 |
0.61 |
|
9 |
9 |
6 |
65 |
0.8 |
3.891 |
415.165 |
6057 |
0.61 |
|
10 |
9 |
7 |
65 |
0.8 |
3.891 |
415.165 |
6057 |
0.61 |
|
4 |
7 |
8 |
65 |
0.7 |
5.693 |
442.796 |
6656 |
0.58 |
|
3 |
4 |
9 |
70 |
0.9 |
5.693 |
442.796 |
6656 |
0.58 |
|
8 |
9 |
10 |
65 |
0.8 |
3.891 |
415.165 |
6057 |
0.61 |
Layout of Actual Design of DOE of Betaxolol hydrochloride
ANOVA for response surface Quadratic model
The analysis of variance (ANOVA) was performed to identify the significant and insignificant factors. The results of ANOVA for the retention time of DOE are as following Table no.09
Table No- 10: ANOVA table for retention time
|
Source |
Sum of Squares |
df |
Mean Square |
F-value |
p-value |
|
Model |
8.34 |
5 |
1.67 |
|
|
|
A-Methanol |
1.12 |
1 |
1.12 |
|
|
|
B-Flow Rate |
2.25 |
1 |
2.25 |
|
|
|
AB |
1.12 |
1 |
1.12 |
|
|
|
A² |
2.99 |
1 |
2.99 |
|
|
|
B² |
0.7876 |
1 |
0.7876 |
|
|
|
Pure Error |
0.0000 |
4 |
0.0000 |
|
|
|
Cor Total |
8.34 |
9 |
|
|
|
Factor coding is Coded.Sum of squares is Type III – Partial
P-values less than 0.0500 indicate model terms are significant. In this case there are no significant model terms. Values greater than 0.1000 indicate the model terms are not significant. If there are many insignificant model terms (not counting those required to support hierarchy), model reduction may improve your model.
Table No:11 Fit Statistics
|
Std. Dev. |
0.0000 |
R² |
1.0000 |
|
Mean |
4.58 |
Adjusted R² |
1.0000 |
|
C.V. % |
0.0000 |
Predicted R² |
NA?¹? |
|
|
|
Adeq Precision |
NA?¹? |
?¹? Case(s) with leverage of 1.0000: Pred R² and PRESS statistic not defined
Table No 12: Coefficients in Terms of Coded Factors
|
Factor |
Coefficient Estimate |
df |
Standard Error |
95% CI Low |
95% CI High |
VIF |
|
Intercept |
3.89 |
1 |
|
|
|
|
|
A-Methanol |
1.06 |
1 |
|
|
|
2.90 |
|
B-Flow Rate |
-1.06 |
1 |
|
|
|
2.45 |
|
AB |
-1.06 |
1 |
|
|
|
2.90 |
|
A² |
2.12 |
1 |
|
|
|
3.15 |
|
B² |
0.7425 |
1 |
|
|
|
1.75 |
The coefficient estimate represents the expected change in response per unit change in factor value when all remaining factors are held constant. The intercept in an orthogonal design is the overall average response of all the runs. The coefficients are adjustments around that average based on the factor settings. When the factors are orthogonal the VIFs are 1; VIFs greater than 1 indicate multi-colinearity, the higher the VIF the more severe the correlation of factors. As a rough rule, VIFs less than 10 are tolerable
Factor Coding: Actual
RT (MIN)

3.574

X1 = A
X2 = B
3D Surface
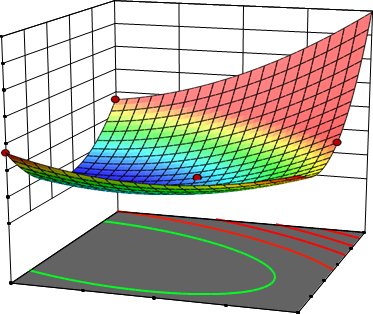
B: Flow Rate (min) 0.7 60 A: Methanol (%)
Fig.05: 3 D Predicted Vs Actual for DOE of RT of Betaxolol hydrochloride against Mobile phase and Flow rate
The Cubic model is aliased. ANOVA for Quadratic model
Response 2: PA
The Model F-value of 104855667745.92 implies the model is significant. There is only a 0.01% chance that an F-value this large could occur due to noise.
P-values less than 0.0500 indicate model terms are significant. In this case A, B, AB, A², B² are significant model terms. Values greater than 0.1000 indicate the model terms are not significant. If there are many insignificant model terms (not counting those required to support hierarchy), model reduction may improve your model
Table No: 14 Fit Statistics
|
Std. Dev. |
0.0002 |
R² |
1.0000 |
|
Mean |
414.14 |
Adjusted R² |
1.0000 |
|
C.V. % |
0.0000 |
Predicted R² |
NA?¹? |
|
|
|
Adeq Precision |
NA?¹? |
?¹? Case(s) with leverage of 1.0000: Pred R² and PRESS statistic not defined.
The Predicted R² of NA is in reasonable agreement with the Adjusted R²1.0000 of; i.e. the difference is less than 0.2. Adeq Precision measures the signal to noise ratio. A ratio greater than 4 is desirable. Your ratio of 11.675 indicates an adequate signal. This model can be used to navigate the design space.
Final Equation in Terms of Coded Factors
PA=+5061.20+60.90A-83.55B-713.93AB-779.95B2
The equation in terms of coded factors can be used to make predictions about the response for given levels of each factor. By default, the high levels of the factors are coded as +1 and the low levels are coded as -1. The coded equation is useful for identifying the relative impact of the factors by comparing the factor coefficients
Fig.06: 3 D Predicted Vs Actual for DOE of PA of Betaxolol hydrochloride against Mobile phase and Flow rate.
Table No:15 Response 3: TP
|
Source |
Sum of Squares |
df |
Mean Square |
F-value |
p-value |
|
Model |
2.560E+07 |
5 |
5.119E+06 |
|
|
|
A-Methanol |
7.790E+06 |
1 |
7.790E+06 |
|
|
|
B-Flow Rate |
1.558E+07 |
1 |
1.558E+07 |
|
|
|
AB |
7.790E+06 |
1 |
7.790E+06 |
|
|
|
A² |
2.077E+07 |
1 |
2.077E+07 |
|
|
|
B² |
6.864E+06 |
1 |
6.864E+06 |
|
|
|
Pure Error |
0.0000 |
4 |
0.0000 |
|
|
|
Cor Total |
2.560E+07 |
9 |
|
|
|
Factor coding is Coded .Sum of squares is Type III - Partial
P-values less than 0.0500 indicate model terms are significant. In this case there are no significant model terms. Values greater than 0.1000 indicate the model terms are not significant. If there are many insignificant model terms (not counting those required to support hierarchy), model reduction may improve your model.
Table No 16: Fit Statistics
|
Std. Dev. |
0.0000 |
R² |
1.0000 |
|
Mean |
5798.30 |
Adjusted R² |
1.0000 |
|
C.V. % |
0.0000 |
Predicted R² |
NA?¹? |
|
|
|
Adeq Precision |
NA?¹? |
?¹? Case(s) with leverage of 1.0000: Pred R² and PRESS statistic not defined

1074

X1 = A 20
X2 = B

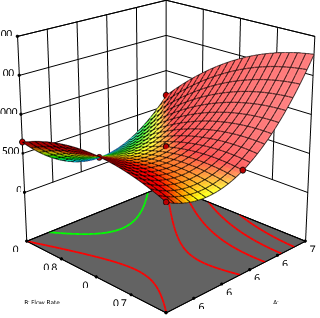
Fig.07: 3 D Predicted Vs Actual for DOE of TP of betaxolol hydrochloride against Mobile phase and Flow rate
Table No 18: Sequential Model Sum of Squares [Type I]
Response 4: TF
|
Source |
Sum of Squares |
df |
Mean Square |
F-value |
p-value |
|
|
Mean vs Total |
3.59 |
1 |
3.59 |
|
|
|
|
Linear vs Mean |
0.0002 |
2 |
0.0001 |
0.2515 |
0.7844 |
|
|
2FI vs Linear |
0.0002 |
1 |
0.0002 |
0.6771 |
0.4421 |
|
|
Quadratic vs 2FI |
0.0021 |
2 |
0.0010 |
|
|
Suggested |
|
Cubic vs Quadratic |
0.0000 |
0 |
|
|
|
Aliased |
|
Residual |
0.0000 |
4 |
0.0000 |
|
|
|
|
Total |
3.59 |
10 |
0.3590 |
|
|
|
Select the highest order polynomial where the additional terms are significant and the model is not aliased.
Table No 19: Fit Summary
Response 4: TF
|
Source |
Sequential p-value |
Lack of Fit p-value |
Adjusted R² |
Predicted R² |
|
|
Linear |
0.7844 |
|
-0.1995 |
-3.1634 |
|
|
2FI |
0.4421 |
|
-0.2575 |
|
|
|
Quadratic |
|
|
1.0000 |
|
Suggestd |
|
Cubic |
|
|
|
|
Aliased |
Factor Coding: Actual
TF (r)

Design Points
0.58

0.62
X1 = A X2 = B
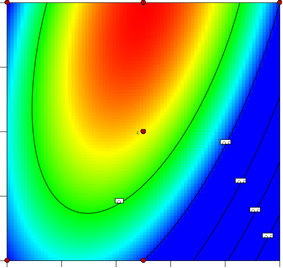
Fig.08: Contour plot for TF of Betaxolol hydrochloride against Mobile phase and Flow rate
A: Methanol (%
Factor Coding: Actual
TF (r)

Design Points
0.58

0.62
X1 = A 0
X2 = B
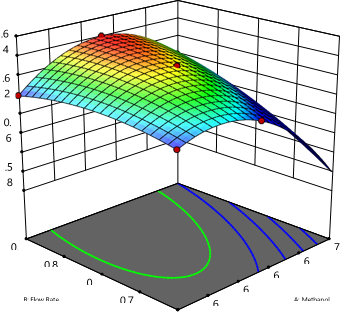
Fig.09 : 3 D Predicted Vs Actual for DOE of TF of Betaxolol hydrochloride against Mobile phase and Flow rate.
CONCLUSION
The organoleptic and physical properties of Betaxolol Hydrochloride were evaluated in accordance with pharmacopeial standards. The sample appeared as a white, odorless, crystalline powder with a smooth texture. Its melting point, determined by the capillary tube method, was 202.5?°C—well within the standard reference range of 200–203?°C—confirming the drug’s identity and purity. UV-spectrophotometric analysis in methanol showed a maximum absorption at 226?nm, further affirming its spectral characteristics. Chromatographic conditions were optimized using various methanol and 0.05% orthophosphoric acid mixtures. A 65:35 methanol-to-acid ratio produced sharp, symmetrical peaks and high column efficiency. Final RP-HPLC conditions included a Waters C18 column, 0.8?mL/min flow rate, 226?nm detection wavelength, and 15-minute runtime. Central Composite Design was used to optimize method parameters, revealing that methanol concentration significantly influenced retention time, while peak area and tailing factor remained stable. The method demonstrated excellent linearity (5–25?µg/mL), precision, and accuracy. Recovery studies at 80%, 100%, and 120% levels showed results within 98–102%, and robustness testing under slight procedural variations showed minimal impact on results. The validated method reliably quantified Betaxolol Hydrochloride in commercial nanoformulations, showing 100% content with ~0.09% RSD, proving it suitable for quality control and regulatory applications
CONFLICT OF INTEREST
The authors declare that there are no conflicts of interest regarding this investigation.
ACKNOWLEDGMENTS
The authors express their sincere gratitude to the Principal JIIU’s Ali-Allana College of Pharmacy, Akkalkuwa, for providing access to valuable literature and reference materials that supported this review work.
REFERENCES

Sk Ashpak Sk Harun, Aejaz Ahmed Abdul Rafique, Gulam Javed Khan, Shakeer Ahmad Shayaque Ahmad, Optimization And Validation of RP HPLC Method for The Quantification of Betaxolol Hydrochloride in Bulk Drug and Nanoformulation, Int. J. of Pharm. Sci., 2025, Vol 3, Issue 6, 5799-5815. https://doi.org/10.5281/zenodo.15771383
 10.5281/zenodo.15771383