

We use cookies to ensure our website works properly and to personalise your experience. Cookies policy
Institute of Pharmacy, Harish Chandra Post Graduate College, Bawan beegha, Varanasi.
Introduction: Inflammation is a protective biological response that may contribute to tissue damage when excessive or persistent. Medicinal plants containing bioactive phytoconstituents are being investigated for their potential anti-inflammatory applications. This study aimed to formulate and evaluate Murraya paniculata leaf extract ointments for preliminary in-vitro anti-inflammatory activity. Methods: The leaves of M. paniculata were extracted using 70% ethanol by Soxhlet extraction. The concentrated extract was subjected to preliminary phytochemical screening, UV–Visible spectroscopy, and Fourier-transform infrared (FTIR) spectroscopy. Five ointment formulations (F1–F5) containing 2%, 4%, 6%, 8%, and 10% w/w extract were prepared using white soft paraffin and anhydrous lanolin. The formulations were evaluated for appearance, homogeneity, consistency, apparent pH, spreadability, extrudability, washability, and phase separation. Selected physicochemical parameters were monitored during 90 days of storage at 25°C. Preliminary in-vitro anti-inflammatory activity was assessed using the bovine serum albumin (BSA) protein denaturation assay, with diclofenac sodium as the reference standard. Results: The extraction process yielded 14% w/w concentrated extract. Preliminary phytochemical screening indicated the presence of alkaloids, flavonoids, phenolic compounds, tannins, glycosides, proteins, amino acids, and carbohydrates. All five formulations exhibited a smooth semisolid appearance and uniform macroscopic characteristics. Apparent pH values ranged from 5.10 to 5.80, and spreadability values ranged from 25 to 60 g·cm/s. In the BSA protein denaturation assay, the reported percentage inhibition ranged from 71.30% to 82.02%. Formulation F5, containing 10% w/w extract, showed the highest reported inhibition (82.02%), compared with 88.27% for diclofenac sodium. Conclusion: The findings demonstrate the incorporation of M. paniculata leaf extract into an ointment base and indicate preliminary activity in the BSA protein denaturation assay. Further studies are required to verify the assay results and establish formulation optimization, dermal safety, stability, and therapeutic efficacy.
Inflammation is a complex biological response of vascularized tissues to infection, tissue injury, chemical irritation, and other harmful stimuli. It plays an essential role in host defense by promoting the elimination of injurious agents, removal of damaged cellular components, and initiation of tissue repair. However, excessive or persistent inflammation may result in tissue damage and contribute to various inflammatory disorders, including inflammatory skin conditions and musculoskeletal diseases. The inflammatory response is regulated by several mediators, including histamine, prostaglandins, leukotrienes, tumor necrosis factor-α (TNF-α), interleukin-1β (IL-1β), and interleukin-6 (IL-6). Dysregulation of inflammatory pathways, such as nuclear factor-kappa B (NF-κB) and mitogen-activated protein kinase (MAPK), may further contribute to the persistence of inflammation.
Conventional anti-inflammatory agents, particularly non-steroidal anti-inflammatory drugs (NSAIDs) and corticosteroids, are widely used to control inflammatory symptoms. NSAIDs primarily inhibit cyclooxygenase enzymes and reduce prostaglandin synthesis, whereas corticosteroids suppress multiple inflammatory pathways through glucocorticoid receptor-mediated mechanisms. Despite their therapeutic benefits, these agents may produce adverse effects depending on the drug, route of administration, dose, and duration of treatment. Topical administration offers an approach for delivering therapeutic agents directly to localized inflammatory sites, potentially reducing systemic exposure. Nevertheless, the effectiveness of topical preparations depends on formulation characteristics, drug release, skin penetration, stability, and local tolerability.
Medicinal plants have attracted considerable research interest as potential sources of biologically active compounds. Phytoconstituents such as flavonoids, phenolic compounds, alkaloids, coumarins, and terpenoids have been investigated for their antioxidant and inflammation-modulating properties. However, the pharmacological potential of a plant preparation depends on its botanical identity, phytochemical composition, extraction method, concentration, and experimental conditions. Consequently, botanical authentication, appropriate extraction, phytochemical characterization, formulation development, and systematic biological evaluation are important steps in investigating plant-derived anti-inflammatory preparations.
Murraya paniculata (L.) Jack, commonly known as orange jasmine or mock orange, belongs to the family Rutaceae. It is an evergreen aromatic shrub or small tree that has attracted interest in medicinal plant research because of its diverse secondary metabolites and reported biological activities. Different phytochemical classes associated with this plant may provide a basis for investigating its potential antioxidant and anti-inflammatory properties. Nevertheless, biological activity cannot be assumed solely from the presence of phytochemicals or traditional use; the activity of a particular extract and its formulated preparation requires appropriate experimental validation.
Ointments are semisolid topical dosage forms that provide direct application to the skin and may prolong contact between the preparation and the application site. Incorporating a plant extract into a suitable ointment base can facilitate its application and provide a practical dosage form for investigating localized therapeutic activity. The quality and performance of a herbal ointment depend on extract–base compatibility, homogeneity, consistency, spreadability, pH, stability, and the release characteristics of its constituents. Appropriate evaluation is therefore necessary to determine whether the formulation possesses suitable physicochemical properties and acceptable topical characteristics.
In view of these considerations, the present study focuses on the formulation and evaluation of Murraya paniculata ointment for anti-inflammatory activity. The investigation aims to assess the relevant physicochemical properties of the formulated ointment and evaluate its anti-inflammatory potential using the experimental methods actually performed in the study. The findings may contribute to the formulation-level understanding of M. paniculata as a potential source for topical anti-inflammatory preparations and provide a basis for further pharmacological and formulation research.
2. MATERIALS AND METHODS
2.1. Plant Material, Chemicals and Reagents
Leaves of Murraya paniculata (L.) Jack were used as the plant material for the preparation of the herbal extract. The leaves served as the source of phytoconstituents investigated for their potential anti-inflammatory activity. Ethanol (70% v/v) was used as the extraction solvent to obtain the hydroethanolic leaf extract.
White soft paraffin and anhydrous lanolin were selected as the excipients for the preparation of the topical ointment formulations. White soft paraffin served as the principal semisolid vehicle, whereas anhydrous lanolin was incorporated as a supporting base component to provide emollient properties and contribute to the consistency of the preparation.
Bovine serum albumin (BSA) was used as the test protein in the in-vitro protein denaturation assay. Diclofenac sodium was selected as the reference standard for comparison of anti-inflammatory activity. Distilled water, phosphate buffer (pH 6.4), preliminary phytochemical screening reagents, and other assay-related reagents were used as required for the respective experimental procedures.
Table 1. Materials, Chemicals, Reagents and Their Functions
|
Sr. No. |
Material or reagent |
Specification |
Purpose |
|
1 |
Murraya paniculata leaves |
Selected plant material |
Source of herbal extract |
|
2 |
Ethanol |
70% v/v |
Extraction of plant constituents |
|
3 |
Distilled water |
Laboratory grade |
Washing and preparation of solutions |
|
4 |
White soft paraffin |
Ointment-grade base |
Principal semisolid vehicle |
|
5 |
Anhydrous lanolin |
Ointment-base excipient |
Supporting base component |
|
6 |
Bovine serum albumin |
1% w/v solution for assay |
Test protein in the denaturation assay |
|
7 |
Diclofenac sodium |
Reference standard |
Comparative anti-inflammatory evaluation |
|
8 |
Phosphate buffer |
pH 6.4 |
Maintenance of assay conditions |
|
9 |
Phytochemical screening reagents |
Appropriate for individual tests |
Qualitative detection of phytochemical groups |
2.2. Instruments and Equipment
The instruments and laboratory equipment used or specified for the experimental work included an analytical balance, hot-air oven, Soxhlet extraction apparatus, heating mantle, rotary evaporator, UV–Visible spectrophotometer, pH meter, water bath, micropipettes, analytical glassware, and suitable sample containers.
The analytical balance was used for weighing plant powder, extract, and formulation ingredients. The hot-air oven was used for drying the leaves, while the Soxhlet apparatus and heating mantle were used during extraction. A rotary evaporator was used to concentrate the collected extract. The UV–Visible spectrophotometer was used for spectroscopic characterization and absorbance measurement during the BSA assay. A pH meter was used to measure the apparent pH of the ointment dispersions.
Table 2. Instruments and Equipment Used in the Study
|
Sr. No. |
Instrument/equipment |
Reported make or specification |
Application |
|
1 |
Analytical balance |
Shimadzu, AU series |
Accurate weighing of materials |
|
2 |
Hot-air oven |
Remi |
Drying of plant material |
|
3 |
Soxhlet extraction apparatus |
Borosil glass apparatus |
Extraction of plant constituents |
|
4 |
Heating mantle |
Remi |
Heating during extraction |
|
5 |
Rotary evaporator |
Superfit, ROTA VAP series |
Concentration of the extract |
|
6 |
UV–Visible spectrophotometer |
Shimadzu, UV-1800 or equivalent |
Spectroscopic analysis and BSA assay |
|
7 |
pH meter |
Elico |
Measurement of apparent pH |
|
8 |
Water bath |
Remi |
Temperature-controlled procedures |
|
9 |
Micropipettes |
Eppendorf |
Accurate liquid transfer |
|
10 |
Analytical glassware |
Borosil |
Preparation and handling of solutions |
|
11 |
Cuvettes |
Thermo Scientific |
Absorbance measurements |
|
12 |
Thermometer |
Laboratory-grade |
Temperature monitoring |
2.3. Preparation of Murraya paniculata Leaf Powder
Fresh leaves of Murraya paniculata were washed thoroughly with distilled water to remove adhering dust and surface impurities. The washed leaves were dried in a hot-air oven at 40°C for 12 hours until a constant weight was obtained. Drying was performed before powdering to facilitate subsequent extraction and handling of the plant material.
The dried leaves were ground into a fine powder using a mortar and pestle. The resulting powder was passed through a 40-mesh sieve, corresponding to an approximate aperture of 425 µm, to obtain a relatively uniform particle size. The prepared powder was transferred to a clean, dry, airtight container and protected from light and moisture until extraction.
Uniform particle size is relevant to extraction because it influences the contact between the plant material and the extraction solvent. The preparation and storage of the powdered leaves were therefore carried out before the Soxhlet extraction procedure.
2.4. Extraction of Murraya paniculata Leaves
2.4.1. Selection of Extraction Solvent
Ethanol at a concentration of 70% v/v was selected as the extraction solvent. This hydroethanolic solvent system was used to extract constituents from the powdered leaves of Murraya paniculata. A volume of 500 mL of 70% ethanol was used for the extraction of 50 g of powdered plant material.
2.4.2. Soxhlet Extraction Procedure
A quantity of 50 g of the prepared Murraya paniculata leaf powder was placed in the Soxhlet extraction apparatus. A total of 500 mL of 70% ethanol was used as the extraction solvent. The apparatus was assembled with the extraction chamber, condenser, and solvent-containing flask.
The extraction was carried out for 6 hours at a reported temperature of 95°C, with eight extraction cycles. During Soxhlet extraction, the heated solvent evaporates and subsequently condenses in the condenser. The condensed solvent passes through the plant material, facilitating the transfer of solvent-soluble constituents into the extraction chamber. Once the solvent reaches the siphon level, the extract-containing solvent returns to the boiling flask, allowing the extraction process to continue.
After completion of the extraction, the extract-containing solution was collected for concentration. The procedure was used to obtain the hydroethanolic extract for subsequent characterization and incorporation into the ointment formulations.
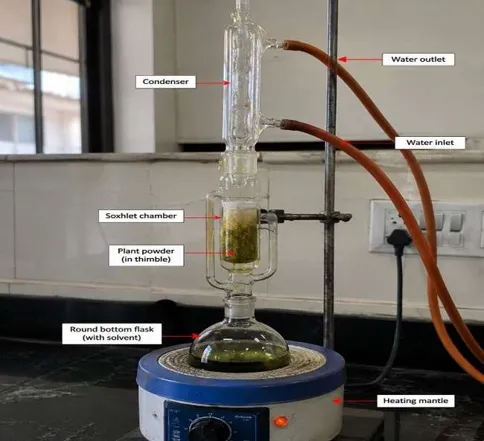
Figure 1. Schematic Representation of Soxhlet Extraction of Murraya paniculata Leaf Powder Using 70% Ethanol
2.4.3. Concentration and Storage of Extract
The collected extract solution was concentrated using a rotary evaporator to remove the extraction solvent and obtain the concentrated plant extract. The concentrated extract was transferred to an airtight container and stored at room temperature until further use in the formulation process.
The extract was used as the herbal active ingredient in the preparation of ointment formulations containing different extract concentrations.
2.4.4. Determination of Percentage Yield
The percentage yield of the Murraya paniculata leaf extract was calculated using the following formula:
Percentage Yield (%) = [Weight of Extract Obtained (g) / Weight of Plant Powder Used (g)] × 100
Substituting the experimental values:
Percentage Yield (%) = (7 g / 50 g) × 100
Percentage Yield = 14% w/w
Therefore, the percentage yield of the Murraya paniculata leaf extract was 14% w/w.
Table 3. Extraction Parameters and Percentage Yield of Murraya paniculata Leaf Extract
|
Parameter |
Experimental value |
|
Plant material |
Murraya paniculata leaves |
|
Weight of powdered leaves |
50 g |
|
Extraction solvent |
Ethanol, 70% v/v |
|
Solvent volume |
500 mL |
|
Extraction method |
Soxhlet extraction |
|
Extraction duration |
6 hours |
|
Reported extraction temperature |
95°C |
|
Number of extraction cycles |
8 |
|
Concentration method |
Rotary evaporation |
|
Weight of concentrated extract |
7 g |
|
Percentage yield |
14% w/w |
2.5. UV–Visible Spectroscopic Characterization of the Leaf Extract
UV–Visible spectroscopic analysis was performed to characterize the ultraviolet and visible light absorption properties of the dried ethanolic extract of Murraya paniculata. The analysis was intended to provide preliminary information about the UV-absorbing constituents present in the extract.
The dried extract was dissolved in a suitable solvent to prepare the sample solution. The corresponding solvent was used as a blank to establish the baseline. The sample was scanned using a UV–Visible spectrophotometer over a wavelength range of 200–800 nm, and the resulting absorption spectrum was recorded.
The wavelength corresponding to maximum absorption ((\lambda_{\max})) was identified from the recorded spectrum. The absorption characteristics were considered for preliminary characterization of chromophoric constituents, including compounds containing aromatic structures.
UV–Visible spectroscopy provides information about absorption characteristics but does not, by itself, establish the identity or concentration of individual phytoconstituents. The interpretation of the spectrum should therefore be considered alongside other characterization findings.
2.6. Fourier Transform Infrared (FTIR) Spectroscopic Analysis
Fourier transform infrared (FTIR) spectroscopy was performed to investigate the functional groups potentially present in the dried ethanolic leaf extract of Murraya paniculata. The technique is based on the absorption of infrared radiation by molecular bonds, producing characteristic vibrational bands associated with different functional groups.
The dried extract was prepared using a sample preparation procedure compatible with the available FTIR instrument. The infrared spectrum was recorded over the selected wavenumber range, and the major absorption bands were identified from the spectrum. The observed peaks were examined with reference to characteristic infrared absorption ranges to determine possible functional-group assignments.
The interpretation focused on characteristic absorption bands associated with hydroxyl (O–H) stretching, aliphatic C–H stretching, carbonyl (C=O) stretching, aromatic C=C stretching, C–O stretching, and aromatic C–H bending, wherever supported by the recorded spectrum. The resulting assignments were used for preliminary chemical characterization of the plant extract.
FTIR analysis provides information about the functional groups present in a sample but cannot independently establish the identity of individual phytoconstituents. Therefore, the spectral interpretation was considered supportive of the preliminary characterization of the extract.
2.7. Preliminary Phytochemical Screening
Preliminary phytochemical screening was performed to investigate the major classes of secondary metabolites present in the ethanolic leaf extract of Murraya paniculata. Qualitative chemical tests were selected according to the characteristic reactions associated with individual phytochemical groups. The observations were interpreted based on the reactions recorded during laboratory testing.
2.7.1. Test for Alkaloids
Dragendorff’s test was used for the preliminary detection of alkaloids. The extract was subjected to the selected test procedure, and the reaction mixture was examined for the formation of an orange or reddish-brown precipitate, which is generally considered a positive indication of alkaloids.
2.7.2. Test for Flavonoids
The Shinoda test was used for the preliminary detection of flavonoids. The development of a pink, red, or magenta colour was considered a characteristic positive reaction. The observed colour change was recorded for interpretation.
2.7.3. Test for Phenolic Compounds and Tannins
The ferric chloride test was used to assess the presence of phenolic compounds and tannins. The development of blue, green, or violet coloration was considered indicative of phenolic compounds, whereas blue-black or greenish-black coloration was considered a possible indication of tannins.
2.7.4. Test for Terpenoids
The Salkowski test was selected for the preliminary detection of terpenoids. The reaction mixture was examined for reddish-brown coloration at the interface of the reaction layers. The observed reaction was recorded and interpreted according to the characteristic response of the test.
2.7.5. Test for Saponins
The foam test was used for the preliminary assessment of saponins. The sample was examined for the formation of persistent froth or foam following the selected test procedure. Persistent foam was considered a positive indication, subject to the specified test conditions.
2.7.6. Test for Proteins and Amino Acids
The Biuret test was used for the preliminary detection of proteins, whereas the ninhydrin test was used to assess amino acids. Violet or purple coloration in the Biuret reaction was considered a positive indication of peptide bonds. The ninhydrin reaction was examined for characteristic colour development, commonly purple or blue for many amino acids.
2.7.7. Test for Carbohydrates
Molisch’s test was selected for the qualitative detection of carbohydrates. The reaction mixture was examined for the formation of a violet ring at the interface, which is generally considered a positive indication of carbohydrates.
2.7.8. Interpretation of Phytochemical Screening
The observations obtained from the individual qualitative tests were recorded and interpreted according to their characteristic reactions. A positive reaction was represented by (+), while an uncertain or inconclusive reaction was represented by (±), in accordance with the original experimental recording. Glycosides require a suitable group-specific test, and the exact test and corresponding observation should be reported only if documented in the laboratory records.
Table 4. Qualitative Phytochemical Tests and Characteristic Positive Reactions
|
Sr. No. |
Phytochemical group |
Test performed |
Characteristic positive observation |
|
1 |
Alkaloids |
Dragendorff’s test |
Orange or reddish-brown precipitate |
|
2 |
Flavonoids |
Shinoda test |
Pink, red, or magenta colour |
|
3 |
Phenolic compounds |
Ferric chloride test |
Blue, green, or violet coloration |
|
4 |
Tannins |
Ferric chloride test |
Blue-black or greenish-black coloration |
|
5 |
Terpenoids |
Salkowski test |
Reddish-brown coloration at the interface |
|
6 |
Saponins |
Foam test |
Persistent froth or foam |
|
7 |
Glycosides |
Group-specific test |
Depends on the test and glycoside class |
|
8 |
Proteins |
Biuret test |
Violet or purple coloration |
|
9 |
Amino acids |
Ninhydrin test |
Characteristic colour, commonly purple or blue |
|
10 |
Carbohydrates |
Molisch’s test |
Violet ring at the interface |
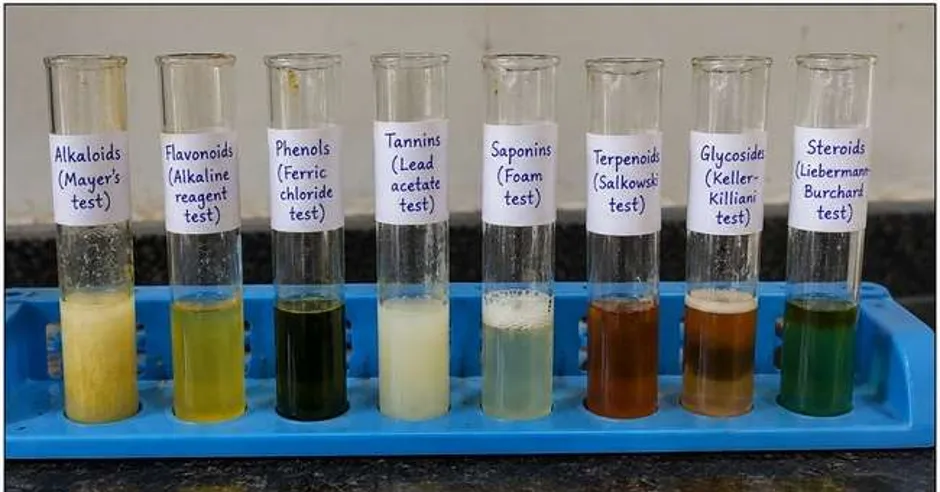
Figure 4. Preliminary Phytochemical Screening of Murraya paniculata Leaf Extract Using Qualitative Chemical Tests
2.8. Selection of Ointment Base and Excipients
White soft paraffin and anhydrous lanolin were selected as the base components for the development of Murraya paniculata ointment. The base components were chosen to obtain a semisolid preparation suitable for topical application.
White soft paraffin served as the principal vehicle and contributed to the consistency, lubrication, and protective film-forming properties of the formulation. Anhydrous lanolin was used as a supporting base component to contribute emollient properties and assist in obtaining a suitable semisolid consistency.
The quantities of the base components were adjusted according to the concentration of plant extract incorporated into each formulation. No additional preservatives, antioxidants, fragrances, or other excipients were included in the supplied formulation composition.
Table 5. Ointment Base Components and Their Functions
|
Ingredient |
Function in the formulation |
|
White soft paraffin |
Principal semisolid vehicle; provides consistency, lubrication, and protective film formation |
|
Anhydrous lanolin |
Supporting base component; contributes emollient properties |
|
Murraya paniculata leaf extract |
Herbal active ingredient investigated for potential anti-inflammatory activity |
2.9. Formulation of Murraya paniculata Ointment
Five ointment formulations, designated F1, F2, F3, F4, and F5, were prepared using different concentrations of the ethanolic leaf extract. The extract concentrations were 2%, 4%, 6%, 8%, and 10% w/w, respectively. Each formulation was prepared to a final batch weight of 100 g.
2.9.1. Preparation of the Ointment Base
The required quantities of white soft paraffin and anhydrous lanolin were weighed separately using a laboratory balance. The base components were transferred to a suitable glass beaker and heated using a controlled heating source or water bath. The reported preparation conditions were 60°C for 1 hour, with temperature monitoring using a thermometer.
The components were mixed until a uniform semisolid vehicle was obtained. The base was subsequently allowed to cool to room temperature before incorporation of the concentrated plant extract.
2.9.2. Incorporation of Plant Extract
The required quantity of concentrated Murraya paniculata leaf extract was weighed separately for each formulation. The extract was incorporated into the prepared base after the base had reached room temperature.
Mechanical stirring was used to distribute the extract throughout the semisolid vehicle. Mixing was continued until a visually uniform preparation was obtained. The amount of extract incorporated was increased progressively from F1 to F5, while the quantities of white soft paraffin and anhydrous lanolin were adjusted to maintain a final batch weight of 100 g.
2.9.3. Packaging and Storage
The prepared formulations were transferred into appropriately labelled glass containers corresponding to their formulation codes. The containers were used for storage and subsequent physicochemical evaluation. The formulations were stored at room temperature before testing.
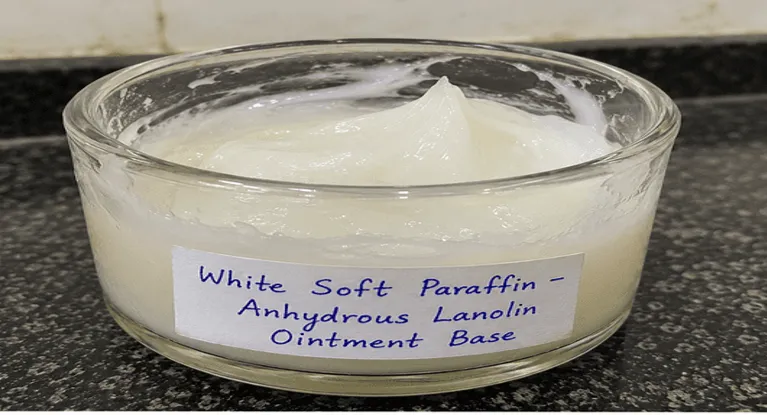
Figure 5. Schematic Representation of the Preparation of Murraya paniculata Ointment Formulations
2.10. Physicochemical Evaluation of Ointment Formulations
The physicochemical evaluation was performed to assess the physical characteristics and suitability of the prepared ointments for topical application. All five formulations, F1–F5, were examined for appearance, colour, homogeneity, consistency, apparent pH, spreadability, extrudability, washability, and phase separation.
2.10.1. Appearance and Colour
The appearance and colour of each formulation were evaluated by visual examination. The physical state, general appearance, and colour of each preparation were observed and recorded descriptively. The formulations were compared to identify visible differences associated with increasing extract concentration.
2.10.2. Homogeneity and Grittiness
Homogeneity was assessed by visual examination of the prepared ointments for uniformity of appearance and the presence of visible lumps or aggregates. Grittiness was assessed by examining the preparations for perceptible coarse particles that could affect the smoothness and acceptability of the ointment during application.
2.10.3. Consistency
The consistency of each formulation was assessed through visual and tactile examination. The preparations were compared according to their relative softness and firmness. The observations were recorded descriptively; no instrumental penetration or consistency measurement was reported.
2.10.4. Determination of Apparent pH
The apparent pH of the ointment formulations was measured using a pH meter with an aqueous dispersion of the preparation. The readings were recorded for F1–F5 and compared to identify differences among the formulations.
The apparent pH measurement was used to characterize the aqueous dispersion of each ointment. The exact ointment-to-water ratio and the number of replicate measurements were not available in the supplied experimental record and should be included only if documented.
2.10.5. Determination of Spreadability
Spreadability was evaluated using the glass-slide method to assess the ease with which each ointment could spread over a surface. A slide movement distance of 6 cm and an applied load of 50 g were used. The time required for separation of the slides was recorded for each formulation.
The following relationship was used for calculating spreadability:
S = (M × L) / T
Where:
S = Spreadability (g·cm/s)
M = Applied load (g)
L = Slide movement distance (cm)
T = Separation time (s)
The calculated spreadability values were used to compare the spreading characteristics of the different ointment formulations under the specified experimental conditions.
2.10.6. Evaluation of Extrudability
Extrudability was evaluated qualitatively to assess the ease of dispensing the ointment from its container. The observations were recorded for the individual formulations. Numerical extrusion-force measurements were not reported in the supplied experimental details.
2.10.7. Evaluation of Washability
Washability was assessed qualitatively to examine the ease of removing the ointment from the applied surface using the washing procedure employed in the study. The observations were recorded for each formulation. A quantitative washability method was not specified in the supplied experimental record.
2.10.8. Evaluation of Phase Separation
The formulations were examined visually for the separation of components. Each batch was assessed for visible phase separation, and the observation was recorded as either separation observed or separation not observed. The storage duration and conditions associated with this particular assessment should be reported separately if documented.
Table 6. Physicochemical Evaluation Parameters for Murraya paniculata Ointment
|
Parameter |
Evaluation method |
Purpose |
|
Appearance and colour |
Visual examination |
Assessment of general physical characteristics |
|
Homogeneity |
Visual examination |
Assessment of uniformity |
|
Grittiness |
Examination for coarse particles |
Assessment of smoothness |
|
Consistency |
Visual and tactile examination |
Comparison of relative firmness |
|
Apparent pH |
pH meter using aqueous dispersion |
Characterization of the dispersion's pH |
|
Spreadability |
Glass-slide method |
Assessment of spreading characteristics |
|
Extrudability |
Qualitative assessment |
Assessment of ease of dispensing |
|
Washability |
Qualitative assessment |
Assessment of ease of removal |
|
Phase separation |
Visual examination |
Assessment of visible physical separation |
2.11. Stability Study
A stability study was conducted to monitor changes in the physical characteristics of the prepared Murraya paniculata ointment formulations during storage. The formulations were stored in tightly closed glass containers at 25°C under normal laboratory light for a period of 90 days.
The stability assessment was conducted on Days 0, 15, 30, 60, and 90. The evaluation parameters included appearance, colour, homogeneity, grittiness, phase separation, odour, apparent pH, and spreadability. Visual examination was used to monitor physical changes, while apparent pH and spreadability were measured using the previously described methods.
The observations recorded at the different sampling intervals were compared to assess changes in the physical and selected physicochemical properties of the formulations during the storage period.
Table 7. Stability Study Schedule for Murraya paniculata Ointment Formulations
|
Evaluation parameter |
Day 0 |
Day 15 |
Day 30 |
Day 60 |
Day 90 |
|
Appearance and colour |
✓ |
✓ |
✓ |
✓ |
✓ |
|
Homogeneity |
✓ |
✓ |
✓ |
✓ |
✓ |
|
Grittiness |
✓ |
✓ |
✓ |
✓ |
✓ |
|
Phase separation |
✓ |
✓ |
✓ |
✓ |
✓ |
|
Odour |
✓ |
✓ |
✓ |
✓ |
✓ |
|
Apparent pH |
✓ |
✓ |
✓ |
✓ |
✓ |
|
Spreadability |
✓ |
✓ |
✓ |
✓ |
✓ |
2.12. In-vitro Anti-inflammatory Activity by BSA Protein Denaturation Assay
2.12.1. Principle of the Assay
The bovine serum albumin protein denaturation assay was used to evaluate the in-vitro anti-inflammatory potential of the formulated Murraya paniculata ointments. Protein denaturation involves changes in the native structure of a protein due to environmental factors such as heat. Inhibition of heat-induced protein denaturation is commonly used as a preliminary screening method for investigating potential anti-inflammatory activity.
In the present study, the test formulations were assessed under controlled incubation and heating conditions. Diclofenac sodium was used as the reference standard. Absorbance was measured at 660 nm using a UV–Visible spectrophotometer, and percentage inhibition was calculated by comparing the absorbance of each sample with that of the negative control.
2.12.2. Preparation of BSA Solution
A 1% w/v bovine serum albumin solution was used in the assay. Phosphate buffer at pH 6.4 was used to maintain the required assay conditions. The prepared BSA solution was handled carefully before the experimental procedure to minimize premature protein denaturation.
2.12.3. Preparation of Test Samples
The five prepared ointment formulations, F1–F5, containing 2%, 4%, 6%, 8%, and 10% w/w Murraya paniculata leaf extract, respectively, were selected as the test samples.
For the assay, the ointment samples were extracted or dispersed in a suitable solvent to obtain test preparations at the required concentration. A concentration of 200 µg/mL was used for the primary comparison. The exact extraction or dispersion solvent and sample preparation procedure were not specified in the supplied experimental record and should be reported according to the procedure actually performed.
2.12.4. Preparation of Controls and Reference Standard
A negative control containing the BSA reaction mixture without the test formulation or reference drug was included to provide the control absorbance. Diclofenac sodium was used as the reference standard for comparison. An ointment-base control containing white soft paraffin and anhydrous lanolin without the plant extract was included to assess the possible contribution of the base.
Sample blanks were included where applicable to account for absorbance arising from the test preparations themselves. The use and calculation of blank corrections should be described according to the actual laboratory procedure.
Table 8. Experimental Groups Included in the BSA Protein Denaturation Assay
|
Group |
Experimental material |
Purpose |
|
Negative control |
BSA reaction mixture without test formulation or reference drug |
Establishment of control absorbance |
|
Reference standard |
Diclofenac sodium |
Comparative anti-inflammatory evaluation |
|
Ointment-base control |
White soft paraffin and anhydrous lanolin without extract |
Assessment of the possible contribution of the base |
|
F1 |
Ointment containing 2% w/w extract |
Evaluation of protein denaturation inhibition |
|
F2 |
Ointment containing 4% w/w extract |
Evaluation of protein denaturation inhibition |
|
F3 |
Ointment containing 6% w/w extract |
Evaluation of protein denaturation inhibition |
|
F4 |
Ointment containing 8% w/w extract |
Evaluation of protein denaturation inhibition |
|
F5 |
Ointment containing 10% w/w extract |
Evaluation of protein denaturation inhibition |
|
Sample blanks |
Individual sample preparations, where applicable |
Assessment of sample-related absorbance |
2.12.5. Experimental Procedure
The BSA protein denaturation assay was performed according to the experimental conditions recorded for the study. The prepared BSA solution was used to prepare the reaction mixtures containing the individual test formulations. A separate reaction mixture containing diclofenac sodium was prepared as the reference standard. The negative control, ointment-base control, and sample blanks were included as applicable.
The reaction mixtures were incubated at 37°C for 20 minutes. Following incubation, the mixtures were heated at 70°C for 5 minutes to induce protein denaturation. After heating, the mixtures were handled consistently, and their absorbance was measured at 660 nm using a UV–Visible spectrophotometer.
The assay was reported to have been performed in triplicate ((n=3)). The individual absorbance readings should be retained for each formulation and control to permit verification of the mean values, variability, and calculated inhibition percentages.
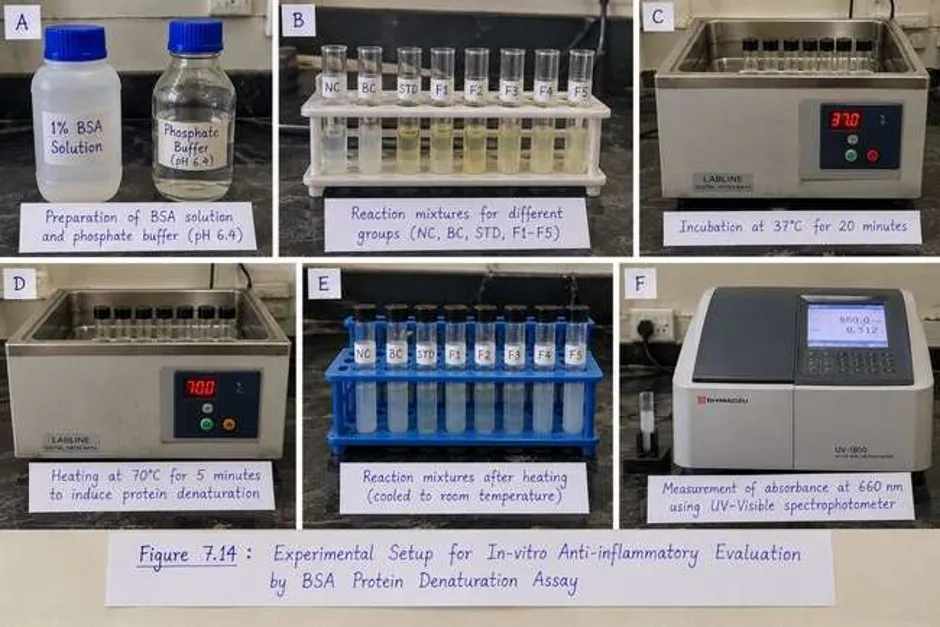
Figure 6. Experimental Workflow for In-vitro Anti-inflammatory Evaluation by the BSA Protein Denaturation Assay
2.12.6. UV–Visible Absorbance Measurement
The absorbance of the reaction mixtures was measured at 660 nm. The negative-control absorbance was used as the reference value for calculating the percentage inhibition of protein denaturation. The assay was reported to have been performed in triplicate.
The recorded negative-control readings were 1.10, 1.12, and 1.14. The mean absorbance was calculated as:
The percentage inhibition of protein denaturation was calculated using the following equation:
Inhibition (%) = [(Acontrol − Asample) / Acontrol] × 100
Where:
Acontrol = absorbance of the negative control.
Asample = absorbance of the test sample.
Calculation of Mean Absorbance of the Negative Control
The mean absorbance was calculated from three replicate readings as follows:
A₁ = 1.10, A₂ = 1.12, A₃ = 1.14
Mean absorbance = (A₁ + A₂ + A₃) / 3
= (1.10 + 1.12 + 1.14) / 3
= 3.36 / 3 = 1.12
Therefore, the mean absorbance of the negative control is 1.12.
Thus, the mean absorbance of the negative control was 1.12. The mean absorbance of each test formulation and the reference standard is required to calculate their respective percentage inhibition values.
2.13. Data Recording and Presentation
The physical observations and instrumental measurements obtained during formulation evaluation and stability assessment were recorded for the respective formulations and sampling intervals. The BSA assay was reported to have been performed in triplicate. The individual replicate measurements should be used to calculate the mean and standard deviation wherever numerical data are available.
Results should be presented in appropriately numbered tables and figures. Qualitative observations should be reported descriptively, while numerical findings should be presented with their units and, where supported by the experimental data, appropriate measures of variability.
3. RESULTS AND DISCUSSION
3.1. Extraction Yield of Murraya paniculata Leaf Extract
Soxhlet extraction of Murraya paniculata leaves using 70% ethanol yielded 7 g of concentrated extract from 50 g of powdered plant material. The calculated extraction yield was 14% w/w. The concentrated extract exhibited a dark green appearance.
Table 1. Extraction Parameters and Percentage Yield of Murraya paniculata Leaf Extract
|
Parameter |
Observation |
|
Plant material |
Murraya paniculata leaves |
|
Extraction method |
Soxhlet extraction |
|
Extraction solvent |
70% ethanol |
|
Solvent volume |
500 mL |
|
Extraction duration |
6 hours |
|
Reported extraction temperature |
95°C |
|
Number of extraction cycles |
8 |
|
Final extract weight |
7 g |
|
Physical appearance |
Dark green |
|
Percentage yield |
14% w/w |
The obtained yield represents the mass of concentrated extract relative to the initial mass of powdered leaves. The dark green colour was recorded as a physical characteristic of the extract. However, extraction yield and colour alone do not establish the identity or concentration of individual phytoconstituents. Further characterization was therefore undertaken using UV–Visible spectroscopy, FTIR spectroscopy, and preliminary phytochemical screening.
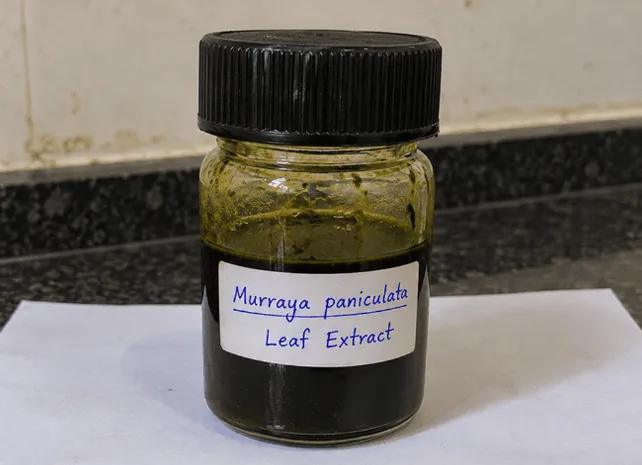
Figure 1. Photograph of the Prepared Murraya paniculata Leaf Extract
3.2. UV–Visible Spectroscopic Analysis
The dried ethanolic leaf extract was analysed over a wavelength range of 200–800 nm. The recorded absorption maximum ((\lambda_{\max})) was 270 nm.
Table 2. UV–Visible Spectral Characteristics of Murraya paniculata Leaf Extract
|
Parameter |
Observation |
|
Sample |
Dried ethanolic leaf extract |
|
Wavelength range |
200–800 nm |
|
Absorption maximum |
270 nm |
|
General interpretation |
Absorption by UV-absorbing chromophoric constituents |
The absorption maximum at 270 nm indicates the presence of constituents capable of absorbing ultraviolet radiation. Such absorption may be associated with aromatic or conjugated molecular structures. Nevertheless, the absorption maximum alone cannot identify specific compounds or establish their concentration. The spectrum provides preliminary analytical information that complements the other characterization findings.
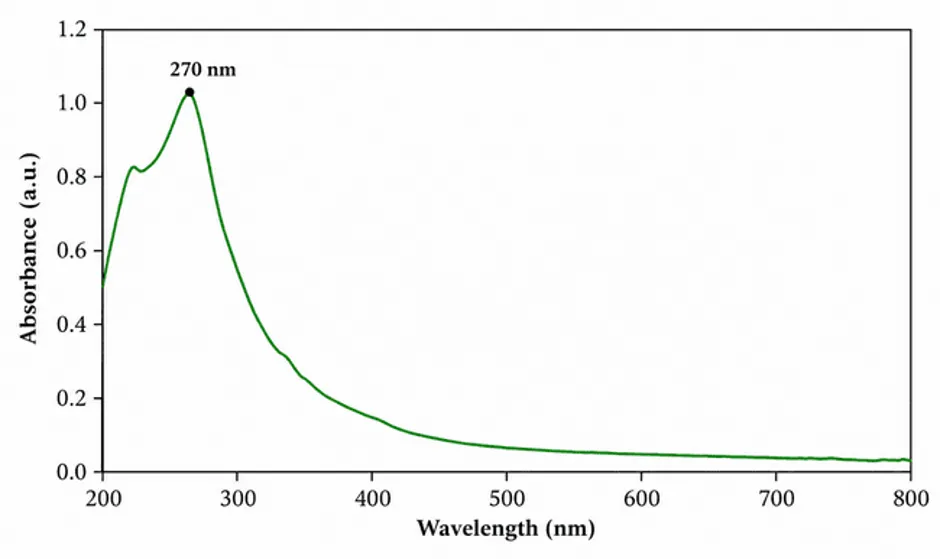
Figure 2. UV–Visible Absorption Spectrum of the Dried Ethanolic Extract of Murraya paniculata
3.3. FTIR Spectroscopic Analysis
FTIR spectroscopy was used to investigate the functional groups potentially present in the dried ethanolic leaf extract. The supplied spectral interpretation included characteristic wavenumber ranges associated with hydroxyl, aliphatic C–H, carbonyl, aromatic C=C, C–O, and aromatic C–H vibrations.
Table 3. FTIR Spectral Ranges and Possible Functional-Group Assignments
|
Wavenumber range (cm⁻¹) |
Possible functional group |
General interpretation |
|
3200–3600 |
O–H stretching |
May be associated with alcohols and phenolic compounds |
|
2850–3000 |
Aliphatic C–H stretching |
May indicate aliphatic groups |
|
1650–1750 |
C=O stretching |
May indicate carbonyl-containing compounds |
|
1500–1620 |
Aromatic C=C stretching |
May indicate aromatic structures |
|
1000–1300 |
C–O stretching |
May be associated with alcohols, ethers, and phenolic groups |
|
700–900 |
Aromatic C–H bending |
May indicate substituted aromatic rings |
These assignments suggest possible functional groups within the extract. However, the values provided are spectral ranges rather than individually measured peak positions. Consequently, they should be interpreted as possible functional-group assignments, not as confirmation of specific chemical constituents. Identification of individual compounds would require additional analytical evidence.
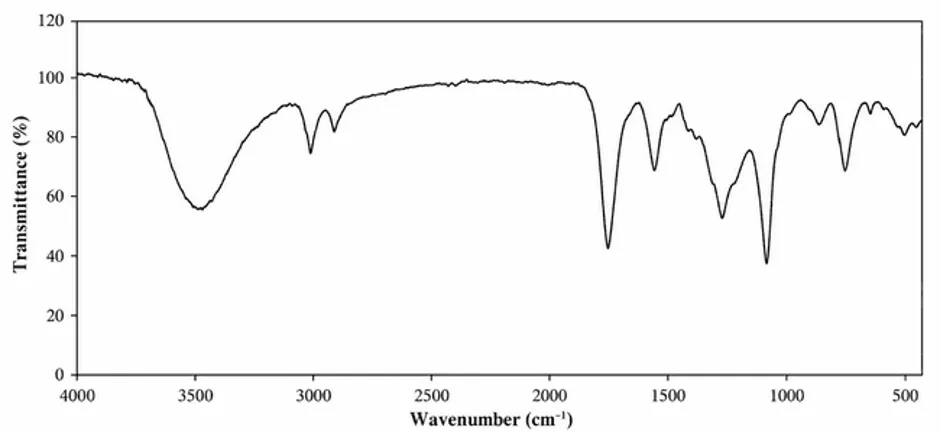
Figure 3. FTIR Spectrum of the Dried Ethanolic Extract of Murraya paniculata
3.4. Preliminary Phytochemical Screening
Preliminary phytochemical screening showed positive qualitative reactions for alkaloids, flavonoids, phenolic compounds, tannins, glycosides, proteins, amino acids, and carbohydrates. The reactions for terpenoids and saponins were recorded as uncertain or inconclusive.
Table 4. Preliminary Phytochemical Screening of Murraya paniculata Leaf Extract
|
Phytochemical group |
Test performed |
Result |
|
Alkaloids |
Dragendorff’s test |
+ |
|
Flavonoids |
Shinoda test |
+ |
|
Phenolic compounds |
Ferric chloride test |
+ |
|
Tannins |
Ferric chloride test |
+ |
|
Terpenoids |
Salkowski test |
± |
|
Saponins |
Foam test |
± |
|
Glycosides |
Group-specific test |
+ |
|
Proteins |
Biuret test |
+ |
|
Amino acids |
Ninhydrin test |
+ |
|
Carbohydrates |
Molisch’s test |
+ |
Note: (+) Positive reaction; (±) Uncertain or inconclusive reaction.
The screening results indicate a chemically diverse preliminary profile of the extract. The positive reactions for flavonoids, phenolic compounds, and tannins are relevant to further investigation because members of these compound classes have been studied for antioxidant and inflammation-modulating properties. However, qualitative screening does not establish the identity, quantity, or pharmacological contribution of individual constituents. The anti-inflammatory potential of the formulated ointment must therefore be interpreted separately using the results of the BSA protein denaturation assay.
3.5. Physical Characteristics of the Ointment Base and Formulations
The prepared white soft paraffin–anhydrous lanolin base exhibited a smooth, soft, semisolid appearance, with a white to off-white colour. The mixture appeared uniform, without visible lumps or perceptible grittiness. These observations supported its suitability for further evaluation as a vehicle for incorporating the plant extract.
Five ointment formulations containing 2%, 4%, 6%, 8%, and 10% w/w extract were prepared and designated F1–F5, respectively. Their colour varied from pale green in F1 to dark green in F4 and F5. All formulations exhibited a smooth, semisolid appearance and uniformity during the recorded visual assessment. No perceptible grittiness or visible phase separation was reported.
Table 5. Physical Characteristics of Murraya paniculata Ointment Formulations
|
Parameter |
F1 (2%) |
F2 (4%) |
F3 (6%) |
F4 (8%) |
F5 (10%) |
|
Colour |
Pale green |
Light green |
Green |
Dark green |
Dark green |
|
Appearance |
Smooth, semisolid |
Smooth, semisolid |
Smooth, semisolid |
Smooth, semisolid |
Smooth, semisolid |
|
Texture |
Smooth |
Smooth |
Smooth |
Smooth to slightly thick |
Slightly thick |
|
Homogeneity |
Uniform |
Uniform |
Uniform |
Uniform |
Uniform |
|
Consistency |
Soft |
Soft |
Soft to moderate |
Moderately firm |
Moderately firm |
|
Grittiness |
Not perceptible |
Not perceptible |
Not perceptible |
Not perceptible |
Not perceptible |
|
Phase separation |
Not observed |
Not observed |
Not observed |
Not observed |
Not observed |
The progressive change in colour was consistent with the increasing concentration of the green-coloured plant extract. F1 and F2 showed softer consistency, while F4 and F5 were comparatively firmer. These differences indicate that extract concentration was associated with changes in the observable physical characteristics of the preparations. Nevertheless, visual uniformity does not establish microscopic uniformity, chemical compatibility, skin safety, or long-term stability.
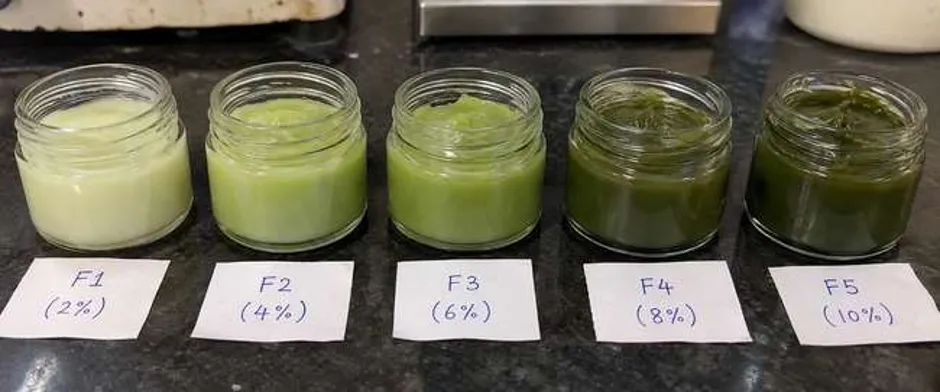
Figure 5. Photographs of Prepared Murraya paniculata Ointment Formulations F1–F5
3.6. Physicochemical Evaluation of Ointment Formulations
3.6.1. Apparent pH
The apparent pH values of the formulations ranged from 5.10 to 5.80. F4 showed the lowest recorded value, whereas F5 showed the highest.
Table 6. Apparent pH of Murraya paniculata Ointment Formulations
|
Formulation |
Extract concentration (% w/w) |
Apparent pH |
|
F1 |
2 |
5.15 |
|
F2 |
4 |
5.50 |
|
F3 |
6 |
5.30 |
|
F4 |
8 |
5.10 |
|
F5 |
10 |
5.80 |
The results demonstrated variation in apparent pH without a consistent increase or decrease with increasing extract concentration. These values describe the measured pH of the aqueous dispersions under the conditions used. They do not independently establish dermal safety or suitability, which would require appropriate supporting assessments.
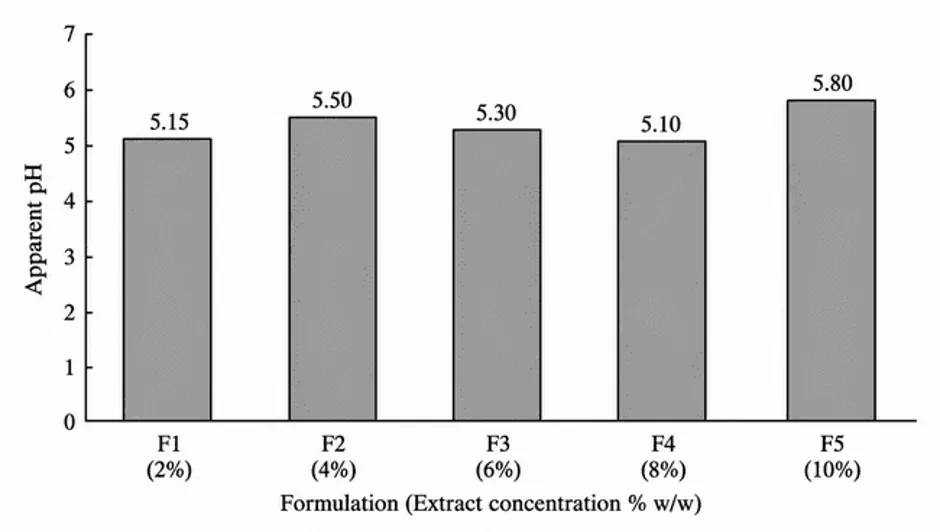
Figure 7.6: Comparison of Apparent pH Values of F1–F5 Ointment Formulations
3.6.2. Spreadability
Spreadability decreased progressively from F1 to F5. F1 exhibited the highest calculated value of 60 g·cm/s, while F5 showed the lowest value of 25 g·cm/s. The time required for slide separation increased from 5 seconds for F1 to 12 seconds for F5.
Table 7. Spreadability of Murraya paniculata Ointment Formulations
|
Formulation |
Extract concentration (% w/w) |
Separation time (s) |
Slide movement distance (cm) |
Applied load (g) |
Spreadability (g·cm/s) |
|
F1 |
2 |
5 |
6 |
50 |
60.0 |
|
F2 |
4 |
6 |
6 |
50 |
50.0 |
|
F3 |
6 |
8 |
6 |
50 |
37.5 |
|
F4 |
8 |
10 |
6 |
50 |
30.0 |
|
F5 |
10 |
12 |
6 |
50 |
25.0 |
The decrease in spreadability was consistent with the comparatively thicker texture and firmer consistency observed in F4 and F5. Under the specified test conditions, the higher-concentration formulations required more time for slide separation. Although F1 showed the greatest spreadability, this single parameter cannot establish the overall superiority of a formulation.
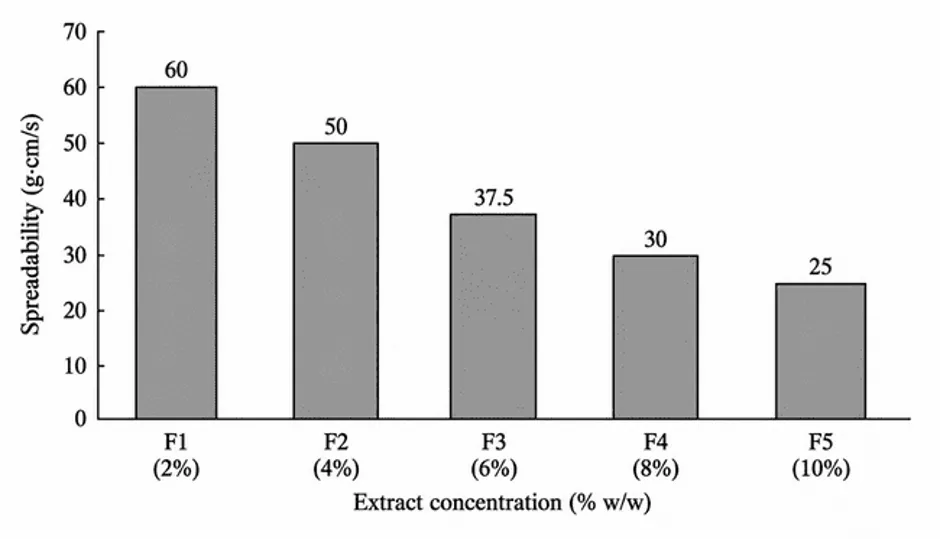
Figure 7.7: Effect of Extract Concentration on the Spreadability of Murraya paniculata Ointment Formulations
3.6.3. Extrudability, Washability, and Phase Separation
The qualitative extrudability ratings were good for F1 and F2, good to moderate for F3, and moderate for F4 and F5. Washability was rated as poor to moderate across all five formulations. No visible phase separation was observed during the recorded assessment.
The comparatively lower extrudability ratings of F4 and F5 were consistent with their firmer consistency. The washability observations suggest that removal with water was not rated as easy under the conditions used. Since the assessments were qualitative, the magnitude of these differences cannot be quantified.
Taken together, the physicochemical findings demonstrate differences in consistency, apparent pH, spreadability, and handling characteristics among F1–F5. The absence of visible phase separation during the initial assessment is encouraging as a physical observation but does not establish long-term stability.
3.7. Stability Evaluation
The formulations were stored in tightly closed glass containers at 25°C under normal laboratory light for 90 days. Assessments were conducted on Days 0, 15, 30, 60, and 90.
The qualitative observations indicated that colour, general appearance, homogeneity, and odour remained unchanged during the recorded storage period. Grittiness remained imperceptible, and visible phase separation was not observed. Small numerical variations in apparent pH and a gradual decrease in spreadability were recorded.
3.7.1. Changes in Spreadability During Storage
Table 8. Spreadability of Ointment Formulations During the 90-Day Stability Study
|
Formulation |
Day 0 |
Day 15 |
Day 30 |
Day 60 |
Day 90 |
|
F1 (2%) |
60.0 |
59.0 |
58.0 |
57.0 |
56.0 |
|
F2 (4%) |
50.0 |
49.0 |
48.0 |
47.0 |
46.0 |
|
F3 (6%) |
37.5 |
37.0 |
36.0 |
35.0 |
34.0 |
|
F4 (8%) |
30.0 |
29.5 |
29.0 |
28.0 |
27.0 |
|
F5 (10%) |
25.0 |
24.5 |
24.0 |
23.0 |
22.0 |
Values are reported in g·cm/s.
A gradual decrease in spreadability was recorded in every formulation during storage. From Day 0 to Day 90, the decreases were 4.0, 4.0, 3.5, 3.0, and 3.0 g·cm/s for F1, F2, F3, F4, and F5, respectively.
F1 retained the highest spreadability throughout the observation period, whereas F5 consistently exhibited the lowest. These results indicate changes in spreading behaviour during storage. However, spreadability data alone cannot establish the mechanism responsible for the changes.
3.7.2. Changes in Apparent pH During Storage
Table 9. Apparent pH of Ointment Formulations During the Stability Study
|
Formulation |
Day 0 |
Day 15 |
Day 30 |
Day 60 |
Day 90 |
|
F1 (2%) |
5.15 |
5.16 |
5.17 |
5.18 |
5.19 |
|
F2 (4%) |
5.50 |
5.49 |
5.50 |
5.51 |
5.52 |
|
F3 (6%) |
5.30 |
5.31 |
5.32 |
5.32 |
5.33 |
|
F4 (8%) |
5.10 |
5.11 |
5.12 |
5.13 |
5.14 |
|
F5 (10%) |
5.80 |
5.79 |
5.80 |
5.81 |
5.82 |
The recorded apparent pH values showed relatively small numerical variations during storage. The net changes between Day 0 and Day 90 were +0.04 for F1, +0.02 for F2, +0.03 for F3, +0.04 for F4, and +0.02 for F5.
These observations describe the recorded trends but do not establish statistical significance or chemical stability. Interpretation should take into account the availability of replicate measurements, measurement variability, and the precise pH measurement procedure.
Overall, the stability observations suggest that the formulations retained their recorded macroscopic characteristics during the 90-day assessment, although changes in spreadability and small variations in apparent pH occurred. The available findings support a description of physical behaviour under the specified storage conditions but are insufficient to establish comprehensive long-term stability.
3.8. In-vitro Anti-inflammatory Activity by BSA Protein Denaturation Assay
The in-vitro anti-inflammatory potential of the formulated ointments was evaluated using the BSA protein denaturation assay at a reported test concentration of 200 µg/mL. Absorbance was measured at 660 nm, and diclofenac sodium was used as the reference standard. The negative-control mean absorbance was reported as 1.12 ± 0.0166.
The reported absorbance values and percentage inhibition results are summarized in Table 10.
Table 10. BSA Protein Denaturation Assay Results at 200 µg/m
|
Experimental group |
Extract concentration (% w/w) |
Absorbance at 660 nm (mean ± SEM) |
Reported inhibition (%) |
|
Negative control |
— |
1.12 ± 0.0166 |
— |
|
F1 |
2 |
0.320 ± 0.005 |
71.30 |
|
F2 |
4 |
0.288 ± 0.013 |
74.22 |
|
F3 |
6 |
0.286 ± 0.010 |
74.43 |
|
F4 |
8 |
0.246 ± 0.003 |
78.00 |
|
F5 |
10 |
0.201 ± 0.002 |
82.02 |
|
Diclofenac sodium |
Reference standard |
0.131 ± 0.0033 |
88.27 |
The reported results showed a decrease in absorbance from F1 to F5, accompanied by an increase in the reported percentage inhibition. Among the five ointment formulations, F5 exhibited the lowest absorbance and the highest reported inhibition, at 82.02%. F1 showed the lowest reported inhibition, at 71.30%.
The reported inhibition increased with extract concentration across the tested formulations, although the difference between F2 and F3 was small. This pattern suggests a possible concentration-related trend in the inhibition of heat-induced BSA denaturation under the conditions of the assay.
3.8.1. Comparison with Diclofenac Sodium
Diclofenac sodium exhibited a reported inhibition of 88.27%, compared with 82.02% for F5. Thus, F5 showed the highest reported inhibition among F1–F5 but did not exceed the reference standard.
Table 11. Comparison of F5 with Diclofenac Sodium
|
Parameter |
F5 |
Diclofenac sodium |
|
Test concentration |
200 µg/mL |
200 µg/mL |
|
Absorbance at 660 nm (mean ± SEM) |
0.201 ± 0.002 |
0.131 ± 0.0033 |
|
Reported inhibition (%) |
82.02 |
88.27 |
|
Comparative finding |
Highest reported inhibition among F1–F5 |
Higher reported inhibition than F5 |
These findings indicate that the highest-concentration formulation exhibited the greatest reported inhibition among the tested ointments. However, the results do not establish equivalence to diclofenac sodium, clinical efficacy, or overall formulation superiority. Interpretation should also consider the ointment-base control, sample-blank correction, and the original replicate measurements.
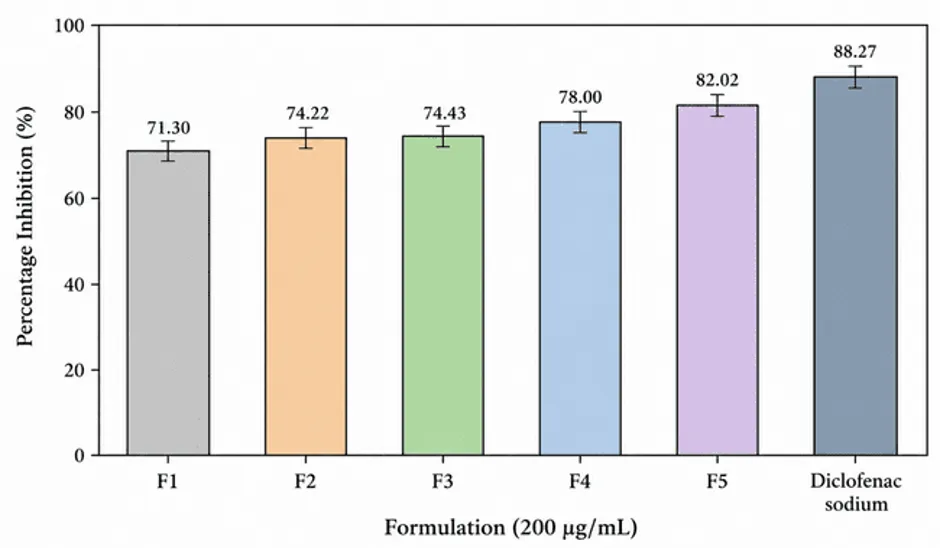
Figure 6. Comparison of Reported Percentage Inhibition in the BSA Protein Denaturation Assay
3.8.2 UV–Visible Absorbance Readings of Formulated Ointments
The UV–Visible spectrophotometric absorbance of the Murraya paniculata ointment formulations was recorded at 660 nm. The formulations contained 2%, 4%, 6%, 8%, and 10% w/w of the ethanolic plant extract. As presented in Table X, the mean absorbance values were 0.320 ± 0.005 for F1, 0.288 ± 0.013 for F2, 0.286 ± 0.010 for F3, 0.246 ± 0.003 for F4, and 0.201 ± 0.002 for F5.
A gradual decrease in absorbance was observed as the extract concentration increased, with F5 exhibiting the lowest absorbance and F1 the highest. These findings describe the recorded spectrophotometric response of the formulations under the stated measurement conditions. However, the absorbance readings alone do not establish the anti-inflammatory efficacy of the ointments; their interpretation depends on the analytical method, sample preparation, blank correction, and purpose of measurement.
Table 7.17: UV–Visible Spectrophotometric Readings of Murraya paniculata Ointment Formulations
|
Formulation |
Extract concentration (% w/w) |
Wavelength (nm) |
Mean absorbance ± SEM |
|
F1 |
2% |
660 |
0.320 ± 0.005 |
|
F2 |
4% |
660 |
0.288 ± 0.013 |
|
F3 |
6% |
660 |
0.286 ± 0.010 |
|
F4 |
8% |
660 |
0.246 ± 0.003 |
|
F5 |
10% |
660 |
0.201 ± 0.002* |
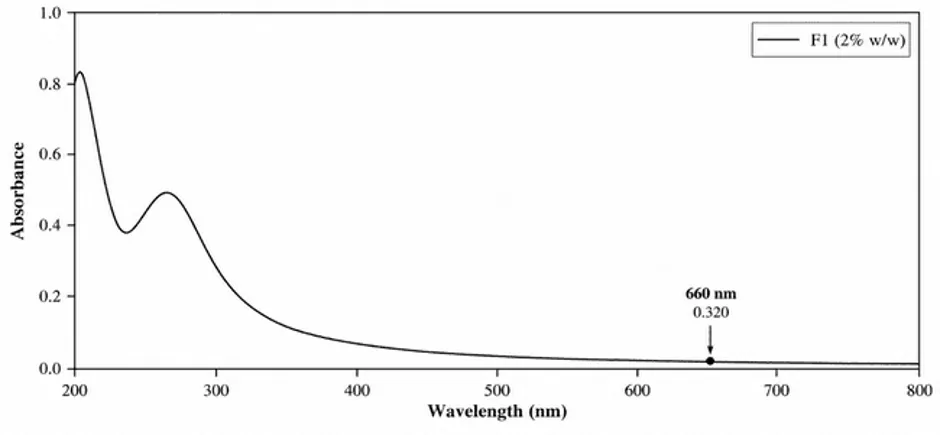
Figure 7.9: UV–Visible Absorption Spectrum of Formulation F1 (2% w/w M. paniculata Extract)
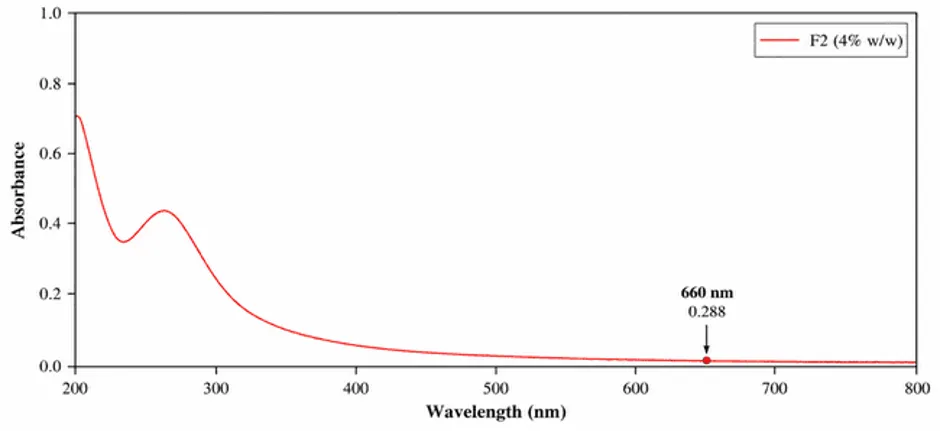
Figure 7.10: UV–Visible Absorption Spectrum of Formulation F2 (4% w/w M. paniculata Extract)
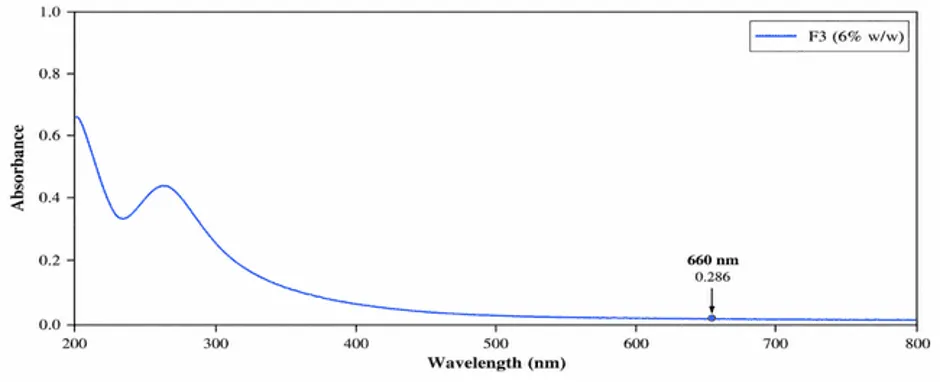
Figure 7.11: UV–Visible Absorption Spectrum of Formulation F3 (6% w/w M. paniculata Extract)
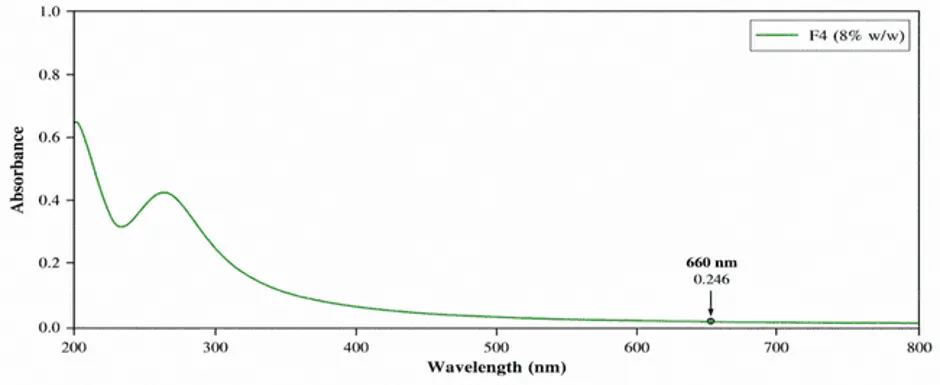
Figure 7.12: UV–Visible Absorption Spectrum of Formulation F4 (8% w/w M. paniculata Extract)
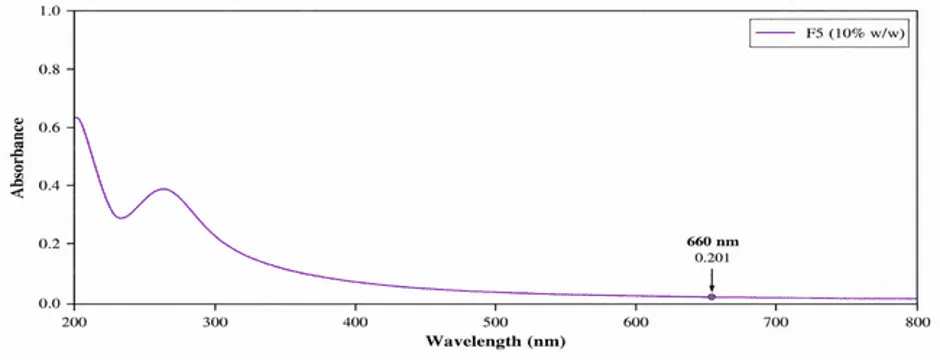
Figure 7.13: UV–Visible Absorption Spectrum of Formulation F5 (10% w/w M. paniculata Extract)
3.9. Overall Discussion
The present study investigated the preparation and evaluation of Murraya paniculata leaf extract ointments containing 2–10% w/w extract. The 70% ethanolic Soxhlet extraction yielded 14% w/w concentrated extract. Preliminary characterization indicated UV absorption at 270 nm, possible functional groups based on the supplied FTIR spectral ranges, and qualitative positive reactions for several phytochemical groups.
Five ointment formulations were prepared using white soft paraffin and anhydrous lanolin. Their physical evaluation demonstrated differences in colour, consistency, apparent pH, spreadability, and extrudability. The higher-concentration formulations were comparatively firmer and exhibited lower spreadability. All five formulations were reported to have a uniform appearance, no perceptible grittiness, and no visible phase separation during the recorded assessments.
During the 90-day stability study, the recorded qualitative characteristics remained largely unchanged, while small variations in apparent pH and a gradual reduction in spreadability were observed. These findings describe the physical behaviour of the formulations under the reported storage conditions but do not independently establish chemical stability, microbiological quality, or skin safety.
In the BSA protein denaturation assay, F5 containing 10% w/w extract showed the highest reported inhibition among the five formulations, at 82.02%, while diclofenac sodium showed 88.27%. The results provide preliminary in-vitro evidence supporting further investigation of the extract-containing ointment. Nevertheless, confirmation requires review of the individual absorbance readings, appropriate blank correction, the ointment-base control, and suitable statistical analysis.
Taken together, the findings provide an initial formulation-level assessment of Murraya paniculata ointment and its reported in-vitro protein denaturation inhibition. Further validated studies are required before making definitive claims regarding the optimized formulation, topical safety, mechanism of action, or therapeutic efficacy.
4. CONCLUSION
The present study investigated the formulation and preliminary in-vitro anti-inflammatory activity of Murraya paniculata leaf extract ointments. Hydroethanolic extraction yielded 14% w/w extract, and preliminary phytochemical screening indicated the presence of flavonoids, phenolic compounds, alkaloids, and tannins. Five ointment formulations containing 2–10% w/w extract were prepared using white soft paraffin and anhydrous lanolin. The formulations exhibited smooth semisolid characteristics and uniform macroscopic appearance, with variations in consistency and spreadability according to extract concentration. F1 showed the highest spreadability, whereas F5 showed the lowest.
During the 90-day storage period, no visible phase separation or perceptible grittiness was reported, although minor changes in apparent pH and spreadability occurred. In the BSA protein denaturation assay, the formulations showed reported inhibition values ranging from 71.30% to 82.02%. F5, containing 10% w/w extract, exhibited the highest reported inhibition (82.02%), followed by F4 (78.00%), F3 (74.43%), F2 (74.22%), and F1 (71.30%). Diclofenac sodium showed 88.27% inhibition under the reported assay conditions. Thus, F5 demonstrated the highest reported activity among the formulated ointments, although its inhibition remained below that of the reference standard.
Overall, the findings provide preliminary support for further investigation of M. paniculata leaf extract as an ingredient in topical herbal formulations. However, these results do not establish clinical effectiveness, dermal safety, or definitive formulation optimization. Verification of the assay calculations and appropriate controls, together with further skin-safety studies, drug-release and skin-permeation testing, and comprehensive stability evaluation, is required before the formulation can be considered for therapeutic application.
REFERENCES

Pradumn Pratap Singh, Pradeep Kumar, Formulation and Evaluation of Murraya paniculata Ointment for Anti-Inflammatory Activity, Int. J. of Pharm. Sci., 2026, Vol 4, Issue 10, 3332-3358. https://doi.org/10.5281/zenodo.23573300
 10.5281/zenodo.23573300