View Article

  • A Concise Overview of Infrared Spectroscopy by using the Fourier Transform (FTIR)

  • Pachamuthu College of Pharmacy, Dharmapuri. Affiliated to The Tamil Nadu Dr. M. G. R. Medical University, Chennai, Tamil Nadu, India.

Abstract

Fourier transform Infrared spectroscopy (FTIR) is used to study about the vibrational behavior of Samples, which has a range of even with very small structure variations. Although FTIR have a highly specific feature it to detect vibrations from many components at the same time, such as co factors, amino acid side chains, water molecules etc...This method helps identify vibrations from specific chemical group that take part in a particular reaction. FTIR spectroscopy is commonly used as a detector in gas chromatography. FTIR is mainly used in the medical research. The technique is especially useful for identifying molecular finger prints, detecting biochemical structure and biological samples. It is widely used for the analysis of both small and complex molecules. It can analyses different type samples such as solids, liquid and gas. It is spectral range for 12800 cm-1 to 10 cm-1. This methods is applied in many fields such as agriculture, food analysis, polymer science, and textiles.

Keywords

FTIR, Vibration and amino acids

Introduction

The first low-cost instrument that measured an infrared spectrum was the Perkin–Elmer Infrared, made in 1957. It measured wavelengths from 2.5 µm to 15 µm, which is the same as 4000 to 600 cm?¹.The lower wavelength limit was chosen to include the highest molecular vibration energy. The upper limit was fixed due to the use of a rock-salt (NaCl) prism as the dispersing material. The prism becomes opaque at wavelengths above 15 µm, so this region was called the rock-salt region. Later, potassium bromide (KBr) prisms were used, extending the range up to 25 µm (400 cm?¹). This range is called the far-infrared region, which slightly merges into the microwave region. Far-IR radiation has very low energy, so more sensitive detectors than bolometers were needed to identify the chemical substance, such as the Golay detector. The Michelson interferometer was already known to be useful, but it took time to solve the technical problems. A computer was also required to perform the Fourier transformation, which became possible only after the invention of digital computers like the PDP-8, introduced in 1965.In 1969, Digi-lab introduced the world’s first commercial FTIR spectrometer, known as FTS-14.FTIR is one of the simple most commonly used spectroscopic techniques in organic and inorganic chemistry. Its work is based on the interaction of infrared radiation with the vibrational of the molecule. It collects a signal from the sample by interferometer and convert into a interfergram further it was converts it into an IR spectrum. FTIR can measure wide range of infrared regions, from Near Infrared (NIR) to Far Infrared (FIR).The basic principle of FTIR spectroscopy is the measurement of IR radiation absorbed, emitted or reflected by a substance. Each chemical bond absorbs IR radiation or a specific frequency, which helps in identifying the compound by comparing their IR spectra with Reference spectra. IR region is divided into three parts.

  • Near-Infrared (NIR): 12,800 to 4,000 cm?¹ (0.78 to 2.5 µm).
  • Mid-Infrared (MIR): 4,000 to 400 cm?¹ (2.5 to 25 µm)
  • Far-Infrared (FIR): 400 to 10 cm?¹ (25 to 1,000 µm).

FTIR spectroscopy is a fast, real time and non-destructive technique. It is used for both the qualitative analysis (identification of compound) and quantitative analysis. The main purpose of the FTIR is to determination the concentration for solid, liquid and gas samples. For a molecule to the IR active, there will be a change in dipole moment during vibration. IR active molecule are polar bond and asymmetric molecules. IR inactive molecule are non-polar bond and symmetric molecules. IR spectroscopy is very useful for identifying substance, even compounds are very similar.

Principle:

In FTIR spectrometer there are two beams of Michelson interferometer present, which consist of two mirror that are mutually perpendicular to each other .One of the mirror is fixed and other mirror is movable. FTIR consisting source and detector, a beam emitted by a source and splitted into two beam by beam splitter which coherent they interference on recombination .The movement of sample to the mirror leaves the interferometer that can be focused by detector. A signal is detected by detector the conversion of interferogram into spectrum by using Fourier Transformation. One of the most essential steps in FTIR spectrum is first to produce interferogram with or without sample in beam. Second transform interferogram into spectrum source with or without sample absorption .Finally the value is observed in the interfogram

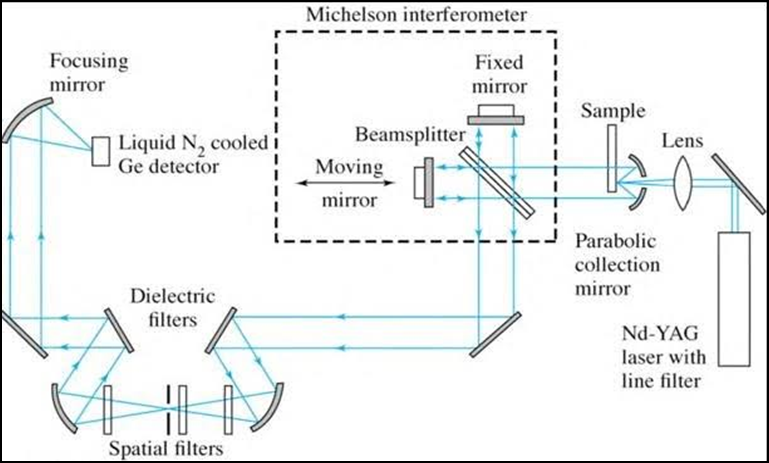
Fig.1 Block diagram of FTIR

Instrumentation:

FTIR instrumentation is simple and high accurate, except when synchrotron radiation is used. In FTIR region tungsten filament acts as light source which emits polychromatic radiation. The light is focused into a Michelson Interfometer containing a beam splitter divides the beam into two:

One beam is reflected to fixed mirror while other beam reflects to moving mirror

Both recombine at beam splitter and produce interference due to optical path difference. The interferogram obtained is processed to give spectrum with high resolution and accuracy.

Different Parts of FTIR Instrumentation  

  1. Source
  2. The interferometer
  3. The sample
  4. Detector
  5. Computer

Source:

The source in the FTIR instrument provides infrared radiation needed for analysis of the drug substances. Infrared energy is emitted from a glowing wave body source are Nernst glower, Glober tungsten filament which emit the polychromatic radiation. It allows to pass through the aperture which controls the intensity and quality of beam and amount of energy. Commonly used FTIR light source are heated solids like a globar /silicon carbide Nernst glower.

Interferometer:

The interferometer is the main part of an FTIR instrument its work to split the infrared light into two beams and then recombine them. One beam travels to fixed mirror, other goes to moving mirror. When two beam come back together, they create an interference pattern called 'INTERFEROGRAM'. After passing through the sample the interferogram is sent to the detector.

Sample:

The interfered beam passes through or reflects from the sample compartment depending upon the type of analysis. Sampler can be solids, liquids, gases which is prepared by different ways such as KBr pellets, thin films, and liquid cells. Specific frequencies of IR radiation are absorbed by sample depending on its vibration and functional groups.

Detector:

In FTIR, the detector is used to measure the light that pass through or reflected from the sample, which converts this IR radiation or light into Electrical energy. Finally measure the interferogram .Common FTIR detector;

  1. DLATGS - Commonly used in room temperature for routine analysis.
  2. LIQUID NITROGEN - High sensitivity measurement.
  3. SILICON PHOTODIODE - Near IR and visible region.
  4. SILICON BOLOMETERS - Far infrared.

Computer:

The computer controls the FTIR instrument and process the signal received from detector. Fourier transformation converts the interferogram into normal IR spectrum. It can process store and displaying the IR spectrum and then plotted the graph absorbance vs wavelength.

Michelson Interferogram:

In an FTIR spectrometer, a Michelson interferometer is used to analyze infrared radiation. The IR light coming from the source is first collimated and then sent to a beam splitter. The beam splitter divides the light into two equal parts:

  • One beam goes to a fixed mirror.
  • The other beam goes to a moving mirror. After reflecting from both mirrors, the two beams return to the beam splitter and recombine. Light then passes through the sample and finally reaches the detector. The distances travelled by the two beams become different. This difference is called the Optical Path Difference (OPD).

By changing the OPD and recording the detector signal, an interferogram is produced.

OPD = 0, constructive interference occurs and maximum intensity is produced.

OPD increases, the signal shows a series of “wiggles.”

Comparison between IR and FT-IR

Feature

IR

FTIR

Signal to  noise ratio

Low

Very high

Wavenumber accuracy

Low accuracy ( 2- 8 cm- 1)

Very high accuracy (0.01  cm-1)

Scanning speed

Slow and take several minute (3-5)

Very fast (few seconds)

Mechanical design

Many moving parts

Only one  moving parts

Stray light

Present ( incorrect reading)

Negligible (no stray)

Calibration

Requires calibration with reference spectra

No external calibration

Resolution

Low

High

Spectrum

Discontinuous spectrum (limited range)

Continuous spectrum

Thermal effect

Sample affected by heat

No thermal effect

Sensitivity

Less

High

Beam optics

Double beam

Single beam

Light detection

Detector receives only small fraction of energy

Detector receives up to 50% of  energy

Advantage:

  • Fast analysis
  • FTIR measures all wavelength at the same time so result are within few seconds instead of minute.
  • High sensitivity detector and high optical.
  • Noise is reduce.
  • Mechanical simplicity (only a moving mirror is in continuous motion, minimizing break down risk)
  • Internal calibration, Henle  laser is used for self-calibration
  • No user calibration is needed.

Disadvantage:

  • Small chamber is used
  • Limited amount of sample is required.
  • Mounted pieces can block the IR beam, only small items can be tested.
  • Some materials absorb all IR radiation making reliable measurement impossible.

Application:

Pharmaceutical application

  • FTIR spectroscopy is important analytical technique used to study the structure of organic and inorganic compounds. 
  • It mainly helps to identifying functional groups by analyzing the mid-infrared region (4000-400 CM-1)
  • It is widely used in pharmaceutical analysis because it is fast and acurate
  • This technique is helpful in identification of drugs
  • Analysis of pharmaceutical formulation
  • Detection of impurities and counterfeit medicines
  • Study of herbal and biological samples

Drugs and pharmaceutical dosage forms analyzed using FTIR

  • Anti - parasitic drugs (Artemisinin, Artemether and thiabendazole)
  • Antibiotics (Amoxicillin, Kanamycin, ciprofloxacin etc...)
  • Analgesic/Anti-inflammatory (Ibuprofen, paracetamol etc...)
  • Anti-viral drugs(Acyclovir, Efquirenz)
  • Antihypertensive drugs( Amlodipine, Atenolol, Furosemide and Cilnidipine)
  • Antidiabetic drugs( Teneligliptin and acarbose)

FTIR in herbal medicine analysis

  • It is commonly used to analyze herbal medicines and plant extracts.
  • It helps in identifying bioactive compounds, especially flavonoids.
  • The technique is economical, easy to use and reliable. when combined with chemo metric methods, FTIR provides accurate results, saving time and cost

FTIR identification of natural and fake diamonds

  • Fake diamonds such as Zirconia (zro2) Synthetic moissanite (sic), Unniltrium, Aluminum garnet ( yag)
  • Garnet shows absorption peaks around 800-400cm-1 region
  • Zirconia does not show absorption the 4000-1200 cm-1 region
  • Synthetic moissanite shows b/w 2400-1200cm-1 region

Application of ftir in food analysis

  1. Meat analysis

It is used for the rapid analysis of fat and protein content in meat products such as Fat, Protein and Total solids with an accuracy of about 0.2%

2) Fats and oils

FTIR is also useful for monitoring oil oxidation. As oxidation increases the peroxide peak in the FTIR spectrum also increase, allowing early dectection of oil degradation.

FTIR analysis the pharmaceutical drugs:

  • FTIR spectroscopy is widely used for fast and accurate analysis of pharmaceutical drugs.

Eg: Aspirin and vitamins.

FTIR analysis of vitamins:

  • It is used to identify and quantify vitamins such as vitamin A, vitamin C. This technology is rapid, reliable and suitable for routine quality control.

FTIR analysis of carbamazepine:

  • Carbamazepine shows polymorphism and some forms have solubility and bioavailability, which using is advanced data processing method such as Standard Normal Variate, Lazy Learning and Support Vector Machines.

Future trends in FTIR spectroscopy for inorganic materials

  • The evolution of technology has driven the development of newer, more sophisticated instruments capable of providing complete information about the Fourier Transform infrared spectroscopy (FTIR) and it is capable of providing evidence for the investigation application including those involving inorganic materials.
  • In analysis of the technological advancements that have recently emerged infrared spectroscopy along with Fourier transform in new applications and research directions.

Miniaturization and FTIR devices in a portable way

  • Important trend in FTIR technology to improving the miniaturization and portability.
  • These small instruments retain the features of a conventional colorimetric spectrometer used in laboratories but provide the convenience of off-site analysis.
  • It is significantly various fields such as environmental monitoring, archaeology, and industrial quality control.
  • Portable FTIR ha allowing for immediate analysis of mineral compositions where the accessibility is limited.

Improved sensitivity and resolution

  • Recent advances in detector technology and optical components have  improved sensitivity and resolution of FTIR These will enabling
    • The detection of low-level materials
    • Close spectral overlapping features
    •  Accurate molecular characterization
    •  Investigations of complex inorganic materials such as mixed oxides

FTIR imaging and micro spectroscopy

  • Combining spatial resolution with spectral analysis, FTIR imaging and micro spectroscopy enables detailed mapping of the chemical composition of the surface of a sample.
  • Modern developments in imaging systems and data processing are making this technique increasingly powerful for material science applications.

Integration with other analytical techniques

  • It improving the trending of FTIR with combination of other techniques such as Raman spectroscopy, X-Ray Diffraction (XRD), and Scanning Electron Microscopy (SEM).  In this FTIR in combination with other analytical techniques can provide complementary information (e.g., vibrational information from Raman spectroscopy and other crystal structure data from XRD). These integrated systems are more prevalent than individual system components in advanced research labs.

Development of advanced ATR accessories

  • ATR (Attenuated Total Reflectance) attachment: ATR is the common attachment apparatus in FTIR spectroscopy, and it is particularly well suited for solid and liquid sample analysis. Newer developments in ATR technology are based on diamond-ATR crystals, which present the possibility for more rugged samples and a wider spectral range.  This enhanced approach of ATR-FTIR enables applied inorganic materials to simplifying measurements, particularly for instrument-heavy use.

Automation and artificial intelligence (AI) in FTIR spectroscopy

Automation and artificial intelligence in FTIR spectroscopy automation especially in data processing and interpretation to find a role. Automation of FTIR provides a number of benefits that facilitate the analysis, ranging from sample preparation to data acquisition and spectral analysis.  These innovations are decreasing the analysis time while simultaneously increasing the accuracy and reproducibility of FTIR measurements.

CONCLUSION

FTIR spectroscopy is a powerful analytical technique used to determine the molecular structure of substances. It identifies functional groups by detecting characteristic infrared absorption bands and provides a unique molecular fingerprint for each compound.The method is rapid, accurate, and non-destructive, requiring only a small amount of sample. By analyzing the functional group region and fingerprint region, FTIR enables reliable identification and characterization of compounds. Due to its precision and versatility, FTIR is widely used in pharmaceutical analysis, quality control, chemical research, polymer studies, and herbal drug evaluation.

REFERENCES

  1. Catherine berthomie,Rainer hienerwael..,fourier transform infrared spectroscopy julu2009, 101(2-3):157-70.
  2. Matthew J. Baker, Júlio Trevisan, Paul Bassan, Rohit Bhargava, Holly J. Butler,Konrad M. Dorling, Peter R. Fielden, Simon W. Fogarty, Nigel J. Fullwood, Kelly A. Heys, Caryn Hughes, Peter Lasch, Pierre L. Martin-Hirsch, Blessing Obinaju, Ganesh D. Sockalingum, Josep Sulé-Suso, Rebecca Strong, Michael J. Walsh, Bayden R. Wood, Peter Gardner, Francis L. Martin..,Using Fourier Transform Infrared (FTIR) Spectroscopy to Analyze Biological Materials,jul3:9(8):1771-1791.
  3. Vishruti Maniar¹, Krishna Kalsara², Dr. Umesh Upadhyay³..,A Review of FTIR – An Useful Instrument,vol8,issue1,jan-feb2023.
  4. Naredddy Preethi Reddy, Yenumula Padmavathi,Perika Mounika, Akari Anjali..,FTIR Spectroscopy for Estimation of Efavirenz in Raw Material and Tablet Dosage Form,May2015,vol4(6)393-395.
  5. W. D. Perkins..,Fourier Transform–Infrared Spectroscopy,vol63,jan1986.
  6. S. S. Bhokare¹, Y. R. Biradar², R. D. Chakole³, M. S. Charde?..,Applications of FTIR Spectroscopy: Review,vol7, issue8,aug2022.
  7. 7.Magdi A. A. Mousa, Yangyang Wang, Salma Akter Antora, Adel D. Al-qurashi, Omer H. M. Ibrahim, Hong-Ju He, Shu Liu & Mohammed Kamruzzaman..,An overview of recent advances and applications of FT-IR spectroscopy for quality, authenticity, and adulteration detection in edible oils,12May2021.
  8. 8.Lumen, D.; Wang, S.; Mäkilä, E.; Imlimthan, S.; Sarparanta, M.; Correia, A.; Haug, C.W.; Hirvonen, J.; Santos, H.A.; Airaksinen, A.J.; et al. Investigation of silicon nanoparticles produced by centrifuge chemical vapor deposition for applications in therapy and diagnostics. Eur. J. Pharm. Biopharm. 2021, 158, 254–265.
  9. Chen, X.; Zhao, X.; Wang, G. Review on marine carbohydrate–based gold nanoparticles represented by alginate and chitosan for biomedical application. Carbohydr. Polym. 2020, 244, 116311. [CrossRef] (PubMed)
  10. Yahui Gong, Xuerong Chen, Wei Wu *Application of fourier transform infrared (FTIR) spectroscopy in sample preparation: Material characterization and mechanism investigation
  11. Griffiths, P. R. "Chemical Infrared Fourier Transform Spectroscopy"; Wiley: NewYork. 1975.
  12. Hoard, J.; Venkataramanan, N.; Marshik, B.; Murphy, W. NH3 Storage in Sample Lines; SAE Technical Paper 2014-01-1586: Warrendale, PA, USA, 2014. [CrossRef]
  13. Ballantyne, V.F.; Howes, P.; Stephanson, L. Nitrous Oxide Emissions from Light Duty Vehicles; SAE Technical Paper 940304: Warrendale, PA, USA, 1994. [CrossRef]
  14. J. Haas and B. Mizaikoff, Advances in Mid-Infrared Spectroscopy for Chemical Analysis, Annu. Rev. Anal. Chem., 2016, 9(1), 45–68.
  15. M. P´erez-Alonso, K. Castro and J. M. Madariaga, Vibrational spectroscopic techniques for the analysis of artefacts with historical, artistic and archaeological value, Curr. Anal. Chem., 2006, 2(1), 89–100.
  16. S. J. Wen, T. J. Richardson, L. Ma, K. A. Striebel, P. N. Bossand E. J. Cairns, FTIR Spectroscopy of Metal Oxide Insertion Electrodes: A New Diagnostic Tool for Analysis of Capacity Fading in Secondary Cells, J. Electrochem. Soc., 1996, 143(6), L136.
  17. B. Lendl and R. Schindler, Flow-through sensors for enhancing sensitivity and selectivity of FTIR spectroscopy in aqueous media, Vib. Spectrosc., 1999, 19(1), 1–10.

Reference

  1. Catherine berthomie,Rainer hienerwael..,fourier transform infrared spectroscopy julu2009, 101(2-3):157-70.
  2. Matthew J. Baker, Júlio Trevisan, Paul Bassan, Rohit Bhargava, Holly J. Butler,Konrad M. Dorling, Peter R. Fielden, Simon W. Fogarty, Nigel J. Fullwood, Kelly A. Heys, Caryn Hughes, Peter Lasch, Pierre L. Martin-Hirsch, Blessing Obinaju, Ganesh D. Sockalingum, Josep Sulé-Suso, Rebecca Strong, Michael J. Walsh, Bayden R. Wood, Peter Gardner, Francis L. Martin..,Using Fourier Transform Infrared (FTIR) Spectroscopy to Analyze Biological Materials,jul3:9(8):1771-1791.
  3. Vishruti Maniar¹, Krishna Kalsara², Dr. Umesh Upadhyay³..,A Review of FTIR – An Useful Instrument,vol8,issue1,jan-feb2023.
  4. Naredddy Preethi Reddy, Yenumula Padmavathi,Perika Mounika, Akari Anjali..,FTIR Spectroscopy for Estimation of Efavirenz in Raw Material and Tablet Dosage Form,May2015,vol4(6)393-395.
  5. W. D. Perkins..,Fourier Transform–Infrared Spectroscopy,vol63,jan1986.
  6. S. S. Bhokare¹, Y. R. Biradar², R. D. Chakole³, M. S. Charde?..,Applications of FTIR Spectroscopy: Review,vol7, issue8,aug2022.
  7. 7.Magdi A. A. Mousa, Yangyang Wang, Salma Akter Antora, Adel D. Al-qurashi, Omer H. M. Ibrahim, Hong-Ju He, Shu Liu & Mohammed Kamruzzaman..,An overview of recent advances and applications of FT-IR spectroscopy for quality, authenticity, and adulteration detection in edible oils,12May2021.
  8. 8.Lumen, D.; Wang, S.; Mäkilä, E.; Imlimthan, S.; Sarparanta, M.; Correia, A.; Haug, C.W.; Hirvonen, J.; Santos, H.A.; Airaksinen, A.J.; et al. Investigation of silicon nanoparticles produced by centrifuge chemical vapor deposition for applications in therapy and diagnostics. Eur. J. Pharm. Biopharm. 2021, 158, 254–265.
  9. Chen, X.; Zhao, X.; Wang, G. Review on marine carbohydrate–based gold nanoparticles represented by alginate and chitosan for biomedical application. Carbohydr. Polym. 2020, 244, 116311. [CrossRef] (PubMed)
  10. Yahui Gong, Xuerong Chen, Wei Wu *Application of fourier transform infrared (FTIR) spectroscopy in sample preparation: Material characterization and mechanism investigation
  11. Griffiths, P. R. "Chemical Infrared Fourier Transform Spectroscopy"; Wiley: NewYork. 1975.
  12. Hoard, J.; Venkataramanan, N.; Marshik, B.; Murphy, W. NH3 Storage in Sample Lines; SAE Technical Paper 2014-01-1586: Warrendale, PA, USA, 2014. [CrossRef]
  13. Ballantyne, V.F.; Howes, P.; Stephanson, L. Nitrous Oxide Emissions from Light Duty Vehicles; SAE Technical Paper 940304: Warrendale, PA, USA, 1994. [CrossRef]
  14. J. Haas and B. Mizaikoff, Advances in Mid-Infrared Spectroscopy for Chemical Analysis, Annu. Rev. Anal. Chem., 2016, 9(1), 45–68.
  15. M. P´erez-Alonso, K. Castro and J. M. Madariaga, Vibrational spectroscopic techniques for the analysis of artefacts with historical, artistic and archaeological value, Curr. Anal. Chem., 2006, 2(1), 89–100.
  16. S. J. Wen, T. J. Richardson, L. Ma, K. A. Striebel, P. N. Bossand E. J. Cairns, FTIR Spectroscopy of Metal Oxide Insertion Electrodes: A New Diagnostic Tool for Analysis of Capacity Fading in Secondary Cells, J. Electrochem. Soc., 1996, 143(6), L136.
  17. B. Lendl and R. Schindler, Flow-through sensors for enhancing sensitivity and selectivity of FTIR spectroscopy in aqueous media, Vib. Spectrosc., 1999, 19(1), 1–10.

Photo
Dharmasastha S
Corresponding author

Assistant professor, Department of Pharmaceutical Analysis, Pachamuthu College of Pharmacy, Dharmapuri. Affiliated to The Tamil Nadu Dr. M. G. R. Medical University, Chennai, Tamil Nadu, India.

Photo
Lokesh M
Co-author

Pachamuthu College of Pharmacy, Dharmapuri. Affiliated to The Tamil Nadu Dr. M. G. R. Medical University, Chennai, Tamil Nadu, India.

Photo
Dr. M. Radhakrishnan
Co-author

Pachamuthu College of Pharmacy, Dharmapuri. Affiliated to The Tamil Nadu Dr. M. G. R. Medical University, Chennai, Tamil Nadu, India.

Dharmasastha S, Lokesh M, Dr. M. Radhakrishnan, A Concise Overview of Infrared Spectroscopy by using the Fourier Transform (FTIR), Int. J. of Pharm. Sci., 2026, Vol 4, Issue 3, 898-906. https://doi.org/10.5281/zenodo.18925625

More related articles
Quality Indicators In Laboratory Medicine With Spe...
Anitha.k, Vallab ganesh Bharadwaj , P.chitra Rajalakshmi , Prabhu...
Formulation And Evaluation of The Facial Scrub fro...
Varsha Nagre, Pragati Shinde, Dr. Swati Deshmukh, ...
Advances In Herbal Drugs for Wound Healing: A Revi...
MEGHA V S, Dr. ARUN KUMAR K V, ANAGHA MOHAN, M ROSHNI, SANDHRA S,...
Therapeutic Potential and Pharmacognostic Review of Benincasa hispida ...
Shagufta Farooqui, Sayyed Javvad Ali, S. A. Tekale, V. N. Gunjkar, Shaikh Etesam, ...
Formulation And Evaluation of Herbal Gel of Syzygium cumini of Antioxidant Activ...
Dr. Hemalata Wadkar, Krishna Kendre, Aditi Mardhekar, Tejashree Patil, ...
Formulation Strategies And Consideration In Nanosuspension Development: A Review...
Vittal C., Snehalatha, Uma M., Nagaraja T. S, Yogananda R., ...
Related Articles
Recurrent Phenytoin-Induced Gingival and Lip Hyperplasia Following Rat Killer Pa...
G. Georglin Heavenlia , R. S. Atchayavarshini, B. Deepasree, Fathima Juhaina. M. Abdul Khader, Dr. V...
Review On Bryophyllum Pinnatum ...
Mahendra Siddheshwar Shendkar , Snehal Kothavale , Lahoo Palave, Leena Parkhi, Lalit Ambhore, Snehal...
A Comparative Review of Sunscreen Serum: UV Protection Efficacy and Spectroscopi...
Payal Jagnade , Shrutika Nakshane, Gaurav Meshram, Dr. Nilesh Chachda, ...
Studies On Effect Of Supplementation Of Ascorbic Acid On Post Thaw Sperm Acrosom...
Nagendra Singh , Akhil Patel , Suresh Kumar , Megha Pande , Vijay Singh , R.A. Siddique , ...
Quality Indicators In Laboratory Medicine With Special Reference To Respiratory ...
Anitha.k, Vallab ganesh Bharadwaj , P.chitra Rajalakshmi , Prabhusaran.N, ...
More related articles
Quality Indicators In Laboratory Medicine With Special Reference To Respiratory ...
Anitha.k, Vallab ganesh Bharadwaj , P.chitra Rajalakshmi , Prabhusaran.N, ...
Advances In Herbal Drugs for Wound Healing: A Review...
MEGHA V S, Dr. ARUN KUMAR K V, ANAGHA MOHAN, M ROSHNI, SANDHRA S, HARITHA K, SINDHU V, ...