Viswanadha Institute of Pharmaceutical Sciences
A rapid, sensitive and precise reverse-phase high-performance liquid chromatography (RP-HPLC) method was developed for the simultaneous quantification of Dutasteride and Tamsulosin Hydrochloride using a Waters HPLC system. Chromatographic separation was achieved on a Inertsil ODS C18 column (250 × 4.6 mm, 5 µm particle size) maintained at ambient temperature. The mobile phase consisted of acetonitrile and buffer in the ratio of 80:20(v/v), which was filtered through a 0.45µm membrane filter prior to use. The flow rate was maintained at 1.0 mL/min and detection was carried out at 228 nm using PDA detector.
Urimax® is a combination drug containing Dutasteride and Tamsulosin hydrochloride. Dutasteride (7-8) is a synthetic 4-azasteroid compound that selectively inhibits both the type I and type II isoforms of steroid 5α-reductase, an intracellular enzyme that converts testosterone to 5α-dihydrotestosterone (DHT). Dutasteride works by reducing the levels of circulating DHT.
Tamsulosin (9-10) is a blocker of alpha-1A and alpha-1D adrenoceptors. About 70% of the alpha-1 adrenoceptors in the prostate are of the alpha-1A subtype. By blocking these adrenoceptors, smooth muscle in the prostate is relaxed and urinary flow is improved. The blocking of alpha-1D adrenoceptors relaxes the detrusor muscles of the bladder which prevents storage symptoms. The specificity of tamsulosin from the dutasteride focuses the effects to the target area while minimizing effects in other areas. So the combination of both was shown to reduce the size of the prostate gland, improve urinary flow, and symptoms of benign prostatic hyperplasia.
II. MATERIALS AND METHODS
Preparation of Stock solution: 10 mg of Tamsulosin Hydrochloride and 10 mg of Dutasteride API standards were accurately weighed and are transferred into two separate 10 ml volumetric flasks and dissolved in 10ml of mobile phase. The mixture was then sonicated for 20 minutes to obtain 1000μg/ml.
Preparation of working standard solution: From the stock solutions of both standards, each 0.4 ml was pipetted out and transferred in to 10ml volumetric flasks, made up to 10 ml with mobile phase and sonicated for 10 minutes, to obtain 40μg/ml Tamsulosin Hydrochloride and Dutasteride.
Preparation of buffer: 2.7218 gms of potassium dihydrogen phosphate was accurately weighed, transferred into 1000ml beaker and dissolved with HPLC grade water. The pH of the solution was maintained at 3.4 using orthophosphoric acid.
III. RESULTS AND DISCUSSION
Method validation: Validation parameters include specificity, linearity, range, accuracy, precision, limit of detection, limit of quantification, robustness and assay (1-6).
Specificity: Specificity is the ability to assessing equivocally the analyte in the presence of components which may be expected to be present. Typically, these components include impurities, degradants, matrix etc. Blank solution and standard solutions of Dutasteride (40μg/ml) and Tamsulosin HCl. (40μg/ ml) were injected into the HPLC system. The peak purity data of Dutasteride and Tamsulosin Hcl. were compared. There should not be any interference at the retention time of the main peaks (11-19).
Linearity: Linearity for the drugs Dutasteride and Tamsulosin HCl. was determined by preparing the standard solutions at six concentrations levels in six replicates in the range of 20-70μg/ml Dutasteride and 20-70μg/ml for and Tamsulosin hydrochloride from stock solution. The linearity charts of Dutasteride and Tamsulosin HCl. was shown in the figure no 2&3. The correlation coefficient was found to be 0.9996 and 0.9994 for Dutasteride and Tamsulosin Hydrochloride respectively. Linearity results were tabulated in table 2.
Accuracy: Accuracy was performed by spiking known amounts of standard solution to sample solution at three different concentrations levels (50%, 100%, 150%) and there by analyzed for %RSD which should not be more than 2.0.The % recovery was calculated and the results was reported in table no. 3 & 4.
Precision: The precision of the analytical method was studied by injecting six replicates of standard containing 40μg/ml of Dutasteride and 40μg/ml of Tamsulosin Hydrochloride which were injected into HPLC system. The % RSD was calculated and the results were reported in the table no.5 & 6.
Limit of Detection (LOD) and Limit of Quantification (LOQ): The limit of detection was defined as the concentration which yields a signal - to – noise ratio 3:1 whereas the limit of quantification was calculated to be the lowest concentration that could be measured with signal - to – noise ratio10:1. LOD and LOQ were calculated from slope and standard deviation. The results were tabulated in table no. 7.
Robustness: The smallest deliberate changes in method like change in flow rate are made but there were no predictable changes in the results and are in the range as per ICH guidelines. Conditions like decrease in flow rate (0.8 ml/min), increase in flow rate (1.2 ml/min) was maintained and samples were injected in duplicate manner. System suitability parameters were not much affected and all the parameters were passed. % RSD was found to be within the limits and results were tabulated in table no. 8.
Assay: Assay was conducted on marketed formulation and mean % assay was found. The results were tabulated in table no. 9.
Table1: Optimised Chromatographic Conditions
|
Parameter |
Method |
|
Stationary Phase (column) |
Inertsil -ODS C18 (250 x 4.6 mm, 5 µ) |
|
Mobile Phase |
Acetonitrile : Buffer (80:20) |
|
Flow rate (ml/min) |
1.0 ml/min |
|
Run time (minutes) |
10 min |
|
Temperature in the column (°C) |
Ambient |
|
Injection volume (ml) |
20 |
|
Detection wavelength (nm) |
228nm |
|
Drug RT (min) |
4.097min for Dutasteride and 5.739 for Tamsulosin Hydrochloride. |
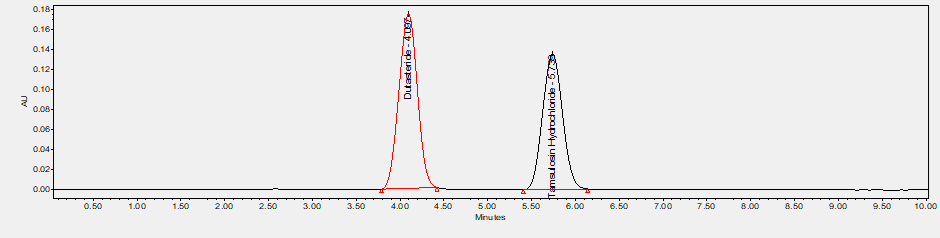
Figure 1: Optimised Chromatogram
Table 2: Linearity data of Dutasteride and Tamsulosin Hydrochloride
|
Dutasteride |
Tamsulosin Hydrochloride |
||
|
Conc (µg/ml) |
Peak area |
Conc (µg/ml) |
Peak area |
|
20 |
1321355 |
20 |
1038692 |
|
30 |
1906818 |
30 |
1596469 |
|
40 |
2543397 |
40 |
2129201 |
|
50 |
3175164 |
50 |
2733584 |
|
60 |
3763802 |
60 |
3302810 |
|
70 |
4359105 |
70 |
3785267 |
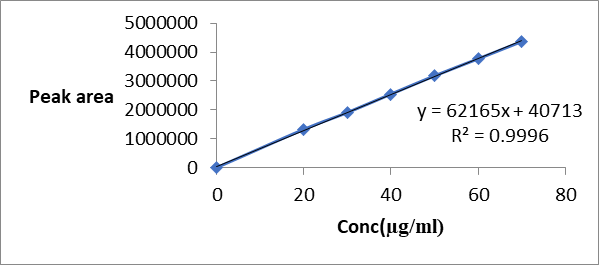
Figure 2: Calibration curve of Dutasteride
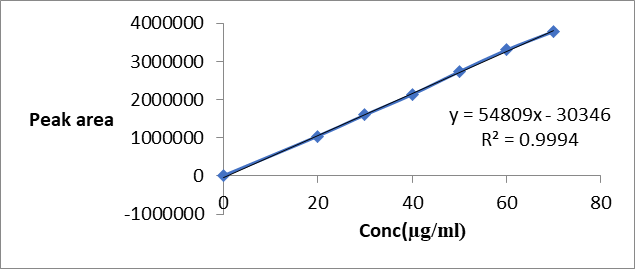
Figure 3: Calibration curve of Tamsulosin Hydrochloride
Table 3: Accuracy Data of Dutasteride
|
Concentration % of spiked level |
Amount added (ppm) |
Amount found (ppm) |
% Recovery |
Statistical Analysis of % Recovery |
|
|
50% - 1 |
20 |
20.15 |
100.75 |
MEAN |
99.68 |
|
50% - 2 |
20 |
19.86 |
99.31 |
|
|
|
50% - 3 |
20 |
19.80 |
99.02 |
%RSD |
0.92 |
|
100 % - 1 |
40 |
39.88 |
99.70 |
MEAN |
99.841 |
|
100 % - 2 |
40 |
40.12 |
100.30 |
|
|
|
100% - 3 |
40 |
39.80 |
99.50 |
%RSD |
0.41 |
|
150% - 1 |
60 |
60.12 |
100.21 |
MEAN |
99.984 |
|
150% - 2 |
60 |
59.76 |
99.61 |
|
|
|
150% - 3 |
60 |
60.06 |
100.10 |
%RSD |
0.31 |
Table 4: Accuracy Data for Tamsulosin Hydrochloride
|
Concentration % of spiked level |
Amount added (ppm) |
Amount found (ppm) |
% Recovery |
Statistical Analysis of % Recovery |
|
|
50% - 1 |
20 |
19.95 |
99.75 |
MEAN |
99.55 |
|
50% - 2 |
20 |
20.14 |
100.7 |
|
|
|
50% - 3 |
20 |
19.64 |
98.2 |
%RSD |
1.26 |
|
100 % - 1 |
40 |
39.95 |
99.87 |
MEAN |
100.08 |
|
100 % - 2 |
40 |
40.12 |
100.3 |
|
|
|
100% - 3 |
40 |
40.03 |
100.07 |
%RSD |
0.215 |
|
150% - 1 |
60 |
59.84 |
99.73 |
MEAN |
100.45 |
|
150% - 2 |
60 |
60.84 |
101.40 |
|
|
|
150% - 3 |
60 |
60.14 |
100.23 |
%RSD |
0.85 |
Table 5: System Precision data of Dutasteride and Tamsulosin Hydrochloride
|
Sr. No |
Dutasteride |
Tamsulosin Hydrochloride |
|
1 |
2543124 |
2127335 |
|
2 |
2542791 |
2128342 |
|
3 |
2543018 |
2129324 |
|
4 |
2536270 |
2129877 |
|
5 |
2534021 |
2129856 |
|
Mean |
2539845 |
2128947 |
|
SD |
4364.582 |
1095.203 |
|
% RSD |
0.171844 |
0.051443 |
Table 6: Method Precision data of Dutasteride and Tamsulosin Hydrochloride
|
Sr. No |
Dutasteride |
Tamsulosin Hydrochloride |
|
1 |
2543206 |
2128756 |
|
2 |
2543024 |
2138677 |
|
3 |
2543108 |
2139586 |
|
4 |
2542750 |
2146874 |
|
5 |
2543186 |
2148865 |
|
6 |
2543055 |
2149576 |
|
Mean |
2543055 |
2142056 |
|
SD |
165.3825 |
8006.679 |
|
% RSD |
0.0065033 |
0.373785 |
Table 7: LOD and LOQ data of Dutasteride and Tamsulosin Hydrochloride
|
Drug Name |
LOD (µg/ml) |
LOQ (µg/ml) |
|
Dutasteride |
0.57 |
1.72 |
|
Tamsulosin Hydrochloride |
0.16 |
0.49 |
Table 8: Robustness data of Dutasteride and Tamsulosin Hydrochloride
|
Sr No |
Drug Name |
Condition |
Peak area |
% RSD |
|
1 |
Dutasteride |
Decreased Flow rate of 0.8 ml/min |
2536741 |
0.106 |
|
2 |
Increased Flow rate of 1.2 ml/min |
2553397 |
0.113 |
|
|
3 |
Tamsulosin Hydrochloride |
Decreased Flow rate of 0.8 ml/min |
2134045 |
0.184 |
|
4 |
Increased Flow rate of 1.2 ml/min |
2157001 |
0.169 |
Table 9: Assay data Dutasteride and Tamsulosin Hydrochloride
|
Sr. No |
Peak area of Dutasteride |
% Assay |
Peak area of Tamsulosin Hydrochloride |
% Assay |
|
1 |
2543124 |
100.504 |
2127335 |
98.49 |
|
2 |
2542791 |
2128342 |
||
|
3 |
2543018 |
2129324 |
||
|
4 |
2536270 |
2129877 |
||
|
5 |
2534021 |
2129856 |
CONCLUSION
The developed RP-HPLC method was validated as per ICH guidelines. All the system suitability parameters were within the range as stated by ICH guidelines. Interference peaks were not observed in blank, standard and sample chromatogram. Hence simple, precise and accurate, sensitive, specific and robust method was developed and validated. This can be used in quality control department with respect to routine analysis.
ACKNOWLEDGEMENTS:
Authors are thankful to the management of Viswanadha Institute of Pharmaceutical Sciences (VNIPS) for providing facilities and support to carry out this work.
REFERENCE


V.K.V.S.N.H.S Prakash Raju, Dr. P V Madhavi Latha, K Suvarna, Dr. P Uma Devi, Analytical Method Development and Validation for the Simultaneous Estimation of Dutasteride and Tamsulosin Hydrochloride in Bulk and Pharmaceutical Dosage forms by RP-HPLC Method, Int. J. of Pharm. Sci., 2025, Vol 3, Issue 11, 3896-3902. https://doi.org/10.5281/zenodo.17700737
 10.5281/zenodo.17700737
