Centre for Pharmaceutical Sciences, Institute of Science and Technology, Jawaharlal Nehru Technological University Hyderabad, Kukatpally, Hyderabad, 500085, Telangana, India
A simple, accurate, precise method was developed for the simultaneous estimation of the Lamivudine and Dolutegravir in pharmaceutical dosage form by RP-UPLC. Chromatogram was run through HSS C18 (2.8 x 50 mm column at a flow rate of 0.3 mL/min. Buffer used in this method was Potassium dihydrogen phosphate. Temperature was maintained at 30°C. Optimized wavelength selected was 260 nm. Retention time of Lamivudine and Dolutegravir were found to be 1.408 min and 1.739 min. The percentage RSD of the Lamivudine and Dolutegravir were and found to be 0.8 and 0.8 respectively. The percentage recovery was obtained as 100.39% and 100.37% for Lamivudine and Dolutegravir respectively. LOD, LOQ values obtained from regression equations of Lamivudine and Dolutegravir were 0.41, 1.25 and 0.09, 0.26 respectively. Retention times were decreased and the run time was decreased, so the developed method was simple, economical and effective for the routine quality control test in industries.
Lamivudine
Lamivudine is a reverse transcriptase inhibitor used to treat HIV and hepatitis B infections. Lamivudine is a synthetic nucleoside analogue and is phosphorylated intracellularly to its active 5'-triphosphate metabolite, lamivudine triphosphate (L-TP). This nucleoside analogue is incorporated into viral DNA by HIV reverse transcriptase and HBV polymerase, resulting in DNA chain termination.[1-2]
Dolutegravir
Dolutegravir is an antiviral agent used for the treatment of HIV-1 infections in combination with other antiretroviral agents. Dolutegravir is an HIV-1 antiviral agent.[3-4] It inhibits HIV integrase by binding to the active site and blocking the strand transfer step of retroviral DNA integration in the host cell. The strand transfer step is essential in the HIV replication cycle and results in the inhibition of viral activity. Dolutegravir has a mean EC50 value of 0.5 nM (0.21 ng/mL) to 2.1 nM (0.85 ng/mL) in peripheral blood mononuclear cells (PBMCs) and MT-4 cells.
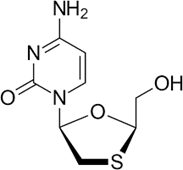
Figure 1: Structure of Lamivudine.
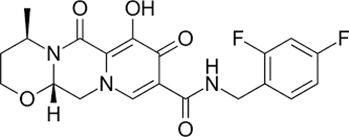
Figure 2: Structure of Dolutegravir.
A literature survey conveyed that, limited methods are available for simultaneous estimation of Lamivudine and Dolutegravir. Various HPLC, [5,6,7,8,9,10,11,12,13,14] LC/ MS/ MS, [15,16,17,18,19] HPTLC, [20,21] UV, [22,23,24] and UPLC, [25] assay methods were described within the literature regarding the estimation of lamivudine, abacavir, and a few other anti-retroviral drugs individually as well as in combination with other drugs. In view of the demand for an appropriate, cost-effective RP-UPLC method for routine analysis of Lamivudine and Dolutegravir synchronized evaluation of in pharmaceutical dose type. Attempts were made to establish easy, precise, accurate as well as cost-efficient logical method for the estimate of Lamivudine and Dolutegravir. The recommended approach will be validated according to ICH guidelines. The objective of the recommended work is to establish a brand-new, simple, delicate, exact and economical logical method as well as recognition for the Synchronized evaluation of Lamivudine and Dolutegravir in pharmaceutical dose kind by utilizing RP-UPLC. To verify the established method based on ICH standards for the desired analytical application.
MATERIALS AND METHODS
Chemicals and Reagents: Lamivudine and Dolutegravir pure drugs (API), Combination Lamivudine and Dolutegravir oral tablets (Dovato), Distilled water, Acetonitrile, Phosphate buffer, Methanol, Potassium dehydrogenate ortho phosphate buffer, Ortho-phosphoric acid. All the above chemicals and solvents are from Rankem.
Diluent: Based up on the solubility of the drugs, diluent was selected, Methanol and Water taken in the ratio of 50:50 as diluent.
Preparation of Standard stock solutions: Accurately weighed 75 mg of Lamivudine, 12.5 mg of Dolutegravir and transferred to individual 50 mL volumetric flasks separately. 3/4th of diluents was added to both of these flasks and sonicated for 10 minutes. Flasks were made up with diluents and labeled as Standard stock solution 1 and 2. (1500 µg/mL of Lamivudine and 250 µg/mL of Dolutegravir).
Preparation of Standard working solutions (100% solution): 1mL from each stock solution was pipetted out and taken into a 10mL volumetric flask and made up with diluent. (150 µg/mL Lamivudine of and 25 µg/mL of Dolutegravir).
Preparation of Sample stock solutions: 10 tablets were weighed and was transferred into a 100 mL volumetric flask, 50 mL of diluents was added and sonicated for 25 min, further the volume was made up with diluent and filtered by HPLC filters (3000 µg/mL of Lamivudine and 500 µg/mL of Dolutegravir).
Preparation of Sample working solutions (100% solution): 0.5 mL of filtered sample stock solution was transferred to 10 mL volumetric flask and made up with diluent. (150 µg/mL of Lamivudine and 25 µg/mL of Dolutegravir).
Preparation of buffer
0.01N Na2HPO4 Buffer: Accurately weighed 1.41 gm of sodium dihyrogen Ortho phosphate in a 1000 mL of Volumetric flask add about 900 mL of milli-Q water added and degas to sonicate and finally make up the volume with water.
Procedure
Inject the samples by changing the chromatographic conditions and record the chromatograms, note the conditions of proper peak elution for performing validation parameters as per ICH guidelines.
RESULTS AND DISCUSSION
Method
The developed chromatographic method was validated for system suitability, linearity accuracy, precision, ruggedness and robustness as per ICH guidelines.
System suitability parameters: To evaluate system suitability parameters such as retention time, tailing factor and USP theoretical plate count, the mobile phase was allowed to flow through the column at a flow rate of 0.3 ml/min to equilibrate the column at ambient temperature. Chromatographic separation was achieved by injecting a volume of 1 μL of standard into HSS C18 (2.6 x 50 mm, 1.6 µm), the mobile phase of composition 70% 0.01N Na2HPO4: 30% Methanol was allowed to flow through the column at a flow rate of 0.3 ml per minute. Retention time, tailing factor and USP theoretical plate count of the developed method are shown in table 1.
Table 1: System suitability parameters.
|
Sr. No. |
Lamivudine |
Dolutegravir |
Resolution |
||||
|
Inj |
RT(min) |
USP Plate Count |
Tailing |
RT(min) |
USP Plate Count |
Tailing |
|
|
1 |
1.376 |
2685 |
1.39 |
1.702 |
4512 |
1.37 |
3.1 |
|
2 |
1.385 |
2903 |
1.39 |
1.708 |
4172 |
1.42 |
3.0 |
|
3 |
1.390 |
3047 |
1.39 |
1.717 |
4553 |
1.38 |
3.1 |
|
4 |
1.391 |
2685 |
1.42 |
1.72 |
4483 |
1.39 |
3.0 |
|
5 |
1.400 |
2933 |
1.34 |
1.722 |
4448 |
1.39 |
3.0 |
|
6 |
1.408 |
2147 |
1.46 |
1.739 |
3764 |
1.46 |
2.8 |
Assay of pharmaceutical formulation: The proposed validated method was successfully applied to determine Lamivudine and Dolutegravir in their pharmaceutical dosage form. The result obtained for was comparable with the corresponding labeled amounts and they were shown in Table-2,3.
Table 2: Assay results for Lamivudine.
|
Sr. No. |
Standard Area |
Sample area |
% Assay |
|
1 |
3640080 |
3639645 |
99.46 |
|
2 |
3662158 |
3653746 |
99.85 |
|
3 |
3623764 |
3640033 |
99.48 |
|
4 |
3646966 |
3601832 |
98.43 |
|
5 |
3650353 |
3616126 |
98.82 |
|
6 |
3710141 |
3612258 |
98.72 |
|
Avg |
3655577 |
3627273 |
99.13 |
|
Stdev |
29577.7 |
20068.2 |
0.55 |
|
%RSD |
0.8 |
0.6 |
0.6 |
Table 3: Assay results for Dolutegravir.
|
Sr. No. |
Standard Area |
Sample area |
% Assay |
|
1 |
882110 |
886576 |
100.74 |
|
2 |
882532 |
888945 |
101.00 |
|
3 |
870302 |
882568 |
100.28 |
|
4 |
872703 |
880422 |
100.04 |
|
5 |
878651 |
889162 |
101.03 |
|
6 |
889046 |
887665 |
100.86 |
|
Avg |
882557 |
885890 |
100.66 |
|
Stdev |
6902.1 |
3594.3 |
0.4 |
|
%RSD |
0.8 |
0.4 |
0.4 |
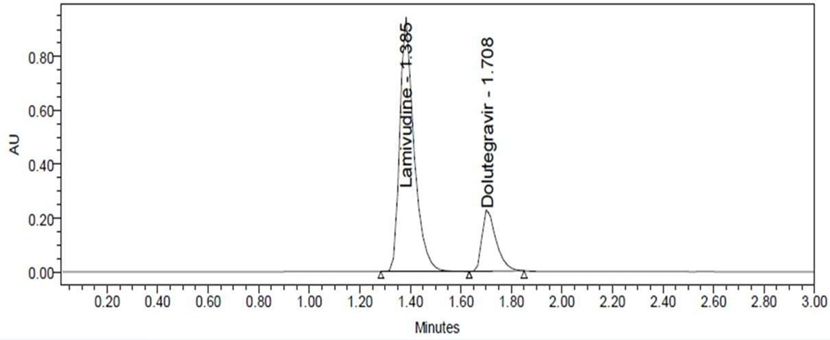
Figure 3: Standard chromatogram.
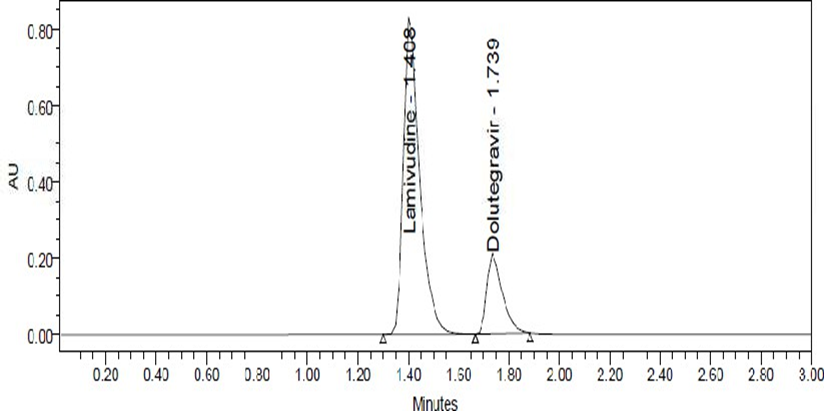
Figure 4: Sample chromatogram.
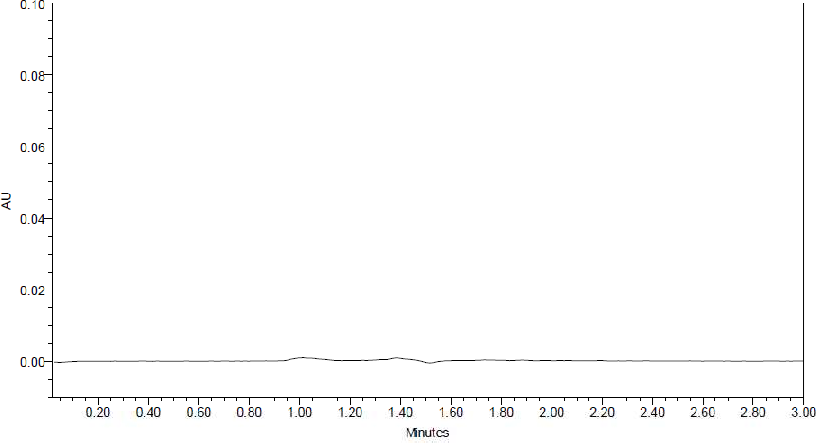
Figure 5: Blank chromatogram
Validation of Analytical method
Linearity: The linearity study was performed for the concentration of 0 µg/ml to 225 µg/ml and 0 µg/ml to 37.5 µg/ml level. Each level was injected into chromatographic system. The area of each level was used for calculation of correlation coefficient. Inject each level into the chromatographic system and measure the peak area. Plot a graph of peak area versus concentration (on X-axis concentration and on Y-axis Peak area) and calculate the correlation coefficient. The results are shown in table 4.
Table 4: Results of linearity for Lamivudine& Dolutegravir.
|
Lamivudine |
Dolutegravir |
||
|
Conc (µg/mL) |
Peak area |
Conc (µg/mL) |
Peak area |
|
0 |
0 |
0 |
0 |
|
37.5 |
922806 |
6.25 |
210556 |
|
75 |
1878662 |
12.5 |
445258 |
|
112.5 |
2712498 |
18.75 |
655630 |
|
150 |
3638097 |
25 |
872691 |
|
187.5 |
4569129 |
31.25 |
1084994 |
|
225 |
5477284 |
37.5 |
1303577 |
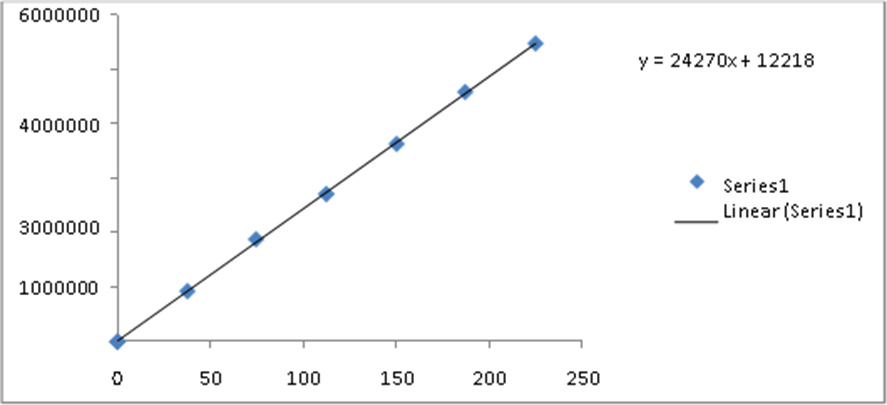
Figure 6: Linearity graph for Lamivudine.
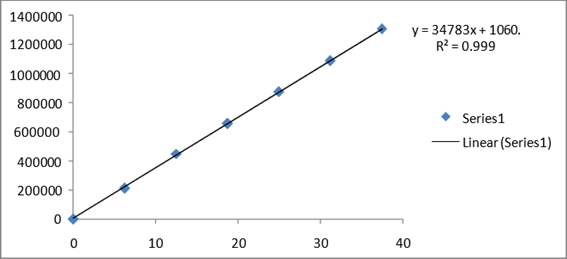
Figure 6: Linearity graph for Dolutegravir.
Accuracy studies: The accuracy was determined by help of recovery study. The recovery method carried out at three level 50%, 100%, 150% and 50%, 100%, 150% Inject the standard solutions into chromatographic system. Calculate the Amount found and Amount added for Lamivudine and Dolutegravir and calculate the individual recovery and mean recovery values. The results are shown in table 5,6.
Table 5: Showing accuracy results for Lamivudine.
|
% Level |
Amount Spiked (µg/mL) |
Amount recovered (µg/mL) |
% Recovery |
Mean %Recovery |
|
50% |
75 |
74.63 |
99.50 |
100.39% |
|
75 |
74.93 |
99.91 |
||
|
75 |
75.55 |
100.74 |
||
|
100% |
150 |
147.86 |
98.58 |
|
|
150 |
151.98 |
101.32 |
||
|
150 |
150.99 |
100.66 |
||
|
150% |
225 |
228.58 |
101.59 |
|
|
225 |
226.97 |
100.88 |
||
|
225 |
225.78 |
100.34 |
Table 6: Showing accuracy results for Dolutegravir.
|
% Level |
Amount Spiked (µg/mL) |
Amount recovered (µg/mL) |
% Recovery |
Mean %Recovery |
|
50% |
12.5 |
12.49 |
99.94 |
100.37% |
|
12.5 |
12.48 |
99.83 |
||
|
12.5 |
12.54 |
100.34 |
||
|
100% |
25 |
25.34 |
101.36 |
|
|
25 |
25.28 |
101.12 |
||
|
25 |
25.25 |
101.00 |
||
|
150% |
37.5 |
37.32 |
99.51 |
|
|
37.5 |
37.69 |
100.50 |
||
|
37.5 |
37.38 |
99.68 |
Precision Studies: Precision was calculated from Coefficient of variance for six replicate injections of the standard. The standard solution was injected for six times and measured the area for all six Injections in HPLC. The %RSD for the area of six replicate injections was found. The results are shown in table 7.
Table 7: Precision results for Lamivudine and Dolutegravir.
|
Sr. No |
Area of Lamivudine |
Area of Dolutegravir |
|
1. |
3639645 |
886576 |
|
2. |
3653746 |
888945 |
|
3. |
3640033 |
882568 |
|
4. |
3601832 |
880422 |
|
5. |
3616126 |
889162 |
|
6. |
3612258 |
887665 |
|
Mean |
3627273 |
885890 |
|
S.D |
20068.2 |
3594.3 |
|
%RSD |
0.6 |
0.4 |
Ruggedness: To evaluate the intermediate precision of the method, Precision was performed on different day. The standard solution was injected for six times and measured the area for all six injections in UPLC. The %RSD for the area of six replicate injections was found. The results are shown in table 8.
Table 8: Ruggedness results of Lamivudine and Dolutegravir.
|
Sr. No |
Area of Lamivudine |
Area of Dolutegravir |
|
1. |
3582461 |
868029 |
|
2. |
3575456 |
865657 |
|
3. |
3603542 |
873452 |
|
4. |
3573254 |
859756 |
|
5. |
3580782 |
864018 |
|
6. |
3587303 |
856778 |
|
Mean |
3583800 |
864615 |
|
S.D |
10897.3 |
5936.6 |
|
%RSD |
0.3 |
0.7 |
Robustness: As part of the Robustness, deliberate change in the Flow rate, Mobile Phase composition, Temperature Variation was made to evaluate the impact on the method. The flow rate was varied at 0.2 ml/min to 0.4 ml/min. The results are shown in table 9.
Table 9: Robustness results of Dolutegravir by RP-UPLC.
|
Sr. No. |
Condition |
% RSD of Lamivudine |
% RSD of Dolutegravir |
|
1 |
Flow rate (-) 0.2 mL/min |
0.7 |
1.0 |
|
2 |
Flow rate (+) 0.4 mL/min |
0.3 |
0.5 |
|
3 |
Mobile phase (-) 75B:25M |
0.2 |
0.4 |
|
4 |
Mobile phase (+) 65B:35M |
0.7 |
1.1 |
|
5 |
Temperature (-) 25°C |
0.1 |
0.1 |
|
6 |
Temperature (+) 35°C |
0.2 |
0.7 |
LOD and LOQ: The sensitivity of RP-UPLC was determined from LOD and LOQ. Which were calculated from the calibration curve using the following equations as per ICH guidelines. The results are shown in table 10.
LOD = 3.3σ/S and
LOQ = 10 σ/S,
where
σ= Standard deviation of y intercept of regression line,
S = Slope of the calibration curve
Table 10: LOD, LOQ of Lamivudine and Dolutegravir.
|
Molecule |
LOD |
LOQ |
|
Lamivudine |
0.41 |
1.25 |
|
Dolutegravir |
0.09 |
0.26 |
CONCLUSION
The Developed UPLC method was validated and it was found to be simple, precise, accurate and sensitive for the simultaneous estimation of Lamivudine and Dolutegravir in its pure and pharmaceutical dosage form. Hence, this method can easily and conveniently adopt for routine quality control analysis of Dolutegravir and Lamivudine in its pure and pharmaceutical dosage form.
REFERENCES

Poluri Lakshmi Anusha, Dr. M. Ajitha, Development and Validation of RP-UPLC Method for Simultaneous Determination of Lamivudine and Dolutegravir in Combined Dosage Forms, Int. J. of Pharm. Sci., 2025, Vol 3, Issue 11, 469-477. https://doi.org/10.5281/zenodo.17521566
 10.5281/zenodo.17521566
