Department of Chemical Technology, Dr Babasaheb Ambedkar Marathwada University, Chhatrapati Sambhajinagar 431004
Imeglimin Hydrochloride, a novel oral antidiabetic drug belonging to the ‘glimin’ class, has shown promising results in the treatment of type 2 diabetes mellitus (T2DM). A rapid, simple, and validated reversed-phase high-performance liquid chromatography (RP-HPLC) method was developed for the quantification of Imeglimin Hydrochloride in bulk and tablet dosage forms. The method employed a Shimadzu C18 (150 x 4.6 mm, 5 µm) with an isocratic mobile phase of Methanol : OPA buffer (0.05%) in the ratio of 55:45 v/v at a flow rate of 1.0 mL/min. Detection was performed at 240 nm, and the retention time was observed at 3.728 minutes. The method was validated according to ICH Q2(R1) guidelines for parameters including specificity, linearity, accuracy, precision, robustness, limit of detection (LOD), and limit of quantification (LOQ). Linearity was established in the range of 5–25 µg/mL (R² = 0.9909). LOD and LOQ were found to be 0.02 µg/mL and 0.05 µg/mL, respectively. The method proved to be accurate (mean recovery 99.90% to 101.63%) and precise (RSD < 2%). This validated method can be applied for routine quality control analysis of Imeglimin Hydrochloride in pharmaceutical dosage forms.
Imeglimin Hydrochloride is the first tetrahydro-triazine-containing antidiabetic drug to receive approval. It enhances glucose uptake in skeletal muscle, restores insulin secretion, and improves mitochondrial function [1, 2]. Chemically, it is (6R)-(+)-4-dimethylamino-2-imino-6-methyl-1,2,5,6-tetrahydro-1,3,5-triazine hydrochloride, with a molecular weight of 191.66 g/mol, Melting Point of 223-225°C, with pKa Value of 10.21. Imeglimin hydrochloride is soluble in organic solvent such as ethanol, Dimethyl Sulfoxide (DMSO) and methanol. Freely soluble in acetone, sparingly soluble in ethyl acetate [3].
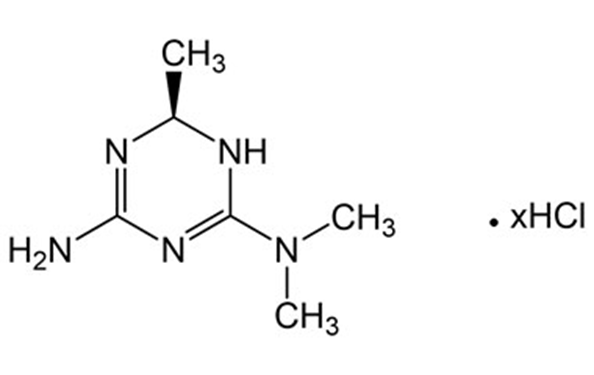
Figure 1 Chemical Structure of Imeglimin Hydrochloride
Imeglimin hydrochloride has been accepted as a beneficial oral antidiabetic agent [4]. The increasing use of Imeglimin hydrochloride in the market has led to the need for more efficient and rapid analytical methods [5, 6, 7]. Method development involves designing an analytical procedure tailored for a specific application, whereas method validation confirms that the developed procedure performs reliably and is appropriate for its intended analytical purpose [8, 9]. Among the available analytical techniques, HPLC remains the gold standard due to its sensitivity, reproducibility, and precision [10, 11]. The objective of the present work was to develop and validate a RP-HPLC method for the quantification of Imeglimin Hydrochloride in bulk and tablet dosage forms, in accordance with ICH guidelines [12]. The developed method will be helpful for other researchers and manufacturers.
MATERIALS AND METHODS
Chemicals and reagent:
Imeglimin Hydrochloride API was obtained by Alkem Private Ltd. Mumbai. Imeglimin Hydrochloride 500 mg tablet of Zyuds Healthcare Ltd. Purchased from local vendor. HPLC grade Methanol and Water were procured from Merck, Ortho-Phosphoric acid (OPA) from Rankem.
Instrumentation:
The analysis was carried out on a Shimadzu Quaternary gradient HPLC system (P-Series) HPLC system equipped with an Shimadzu SPD-M40 Photodiode Array Detector and Manual injector (20 µL loop). Data acquisition was performed using Lab Solution (Version DB 6.110) software. A UV-Visible spectrophotometer (Shimadzu: 1780 Double Beam Spectrophotometers) was used to determine the λmax. Analytical Balance (Shimadzu Model: AUW220D) and Bath Ultrasonicator (Model 5.5L-150H).
Chromatographic conditions:
Table 1: Optimised Chromatographic Conditions
|
Separation variable |
Optimized conditions |
|
Mobile Phase |
Methanol : OPA buffer (0.05%) (55:45 v/v) |
|
Column |
Shimadzu C18 (150 x 4.6 mm, 5 µm) |
|
Detector |
Shimadzu SPD-M40 Photodiode Array |
|
Software |
Lab Solution (Version DB 6.110) |
|
Detection Wavelength |
240 nm |
|
Flow Rate |
1.0 mL/min |
|
Injection Volume |
20 µL |
|
Temperature |
20°C |
|
Type of elution |
Isocratic |
|
Run time |
15 min |
|
Retention time |
3.728 |
Preparation of OPA (0.5%) buffer:
Accurately measured 0.5 mL of ortho-phosphoric acid (OPA) was transferred into a 100 mL volumetric flask, and the volume was made up to the mark with HPLC-grade water. The solution was then sonicated for 20 minutes to ensure proper mixing and degassing.
Preparation of mobile phase:
The working mobile phase was prepared by mixing Methanol and 0.5% Ortho-phosphoric acid (OPA) buffer in a ratio of 55:45 (v/v).
Preparation of standard solutions (1000 µg/ml):
Accurately weighed 10 mg of Imeglimin Hydrochloride was transferred into a 10 mL volumetric flask, dissolved in a small quantity of mobile phase, and the volume was made up to the mark with the same mobile phase. The prepared stock solution was filtered via a 0.45 μm nylon membrane syringe filter.
Working Solutions for Calibration (5–25 µg/mL):
From the above stock solution, 1 mL was transferred into a 10 mL volumetric flask and diluted to volume with the mobile phase to obtain a working solution of 100 µg/mL. From this working solution, aliquots of 0.5, 1.0, 1.5, 2.0, and 2.5 mL were transferred into separate 10 mL volumetric flasks and diluted to volume with the mobile phase to yield calibration standards of 5, 10, 15, 20, and 25 µg/mL, respectively.
Preparation of sample solutions:
Ten tablets of Imeglimin Hydrochloride (500 mg) were weighed, triturated, and a portion equivalent to 50 mg of the drug was dissolved in 25 mL mobile phase, sonicated for 15 minutes, and made up to 50 mL with the mobile phase (final concentration: 1000 µg/mL). Appropriate dilutions were made for analysis.
Method validation:
The method was validated according to the International Conference on Harmonisation (ICH) guidelines Q2(R1).
Accuracy
Accuracy represents how close the experimental results are to the true or reference values. Accuracy of the method was obtained by performing recovery studies by the standard addition method at different levels of pure standard drug i.e., 80%, 100% and 120% of Imeglimin Hydrochloride, to previously analyzed tablet powder sample and mixtures were reanalyzed by the proposed method. From the amount of drug found percentage recovery was calculated [13].
Precision
The precision of the developed analytical method was evaluated through intra-day (repeatability) and inter-day (intermediate) studies. Repeatability was assessed by analyzing three concentrations of the drug three times within the same day (morning, afternoon, and evening). Inter-day precision was determined by analyzing the same concentrations on three consecutive days. The results of both intra-day and inter-day studies were expressed as percentage relative standard deviation (%RSD) [14].
Linearity
Linearity evaluates whether the analytical signal shows a proportional increase with the analyte concentration across the studied range [15]. The linearity of the method was evaluated by constructing a calibration curve for Imeglimin Hydrochloride in the concentration range of 5–25 µg/mL. Peak area was plotted against concentration for each calibration standard, and linear regression analysis was performed to assess linearity.
Specificity
The specificity of method was determined by comparing the chromatogram obtained from bulk drug with that of marketed formulation no excipients interference was found, thus method was found to be specific [16].
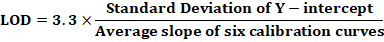
Limit of Detection (LOD) and Limit of Quantification (LOQ)
The Limit of Detection (LOD) refers to the smallest concentration of analyte that can be identified, though not quantified with precision, The LOD was calculated as
LOD=3.3×Standard Deviation of Y-interceptAverage slope of six calibration curves
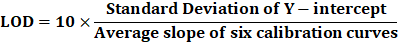
Whereas the smallest amount of sample that can be accurately quantified is known as the Limit of Quantification (LOQ). The LOQ was calculated as
LOD=10×Standard Deviation of Y-interceptAverage slope of six calibration curves
Robustness
Robustness was assessed by evaluating the method’s consistency under routine conditions and after introducing small deliberate variations in parameters like flow rate, pH, and detection wavelength. Robustness was assessed using the % RSD and the percent recovery [17, 18].
RESULTS AND DISCUSSION
Several mobile phase compositions were investigated, including Methanol: 0.5% OPA in ratios of 80:20, 75:25, 70:30, 60:40, and 55:45 (v/v), at different wavelengths based on the literature survey. Imeglimin Hydrochloride was found to be soluble in organic solvents such as methanol, acetonitrile, DMSO, and water. Considering solubility and chromatographic performance, the final method was developed using Methanol: 0.5% OPA (55:45, v/v) as the mobile phase, with the same composition used as diluent.
Trials on different compositions:
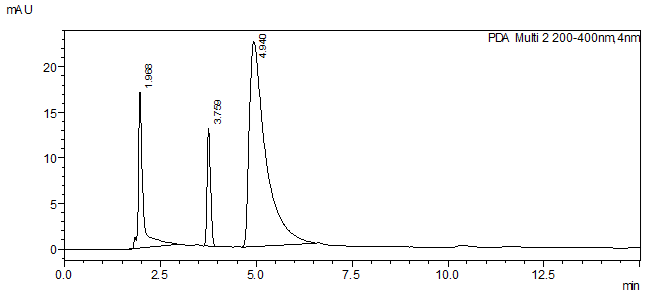
Figure 2 Chromatogram of Trial
Remarks: Peak shape was not proper; method was not found suitable.
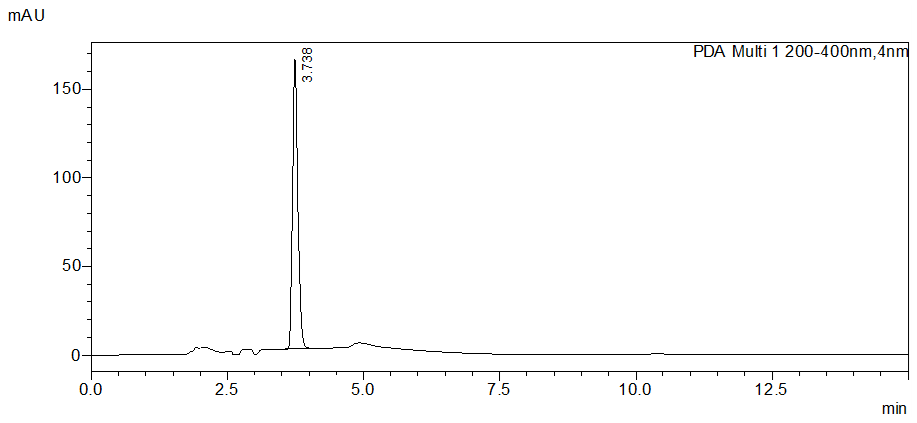
Figure 3 Chromatogram of selected method
|
Ret. Time |
Area |
Height |
NTP(USP) |
HETP(USP) |
Tailing F. |
|
3.738 |
1113737 |
163235 |
5705 |
26.294 |
1.273 |
Remarks: In this trial the retention time of Imeglimin Hydrochloride was observed at 3.738 min and peak was sharp, well-shaped and symmetrical using this system. Hence this trial considered as optimized trial from all the trial for further analysis.
METHOD VALIDATION
Linearity:
The calibration curves were plotted for each concentration range. Linearity was determined for Imeglimin Hydrochloride in the range of 5 - 25μg/ml. The regression equation for the calibration curve of Imeglimin Hydrochloride was found to be r2 = 0.9909. A linear relationship was observed between concentration and response for the drug. The regression equation was,
y = 56678x + 651929
R² = 0.9909
Linearity Study
Table 2 Linearity of Imeglimin Hydrochloride
|
Sr No. |
Conc. (µg/ml) |
AUC-1 |
AUC 2 |
AUC 3 |
Average |
SD |
% RSD |
|
1 |
5 |
986299 |
986385 |
986531 |
986405.000 |
117.2860 |
0.01189 |
|
2 |
10 |
1161657 |
1161876 |
1161987 |
1161840.000 |
167.9196 |
0.014453 |
|
3 |
15 |
1495973 |
1494988 |
1495839 |
1495600.000 |
534.2256 |
0.03572 |
|
4 |
20 |
1764171 |
1765005 |
1764982 |
1764719.333 |
475.0098 |
0.02692 |
|
5 |
25 |
2101863 |
2101965 |
2101898 |
2101908.667 |
51.8298 |
0.00247 |
|
Average %RSD = 0.01829 |
|||||||
Calibration curve for Imeglimin Hydrochloride.
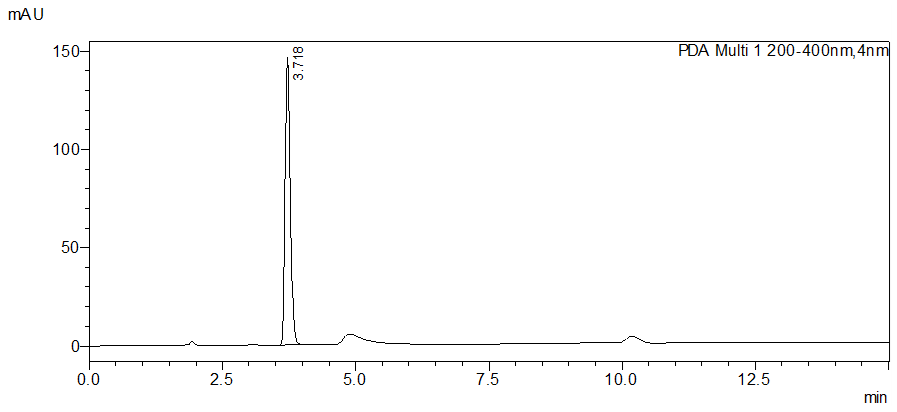
Figure 4 Chromatogram of Imeglimin HCl for linearity at Concentration 05 µg/ml.

Figure 5 Chromatogram of Imeglimin HCl for linearity at Concentration 10 µg/ml.
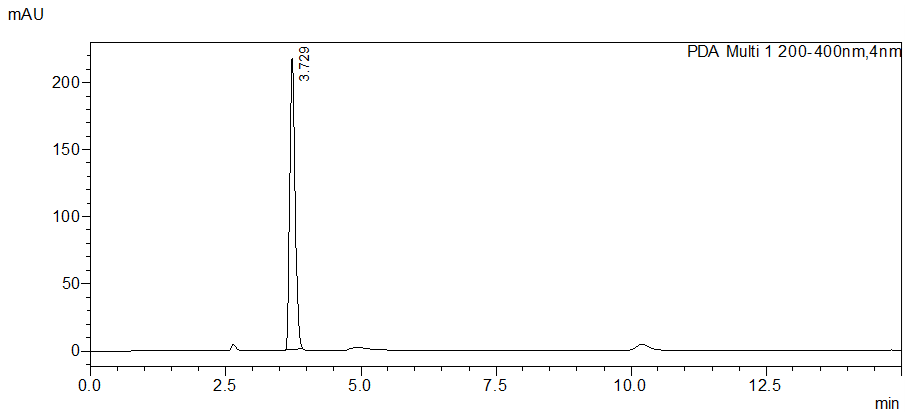
Figure 6 Chromatogram of Imeglimin HCl for linearity at Concentration 15 µg/ml
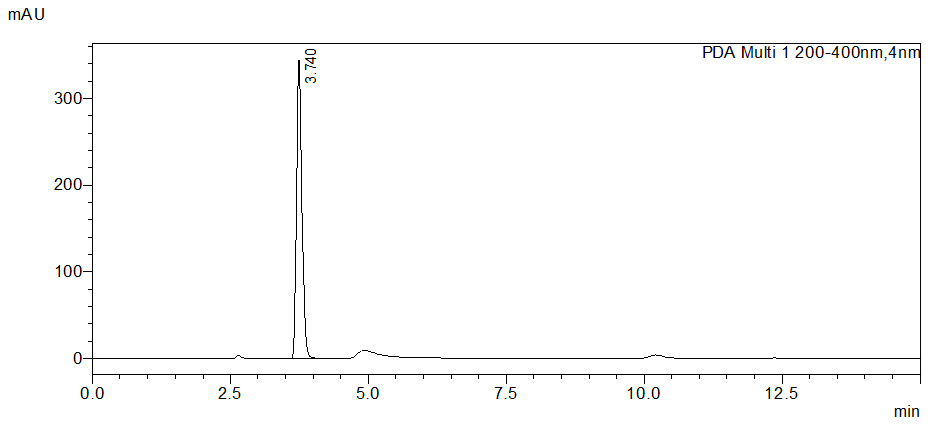
Figure 7 Chromatogram of Imeglimin HCl for linearity at Concentration 20 µg/ml
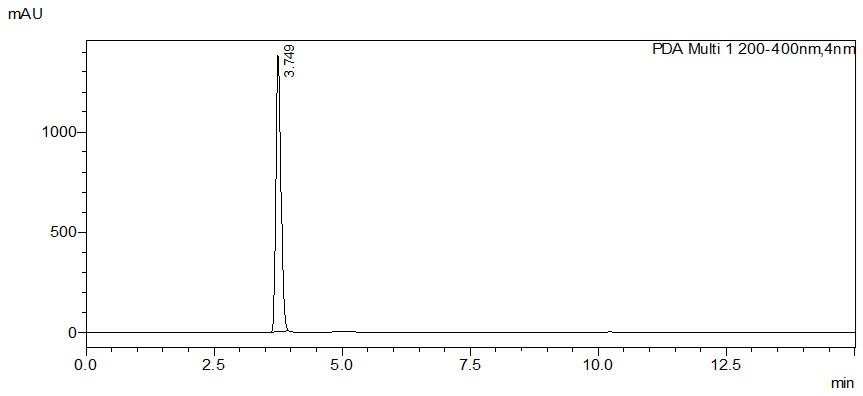
Figure 8 Chromatogram of Imeglimin HCl for linearity at Concentration 25 µg/ml
Limit of detection and limit of quantification:
The LOD and LOQ of Imeglimin Hydrochloride by the proposed methods were determined using Calibration standards. LOD and LOQ values were calculated as 3.3 SD/d and 10 SD/d respectively, where d is the slope of the calibration curve and SD is the standard deviation.
LOD = 3.3 SD/D
LOQ = 10 SD/D
Where,
D = slope of the calibration curve
SD= standard deviation
|
LOD |
LOQ |
|
0.02 µg/mL |
0.05 µg/mL |
Robustness:
The robustness study results were within the acceptance range represented in table 3 and 4 indicated the samples solution 10 µg/ml shows the correct AUC, number of theoretical plate (NTP), Height equivalent to theoretical plate (HETP) and retention time by using two variable like Change in flow rate and change in wavelength, The robustness study was carried out by determining effect of small variation in Change in wavelength (238 nm & 242 nm) i.e., + 2 nm: Change in flow rate i.e., ± 0.1 ml/min (0.9 ml/min & 1.1 ml/min).
Table 3 Robustness change in wavelength.
|
Change in wavelength |
238 |
240 |
242 |
|
AUC |
1141452 |
1141432 |
1141475 |
|
NTP |
6074 |
6080 |
6068 |
|
HETP |
24.695 |
24.698 |
24.688 |
Chromatogram of change in wavelength (± 2nm).
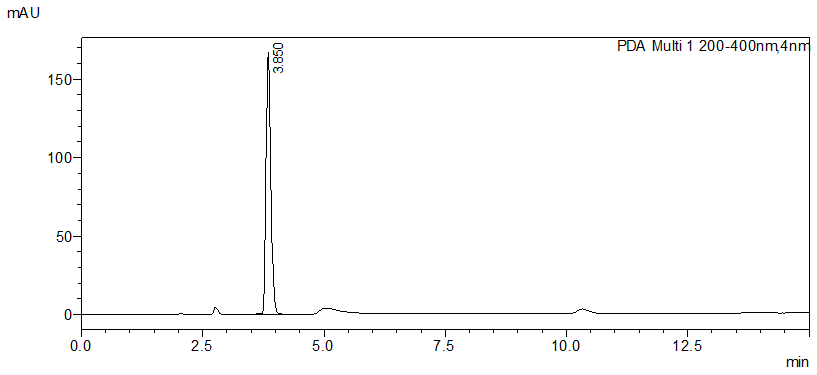
Figure 9 Chromatogram of Imeglimin HCl for robustness at wavelength 238nm (-2nm)

Figure 10 Chromatogram of Imeglimin HCl for robustness at wavelength 242nm (+ 2nm)
Change in flow rate (0.9 ml/min & 1.1 ml/min).
Table 4 Robustness Change in flow rate at 0.9 ml/min and 1.1 ml/min.
|
Change in wavelength |
1 ml |
0.9 ml |
1.1 ml |
|
AUC |
1141452 |
1141439 |
1141461 |
|
NTP |
6074 |
6073 |
6076 |
|
HETP |
24.695 |
24.701 |
24.683 |

Figure 11 Chromatogram of Imeglimin HCl for robustness at flow rate 0.9 ml/min (-0.1ml/min).
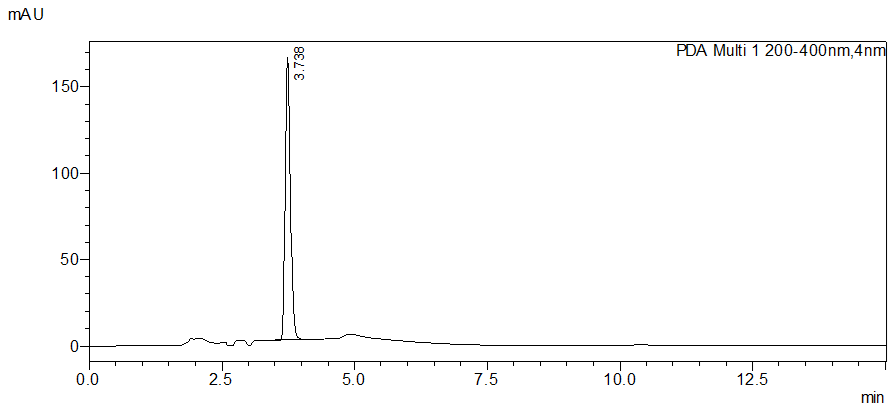
Figure 12 Chromatogram of Imeglimin HCl for robustness at flow rate 1.1 ml/min (+ 0.1ml/min).
Precision:
The intra-day and inter-day precision study as showed in Table 5 and 6 of the developed method confirmed adequate sample stability and method reliability where all the RSDs were ? 2%.
Time 10:00 am, 2.00 pm and 5.00 pm.
Table 5 Intraday precision at time 10:00 am, 2:00 pm, 5:00 pm.
|
Conc. In µg/ml |
AUC |
Mean |
SD |
% RSD |
||
|
|
10:00 AM |
2:00 PM |
5:00 PM |
|||
|
10 |
1141452 |
1141446 |
1141450 |
1141449.333 |
3.055 |
0.000 |
|
15 |
1495973 |
1495978 |
1495971 |
1495974.000 |
3.606 |
0.000 |
|
20 |
1764171 |
1764163 |
1764167 |
1764167.000 |
4.000 |
0.000 |
|
|
Average RSD |
0.000245 |
||||
Table 6 Inter day precision at three different days.
|
Conc. in µg/ml |
AUC |
Mean |
SD |
% RSD |
||
|
|
DAY 1 |
DAY 2 |
DAY 3 |
|||
|
10 |
1141452 |
1141461 |
1141411 |
1141441.333 |
26.652 |
0.002 |
|
15 |
1495973 |
1495967 |
1495964 |
1495968.000 |
4.583 |
0.000 |
|
20 |
1764171 |
1764169 |
1764165 |
1764168.333 |
3.055 |
0.000 |
|
|
Average RSD |
0.000938 |
||||
Accuracy:
Accuracy of the method was obtained by performing recovery studies by the standard addition method (Spiking) at different levels of pure standard drug i.e., 80%, 100% and 120% of Imeglimin Hydrochloride. From the amount of drug found percentage recovery was calculated. Results within the range of 99.90–101.63 % ensure an accurate method given in table 7.
Table 7 Accuracy of Imeglimin HCl at the spiking of 80, 100, and 120% for concentration of 10, 15, 20 μg/ml
|
Sr. No. |
Drug Conc. (μg/ml) |
Addition (μg/ml) |
spike solution (μg/ml) |
AUC of STD Solution |
AUC of spike solution |
Average AUC of spike solution |
Average Spike Solution Recovery |
% Recovery |
SD |
% RSD |
|
1 |
10 |
8 |
18 |
1141452 |
2054613 |
2054439 |
17.99848 |
99.99 |
205.6793621 |
0.010011 |
|
2 |
10 |
10 |
20 |
1141446 |
2282904 |
2315279 |
20.28363 |
101.42 |
56837.80334 |
2.454901 |
|
3 |
10 |
12 |
22 |
1141450 |
2511194 |
2511171 |
21.9998 |
100.00 |
55.19359866 |
0.002198 |
|
4 |
15 |
12 |
27 |
1495973 |
2692654 |
2693660 |
27.01009 |
100.04 |
120.2538981 |
0.004464 |
|
5 |
15 |
15 |
30 |
1495978 |
2991946 |
3040654 |
30.48839 |
101.63 |
35276.01921 |
1.160146 |
|
6 |
15 |
18 |
33 |
1495971 |
3291140 |
3325848 |
33.34801 |
101.05 |
57576.27617 |
1.731176 |
|
7 |
20 |
16 |
36 |
1764171 |
2095507 |
2095442 |
35.99888 |
100.00 |
3553.515302 |
0.169583 |
|
8 |
20 |
20 |
40 |
1764163 |
2328342 |
2325907 |
39.95817 |
99.90 |
4249.28088 |
0.182693 |
|
9 |
20 |
24 |
44 |
1764167 |
2561176 |
2561216 |
44.00069 |
100.00 |
37.80652501 |
0.001476 |
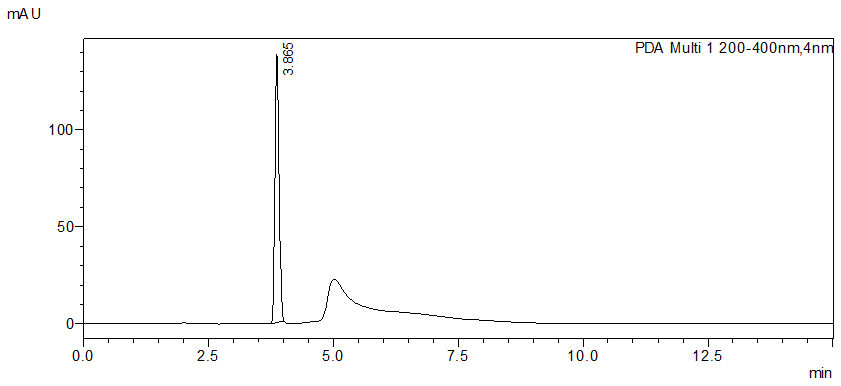
Figure 13 Chromatogram of Accuracy of method using 10 μg/ml with Spike Concentration 80%
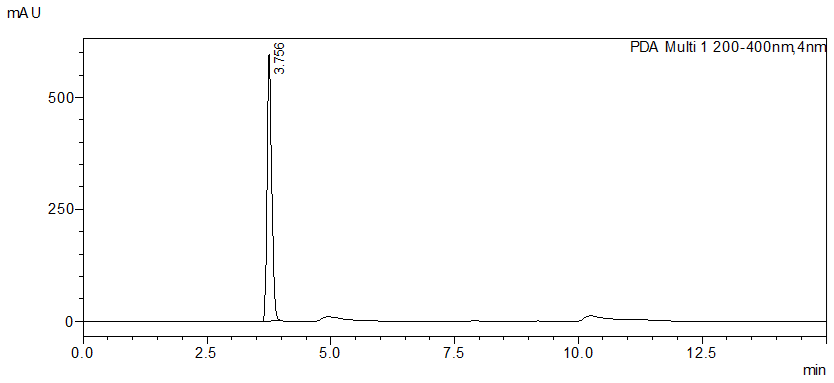
Figure 14 Chromatogram of Accuracy of method using 10 μg/ml with Spike Concentration 100%
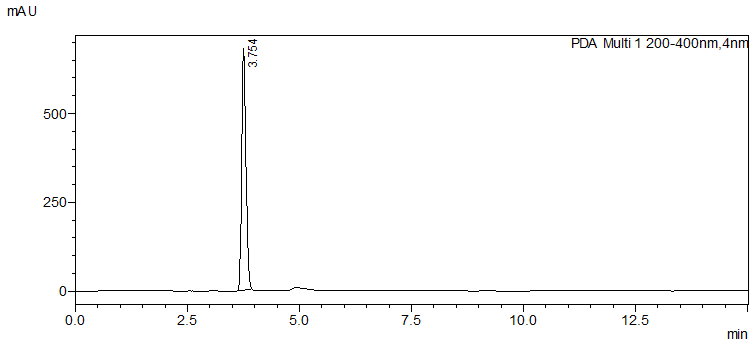
Figure 15 Chromatogram of Accuracy of method using 10 μg/ml with Spike Concentration 120%
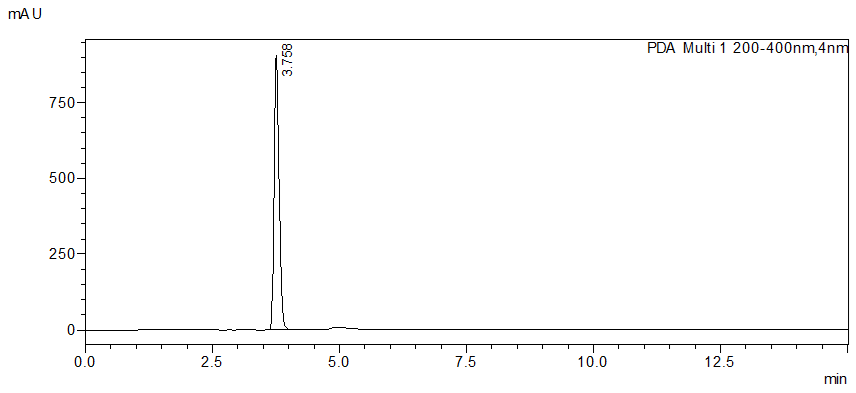
Figure 16 Chromatogram of Accuracy of method using 15 μg/ml with Spike Concentration 80%
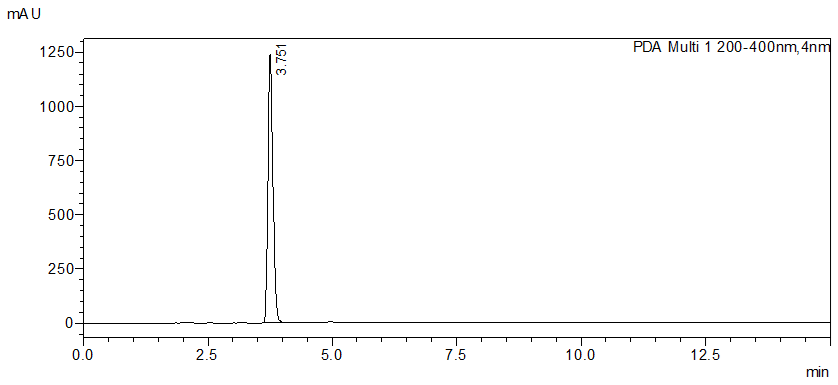
Figure 17 Chromatogram of Accuracy of method using 15 μg/ml with Spike Concentration 100%
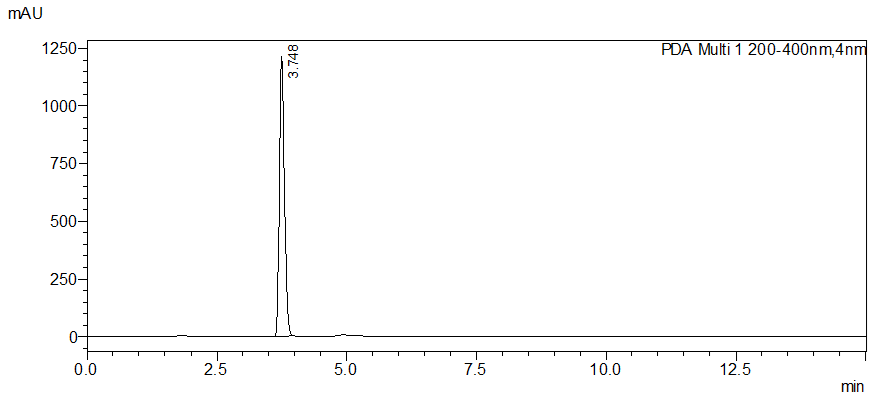
Figure 18 Chromatogram of Accuracy of method using 15 μg/ml with Spike Concentration 120%
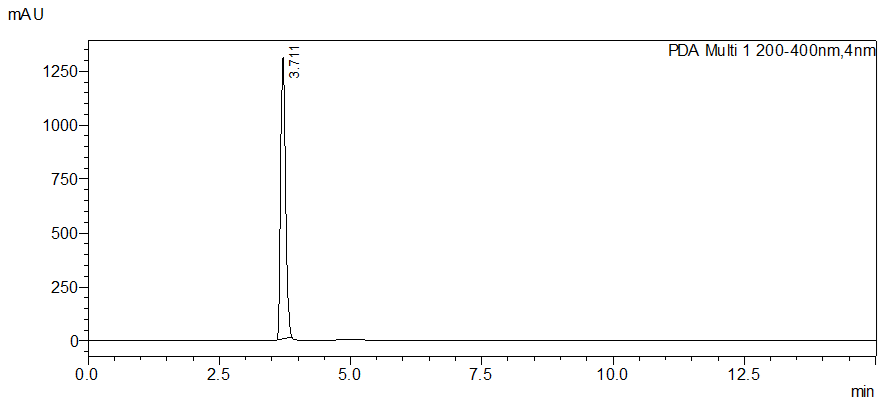
Figure 19 Chromatogram of Accuracy of method using 20 μg/ml with Spike Concentration 80%
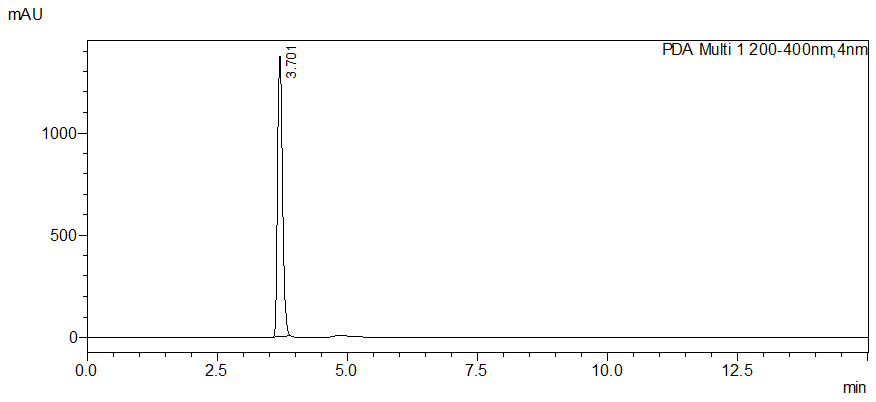
Figure 20 Chromatogram of Accuracy of method using 20 μg/ml with Spike Concentration 100%
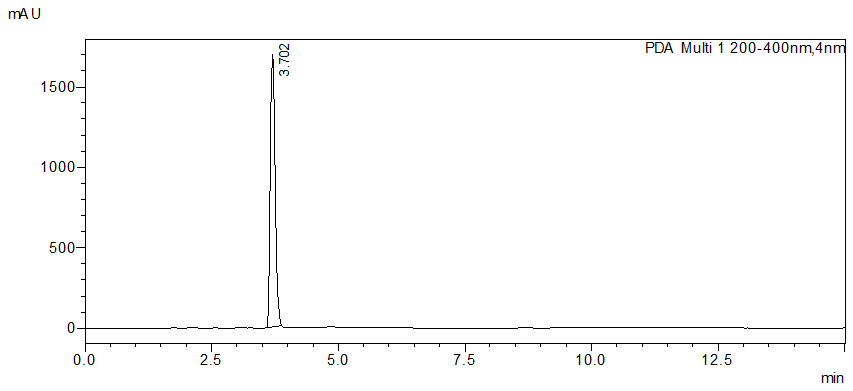
Figure 21 Chromatogram of Accuracy of method using 20 μg/ml with Spike Concentration 120%
Table 8 Summary of validation parameter by HPLC.
|
Parameter |
Data for Imeglimin Hcl |
|
Linearity |
5 - 25 µg |
|
Line of Correlation |
y = 57083x + 641807 |
|
Regression Coefficient (R²) |
0.9909 |
|
Retention time |
3.728 min |
|
Limit of Detection (µg/ml) |
0.02 μg/mL |
|
Limit of Quantification (µg/ml) |
0.05 μg/mL |
|
Accuracy (% Mean recovery) |
100% |
|
Intra-day precision (%RSD) |
10 µg/ml = 0.00% 15 µg/ml = 0.00% 20 µg/ml = 0.00% |
|
Inter-day precision (%RSD) |
10 µg/ml = 0.02% 15 µg/ml = 0.00% 20 µg/ml = 0.00% |
|
Robustness |
Robust |
|
System suitability |
System suitable |
The developed method provided a sharp and symmetrical peak for Imeglimin Hydrochloride with a retention time of 3.728 minutes, demonstrating rapid elution compared to reported methods. The system suitability parameters including theoretical plates (>2000) and tailing factor (<2) confirmed the efficiency of the chromatographic system.
Linearity was established in the concentration range of 0.5 - 25 µg/mL with an excellent correlation coefficient (R² = 0.9909), indicating the method’s suitability for quantitative applications. Precision studies demonstrated %RSD values of 0.000245% (intra-day) and 0.000938% (inter-day), well within the acceptance limits (<2%).
Accuracy was validated by recovery studies at three different concentration levels, yielding recoveries between 99.90% and 101.63%, confirming that the method is accurate. LOD and LOQ values of 0.02 µg/mL and 0.05 µg/mL, respectively, indicate the high sensitivity of the method.
Robustness testing under minor deliberate variations in flow rate and wavelength showed no significant changes in retention time or peak area, proving the reliability of the method for routine analysis. Overall, the developed method is rapid, sensitive, and highly reproducible, making it suitable for quality control of bulk and formulated Imeglimin Hydrochloride.
CONCLUSION
A simple, rapid, and validated RP-HPLC method was successfully developed for the quantification of Imeglimin Hydrochloride in bulk and tablet dosage forms. The method met all validation parameters as per ICH Q2(R1) guidelines, proving to be specific, precise, accurate, sensitive, and robust. Its short run time and high sensitivity make it advantageous for routine quality control and stability studies of Imeglimin Hydrochloride.
ACKNOWLEDGMENT
The authors are thankful to the University Department of Chemical Technology and Y.B. Chavan College of Pharmacy, Dr. Babasaheb Ambedkar Marathwada University, Aurangabad, Maharashtra, for providing the laboratory facilities and instrumentation support to carry out this research work. The authors also extend their gratitude to Alkem Private Ltd., Mumbai, for kindly providing the Imeglimin Hydrochloride API sample.
Author Contributions
Funding: This research received no external funding.
Data Availability Statement: All data generated or analyzed during this study are included in this published article.
REFERENCES


Shahed Shaikh, Preeti Sable, Sushama Vaishnav, Pravin Wakte, Development and Validation of a New Reverse Phase - High Performance Liquid Chromatography Method for Quantification of Imeglimin Hydrochloride, Int. J. of Pharm. Sci., 2025, Vol 3, Issue 10, 2719-2733. https://doi.org/10.5281/zenodo.17442583
 10.5281/zenodo.17442583
