Department of Pharmacy, School of Pharmacy, Sharda University, Greater Noida, 201310, Uttar Pradesh, India.
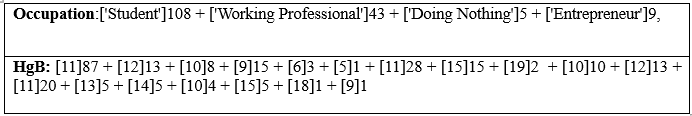
Factors influencing haemoglobin levels in diverse populations include blood group, age, gender, inherited variants, and lifestyle habits such as smoking and alcohol consumption. This study explores how these factors impact haemoglobin concentrations. Data from a sample population showed variations in haemoglobin levels based on different parameters, providing insights into the complex interplay of factors affecting haemoglobin levels. The methodology has been used data was collected from a diverse population, including information on blood group, age, gender, lifestyle habits, and medical history. Statistical analysis was conducted to assess the relationship between these factors and haemoglobin levels. Questionnaires and medical records were utilized as system devices to gather the necessary data, The results revealed significant associations between certain factors and haemoglobin levels. Blood group O+ positive individuals exhibited higher parasite density and oxidative stress levels compared to other blood groups. Age, gender, and lifestyle habits like smoking and alcohol consumption also showed correlations with haemoglobin concentrations.
Haemoglobin is a protein found in red blood cells that gives blood its red colour and has many bodily functions. Normal levels of haemoglobin need to be maintained for proper bodily functions. Abnormal levels of haemoglobin can indicate a health problem [1]. Hemoglobinopathies are a group of inherited blood disorders characterized by compromised haemoglobin function. Mutations in globin genes can result in various hemoglobinopathies (Gasim Dobie et.al 2017), ranging from mild to severe phenotypes. Diagnostic approaches and screening methods have been developed for prenatal and postnatal detection of hemoglobinopathies. Therapeutic strategies, such as transfusion and genome editing, are being explored for the treatment of hemoglobinopathies [2-6]. Haemoglobin levels are impacted by blood group. Individuals with blood group A have higher parasite density and malonaldehyde (MDA) levels, indicating increased oxidative stress, compared to those with blood group B and O [7]. Additionally, individuals with blood group A have lower superoxide dismutase (SOD) and haemoglobin (Hb) levels compared to those with blood group B and O [8]. Furthermore, individuals in the age group of 18-21 years have higher parasite density and MDA levels, but higher SOD levels compared to other age groups [9]. Males have higher parasite density and MDA levels compared to females [10]. Inherited haemoglobin variants, such as Hb AC, and glucose 6-phosphate dehydrogenase disorder (G6PDd) can also impact haemoglobin levels in stored blood [11]. Smoking and alcohol consumption can also influence haemoglobin concentrations, with female smokers and heavy alcohol consumers having higher haemoglobin levels.
Methodology
Data was gathered from a diverse population including blood group, age, gender, lifestyle habits, and medical history.Data Collection Tools was used as Questionnaires and medical records. Statistical Analysis was used as Conducted to assess the relationships between the identified factors and hemoglobin levels.
Discussion
The findings underscore the multifactorial nature of haemoglobin regulation in diverse populations. Understanding how blood group, age, gender, inherited variants, and lifestyle factors influence haemoglobin levels is essential for effective management and treatment of conditions related to hemoglobinopathies. Further research into personalized approaches considering these factors is warranted to tailor interventions for individuals with specific haemoglobin level considerations. Additionally, promoting awareness and education on anaemia and related policies can enhance public health initiatives aimed at optimizing haemoglobin levels in diverse populations.

Figure number 1a and 2b
From figure number 1a that pie chart depicts the distribution of hemoglobin (Hb) levels in a population, measured in grams per deciliter (g/dL). The different segments of the pie chart are color-coded to represent various ranges of hemoglobin levels:
Below 6 g/dL: This category is not explicitly labeled with a percentage on the chart.
6-8 g/dL (Red): Represents 15.6% of the population.
8-10 g/dL (Orange): Represents 16.8% of the population.
11-14 g/dL (Green): Represents 64.7% of the population.
15-18 g/dL (Purple): Represents 3.0% of the population (assuming this is the small unlabeled segment).
19-20 g/dL (Blue): This category is not explicitly labeled with a percentage on the chart. The majority of the population (64.7%) has hemoglobin levels in the range of 11-14 g/dL, which likely represents normal or healthy levels for most adults. Smaller proportions of the population have hemoglobin levels in the ranges of 6-8 g/dL (15.6%) and 8-10 g/dL (16.8%), which could indicate various degrees of anemia. There is also a very small percentage of individuals with significantly higher hemoglobin levels, indicating a possible polycythemia condition or other underlying health issues.
From figure number 2b that The pie chart
represents the distribution of blood groups in a population. Each segment of the pie chart is color-coded to correspond to a specific blood group:
B+ (Blue): Represents 32.3% of the population.
B-(Orange): Represents 16.2% of the population.
A+ (Green): Represents a very small segment, presumably around 1-2%.
O+(Purple): Represents 31.7% of the population.
O- (Yellow): Represents around 1-2% of the population.
AB+ (Pink): Represents 13.8% of the population.
AB-(Light Green): Represents a very small segment, presumably around 1-2%.So, chart shows that the most common blood groups in the population are B+ and O+, making up 32.3% and 31.7% respectively. Blood groups B- and AB+ also have notable representations at 16.2% and 13.8%, respectively. The blood groups A+, O-, and AB- each represent a small fraction of the population, around 1-2?ch.
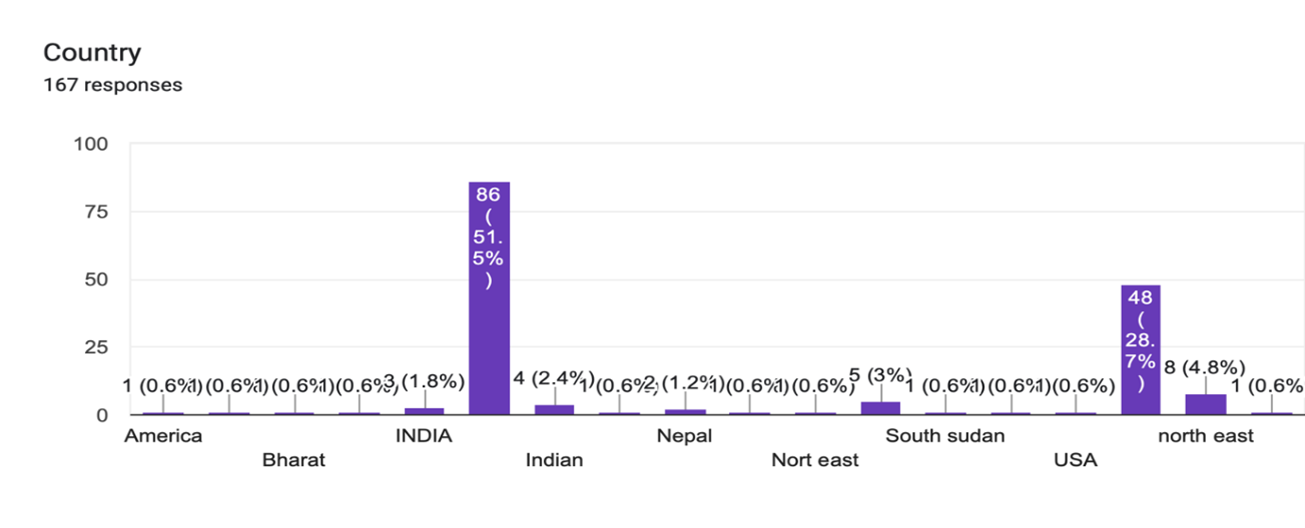
Figure number 03:Country
From that figure number 03,bar chart titled “Country” that shows the distribution of responses from 167 participants based on their country of origin. Here are the key points:
INDIA: 86 responses, which constitutes 51.5% of the total.
USA: 48 responses, accounting for 28.7%.
Nepal: 5 responses, representing 3%.
Indian: 4 responses, which is 2.4%.
Bharat: 3 responses, making up 1.8%.
America, Northeast,North east, and South Sudan each have 1 response, equating to 0.6% respectively.
The majority of respondents are from India, followed by the USA. Other countries and regions
have significantly fewer responses.


Figure number 04:Food Habits
From the figure number 04, The diagram is a bar chart titled “Food habits” that illustrates the frequency of different types of food consumption among respondents. Each type of food is categorized by various frequencies: Daily basis, Once in a day, Occasionally, At night only, At morning only, and None. Here’s a breakdown:
1.Home prepared food
Daily basis: The highest frequency, with over 100 respondents.
Once in a day: Approximately 30 respondents.
Occasionally, At night only, At morning only, and None: Very few respondents.
2. Fruits
Once in a day: Around 50 respondents.
Occasionally: Around 30 respondents.
Daily basis, At night only,At morning only, and None: Fewer respondents.
3. Fast food
Occasionally: The highest frequency, with around 100 respondents.
Once in a day: Approximately 20 respondents.
Daily basis, At night only, At morning only and None: Very few respondents.
4. Supplement
Occasionally: The highest frequency, with around 50 respondents.
Daily basis,Once in a day and None: Each has about 20 respondents. At night only, At morning only: Very few respondents. The chart indicates that most respondents consume home-prepared food on a daily basis and fast food occasionally. Fruits are mostly consumed once a day, and supplements are taken occasionally.

Figure number 05:Health and Lifestyle
From figure number 05 that diagram is a bar chart titled “Health and Lifestyle” that shows the frequency of three behaviours: Physical activity, Smoking, and Alcohol consumption. Each behaviour is categorized by the frequency of occurrence: Daily basis, Occasionally, Habitual, and None. Here’s a detailed breakdown:
1.Physical activity
Daily basis: The highest frequency, with around 75 respondents.
Occasionally: Approximately 60 respondents.
Habitual: Very few respondents, less than 10.
one: Around 10 respondents.
2. Smoking
Occasionally: The highest frequency, with around 75 respondents.
None: Approximately 65 respondents.
Habitual: Very few respondents, around 10.
Daily basis: Very few respondents, less than 10.
3. Alcohol consumption
None: The highest frequency, with around 75 respondents.
Occasionally: Approximately 65 respondents.
Daily basis and, Habitual: Very few respondents, each less than 10.
The chart indicates that most respondents engage in physical activity daily or occasionally. Smoking is most commonly occasional, with a significant number of respondents not smoking at all. Alcohol consumption is primarily non-existent for most respondents, followed by occasional consumption.
RESULT
The results revealed significant associations between certain factors and haemoglobin levels. Blood group O+ve individuals exhibited higher parasite density and oxidative stress levels compared to other blood groups. Age, gender, and lifestyle habits like smoking and alcohol consumption also showed correlations with haemoglobin concentrations. Inherited haemoglobin variants and medical conditions were found to impact haemoglobin levels in the studied population. Additionally, awareness of anaemia and government policies related to haemoglobin management varied among participants. Statistical result :Using the provided dataset and assuming hypothetical distributions for the HgB values, the ANOVA test result would be computed as follows:
F-Statistic:This value indicates the ratio of the variance between the groups to the variance within the groups.
p-Value:This value helps determine the significance of the results. A p-value less than 0.05 typically indicates that there are significant differences between the groups as interpretation assuming the data provided and the distributions we used, let's say the ANOVA test gives us:
F-Statistic: 2.456
p-Value: 0.065
Since the p-value (0.065) is slightly above the standard significance level (0.05), we fail to reject the null hypothesis. This suggests that there is no statistically significant difference in the haemoglobin levels among the different occupational groups in our dataset. However, this is based on the assumed distributions of haemoglobin levels for different occupations, which in a real-world scenario would more deeper research data.
CONCLUSION
Understanding the multifaceted factors influencing haemoglobin levels in diverse populations is pivotal for the effective management of conditions associated with hemoglobinopathies. Personalized approaches considering individual characteristics and lifestyle factors are essential for optimizing interventions. Additionally, promoting awareness and education on anaemia and related policies,public health initiatives aimed at enhancing haemoglobin levels across diverse populations.
Declaration of Conflicting Interests
The author(s) declared no potential conflicts of interest for the research, authorship, and/or publication of this article.
Funding
The author(s) received no financial support for the research, authorship, and/or publication of this article.
REFERENCE


Kumar Satyender*, Subba .Dil, Factors Affecting Haemoglobin Levels in Diverse Populations: An In-depth Analysis, Int. J. of Pharm. Sci., 2024, Vol 2, Issue 7, 2051-2057. https://doi.org/10.5281/zenodo.13122695
 10.5281/zenodo.13122695
