Sarada Vilas College of Pharmacy, Mysuru, Karnataka, India
This study aimed to develop and evaluate transdermal patches of Cyclizine hydrochloride to achieve sustained systemic delivery and improved patient compliance. Patches were formulated using varying ratios of Hydroxypropyl methylcellulose (HPMC) and Polyvinylpyrrolidone (PVP), with polyethylene glycol as a plasticizer. The formulations (F1–F5) were assessed for physicochemical properties such as thickness, weight uniformity, tensile strength, folding endurance, moisture absorption/loss, and drug content. Fourier Transform Infrared Spectroscopy (FTIR) confirmed no significant drug–excipient interactions. In vitro drug release studies using Franz diffusion cells over 12 hours revealed that increasing the hydrophilic polymer content enhanced drug release. Among the formulations, F3 (1:1 polymer ratio) exhibited an optimal release profile with approximately 86% cumulative release at 720 minutes. Kinetic analysis indicated first-order release following the Higuchi model, suggesting diffusion-controlled behavior, while the Korsmeyer–Peppas model indicated non-Fickian transport. The optimized formulation demonstrated desirable mechanical strength and sustained drug release, supporting its potential as an effective transdermal delivery system for Cyclizine hydrochloride.
Oral drug delivery remains the most common and preferred route due to its convenience and non-invasive nature. However, it presents several limitations that can significantly impact drug efficacy and patient compliance. In contrast, transdermal drug delivery systems (TDDS), such as patches, offer a number of distinct advantages that make them a superior alternative in many clinical scenarios.
One of the primary drawbacks of oral administration is the first-pass metabolism in the liver, which can lead to significant degradation of the active pharmaceutical ingredient (API) before it reaches systemic circulation. This can reduce bioavailability and necessitate higher or more frequent dosing. Transdermal delivery bypasses the gastrointestinal tract and hepatic first-pass effect, allowing for more consistent plasma drug concentrations and potentially lower total doses. Additionally, many orally administered drugs are subject to poor gastrointestinal absorption, influenced by factors such as pH, food intake, and motility. Transdermal systems circumvent these variables by delivering the drug directly through the skin, ensuring greater predictability in drug absorption.1
Transdermal patches also allow for controlled and sustained drug release, which helps maintain steady therapeutic levels over extended periods and reduces the risk of peaks and troughs in plasma concentration that can lead to side effects or sub therapeutic effects. This sustained delivery can improve therapeutic outcomes and patient adherence, especially in chronic conditions.2
ADVANTAGES
DISADVANTAGES
The objectives of the present work were:
MATERIALS AND METHODOLOGY
Table 1: Materials
|
Drug |
Cyclizine hydrochloride |
|
Polymer |
Hpmc k15 |
|
Polymer |
Pvp k30 |
|
Plasticizer |
Peg 400 |
|
Permeation enhancer |
Oleic acid |
|
Backing membrane |
Polyvinyl alcohol |
Preparation of PVA Backing Membrane
Polyvinyl alcohol (PVA) was used as a backing layer. Accurately weighed 4 g of PVA was dissolved in 100 mL of distilled water with continuous stirring at 70–80 °C until a clear solution formed. A Petri dish was coated with glycerin to prevent adhesion and enhance flexibility. The hot PVA solution was poured and spread evenly, then dried at room temperature or in a hot air oven (40–45 °C) to obtain a transparent, uniform film.5
Preparation of Drug–Polymer Matrix Layer
Hydroxypropyl methylcellulose (HPMC) and Polyvinylpyrrolidone (PVP) were dissolved in an ethanol–water mixture (7:3) with stirring to form a clear solution. The drug, pre-dissolved in ethanol, was added to the polymer solution with continuous mixing. PEG 400 (20% w/w of polymer) and oleic acid (5% w/w of polymer) were incorporated as plasticizer and permeation enhancer, respectively. The solution was sonicated to remove air bubbles and cast onto the dried PVA backing membrane. Films were dried at 40–45 °C to yield smooth, flexible drug-loaded patches, which were then peeled off and stored in a desiccator for evaluation.6
Table 2: Composition of transdermal patch (F1-F5)
|
Formulation |
Polymer ratio (HPMC:PVP) |
Cyclizine HCl (mg) |
HPMC K15 (mg) |
PVP K30 (mg) |
PEG 400 (mg) |
Oleic acid (mg) |
Solvent |
|
F1 |
3:1 |
50 |
450 |
150 |
90 |
30 |
Ethanol: Water (7:3) |
|
F2 |
2:1 |
50 |
400 |
200 |
90 |
30 |
Ethanol: Water (7:3) |
|
F3 |
1:1 |
50 |
300 |
300 |
90 |
30 |
Ethanol: Water (7:3) |
|
F4 |
1:2 |
50 |
200 |
400 |
90 |
30 |
Ethanol: Water (7:3) |
|
F5 |
4:1 (higher plasticizer) |
50 |
480 |
120 |
120 |
30 |
Ethanol: Water (7:3) |
PREFORMULATION STUDIES
Organoleptic properties
The drug's colour, odour and taste were characterized and recorded using descriptive technologies.
Determination of Melting Point of Cyclizine Hydrochloride
A small quantity of cyclizine HCl was introduced into a capillary tube sealed at one end. The capillary tube was then placed into a calibrated melting point apparatus. The sample was heated gradually, and the temperature at which the cyclizine HCl transitioned from solid to liquid was recorded as the melting point. This procedure was repeated three times to ensure accuracy and reproducibility. The average of the three recorded temperatures was calculated and documented as the final melting point of the drug.7
Solubility Analysis
Cyclizine's solubility was tested in various solvents, including water, methanol, ethanol, chloroform and ethyl acetate (Table 4).
Standard calibration curve
A stock solution of cyclizine HCl was prepared by accurately weighing 50.0 mg and dissolving in methanol; the volume was adjusted to 50.0 mL in a volumetric flask to yield 1000 µg/mL. The UV spectrum of the stock (200–300 nm) was scanned on a Shimadzu UV 2450 to determine the λmax. Working standards (2, 4, 6, 8, 10 µg/mL) were prepared by appropriate dilutions of the stock in methanol using calibrated pipettes and volumetric flasks; solutions were filtered (0.45 µm) prior to measurement. Absorbance of each standard (n=3) was measured against a methanol blank in quartz cuvettes at the determined λmax. A calibration curve was constructed by plotting concentration (µg/mL) versus mean absorbance (Y) and linear regression used to calculate slope, intercept.8
Drug and excipients compatibility
Fourier Transform Infrared (FTIR) spectroscopy (Paragon 1000, Perkin Elmer, UK) was used to assess possible drug–excipient, drug–polymer, and polymer–polymer interactions. The drug and polymer were accurately weighed, finely powdered, and uniformly mixed with dry potassium bromide (KBr) using a mortar and pestle. About 100 mg of the mixture was compressed into a transparent KBr disc using a hydraulic press. A pure KBr disc was used for baseline correction to eliminate background interference. FTIR spectra were recorded in the 2000–400 cm?¹ range and analyzed for characteristic peaks or shifts indicating potential physicochemical interactions.9
Evaluation of transdermal patches of cyclizine HCl
Physical appearance
The colour, clarity, flexibility, and smoothness of each prepared transdermal patch were evaluated.
Thickness of the patch
Using a screw gauge, three distinct patch thicknesses were measured, and mean values were calculated.
Weight Uniformity
The patches measuring 2 × 2 cm2 were cut and weighed using an electronic balance. The average weight was calculated and recorded. 10
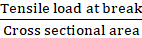
Tensile strength 11
Using a Universal Strength Testing Machine, the tensile strength of the patches was assessed. The device had 1-gram sensitivity. There were two load cell grips in it. The upper one could be moved, but the lower one was fixed. A test film (4 x 1 cm2) was placed between these cell grips, and force was gradually applied until the film broke. The kilogram dial reading was used to determine the film's tensile strength. Tensile strength is expressed as follows
Tensile Strength = Tensile load at breakCross sectional area
Folding endurance
This was identified by repeatedly folding one film until it broke in the same spot. The value of folding endurance was determined by how many times the film could be folded in the same location without breaking.12
Percentage moisture absorption 13
The patches were precisely weighed and put in a desiccator with a saturated potassium chloride solution that was kept at room temperature to maintain a humidity state of 80–90% RH. The patches were stored until a steady weight was reached, then they were taken out and weighed. The difference between the final and original weights with regard to the initial weight was used to compute the percentage of moisture uptake.
Percentage moisture absorption = Final weight-Initial weight Initial weight

Percentage moisture loss
The patches were weighed separately and stored at room temperature in a desiccator containing anhydrous calcium chloride. When there was no change in the individual patch's weight, the final weight was recorded. The difference between the initial and final weights compared to the initial weight was used to compute the percentage of moisture loss.
Percentage moisture loss = Initial weight-Final weight Initial weight

Drug content
A transdermal patch was cut into 5 equal parts and put in a 50 ml buffer (pH 7.4). This was then shaken in a mechanical shaker for 24 h to get a homogeneous solution and filtered. The drug content was determined spectrophotometrically at the experimentally determined λmax (230 nm) after suitable dilution.14
In vitro drug release
Patches of cyclizine HCl were cut into 5 cm² pieces (2 × 2 cm) and mounted on regenerated cellulose membranes (pre-soaked overnight in distilled water). The membrane was fixed to a cylindrical diffusion cell open at both ends, with the drug-releasing surface oriented toward the receptor compartment. The receptor contained 50 mL phosphate buffer (pH 7.4), maintained at 32 ± 1 °C, and stirred continuously with a magnetic stirrer. At predetermined intervals, aliquots of receptor medium (e.g., 2 mL) were withdrawn and immediately replaced with fresh buffer to maintain sink conditions. Samples were analyzed for cyclizine HCl content using a UV spectrophotometer at the experimentally determined λmax (Table 10).15
In-vitro drug release kinetics
Kinetic analysis of drug release from the formulated transdermal patches was carried out by fitting the in vitro release data to various mathematical models in order to determine the most appropriate release kinetics. The release data of cyclizine HCl patches containing HPMC and PVP as polymers and PEG 400 as plasticizer were evaluated using different kinetic models, namely zero-order, first-order, Higuchi, and Korsmeyer–Peppas models. Based on the correlation coefficient (R²) and release rate constant (k) values obtained for each model, the best-fit model was identified. This analysis was further used to elucidate the drug release mechanism from the transdermal system.16
RESULT AND DISCUSSION
The colour, odour and taste of the drug were characterized and recorded using descriptive terminology; the results are shown below:
Table 3: Organoleptic Properties of Cyclizine HCl
|
Sr. No. |
Parameter |
Observation |
|
1 |
Colour |
White |
|
2 |
Odour |
Odourless |
|
3 |
Appearance |
Crystalline powder |
The melting point of Cyclizine HCl was found by the capillary technique to be 247.95? C.
Solubility study of cyclizine HCL in different solvents revealed that it is freely soluble in water, DMSO, soluble in ethanol, methanol, but insoluble in chloroform and ether.
Table 4: Solubility study of Cyclizine HCl
|
Sr. No. |
Solvent |
Solubility Description |
|
1 |
Water |
Freely soluble |
|
2 |
DMSO |
Freely soluble |
|
3 |
Ethanol (95%) |
Soluble |
|
4 |
Methanol |
Soluble |
|
5 |
Chloroform |
Practically insoluble |
|
6 |
Ether |
Practically insoluble |
Determination of Absorption maxima for Cyclizine HCl
A UV spectrophotometric analysis established that the maximum absorption wavelength (λ max) for Cyclizine HCl in methanol is 255 nm. The obtained peak closely matched the values reported in the literature. This wavelength was chosen for further analysis.
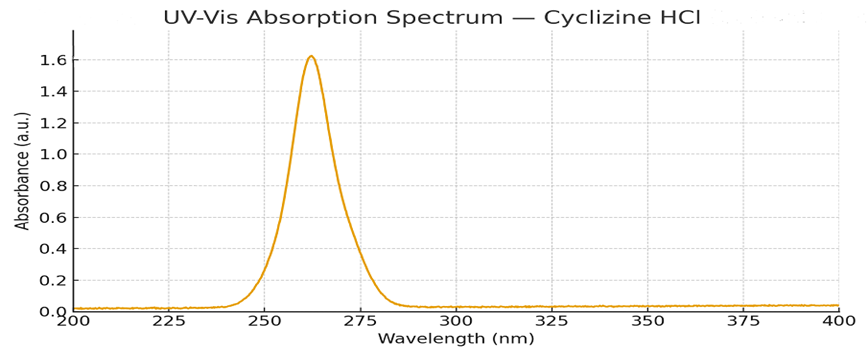
Figure No. 1: Absorption maxima of Cyclizine HCl in methanol
Standard calibration curve
A drug solution with concentrations ranging from 2μg/ml to 10μg/ml was prepared using methanol, and absorbance was measured using a UV spectrophotometer at the absorption maximum (λ max) of 255 nm against a blank (methanol). A calibration curve was then constructed by plotting concentration on the x-axis and absorbance on the y-axis.
Table 5: Data of Standard calibration curve of Cyclizine HCl
|
SL No. |
Concentration(µg/ml) |
Absorbance |
|
1 |
2 |
0.115 |
|
2 |
4 |
0.245 |
|
3 |
6 |
0.298 |
|
4 |
8 |
0.403 |
|
5 |
10 |
0.551 |
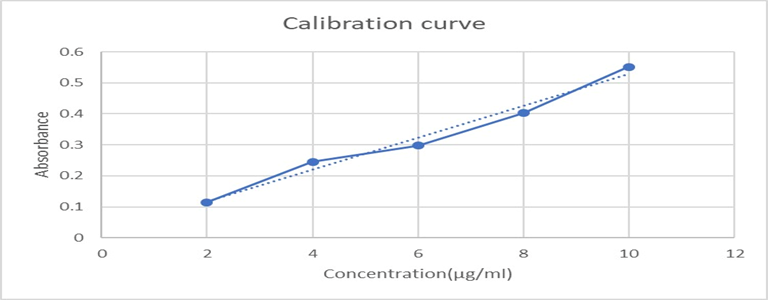
Figure No. 2: standard calibration curve of Cyclizine HCl
FTIR Spectra data
All characteristic peaks of Cyclizine HCl are retained in the polymer mixture with only minor shifts or broadening, mainly due to hydrogen bonding and overlapping with polymer functional groups. No new peaks were observed, confirming drug–polymer compatibility.
Table 6: FTIR Spectra data of Cyclizine HCl
|
Functional Groups |
Reference Peaks (cm?¹) |
Cyclizine HCl (cm?¹) |
Cyclizine HCl + HPMC + PVP (cm?¹) |
|
N–H stretching (salt form) |
3300–3500 |
3320 |
3385 |
|
Aromatic C–H stretching |
3050–3100 |
3060 |
3072 |
|
Aliphatic C–H stretching |
3000–2850 |
2925 |
2930 |
|
Aromatic C=C stretching / N–H bending |
1700–1500 |
1600 |
1635 |
|
C–H bending (CH?/CH?) |
1450–1350 |
1450 |
1450 |
|
C–N stretching (piperazine) |
1350–1200 |
1224 |
1236 |
|
CO? artefact (not a functional group) |
2400–2300 |
2350 |
2350 |
|
Aromatic C–H out-of-plane bending |
900–600 |
800–650 |
800–650 |
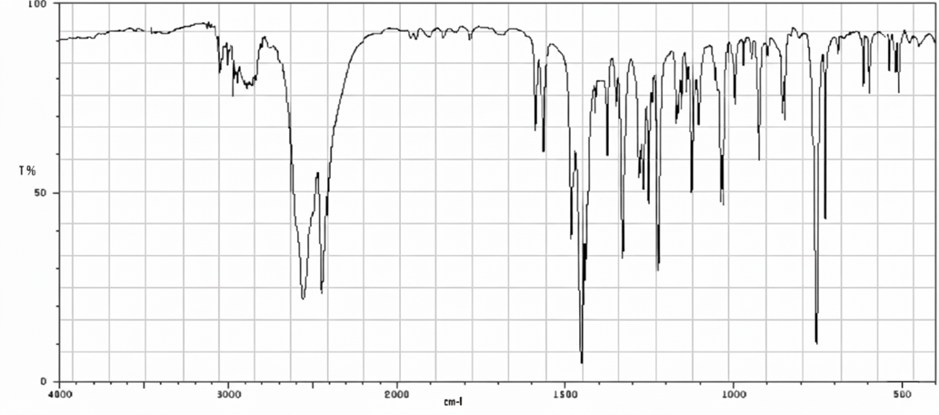
Figure No.3: FTIR Spectrum of Cyclizine HCl
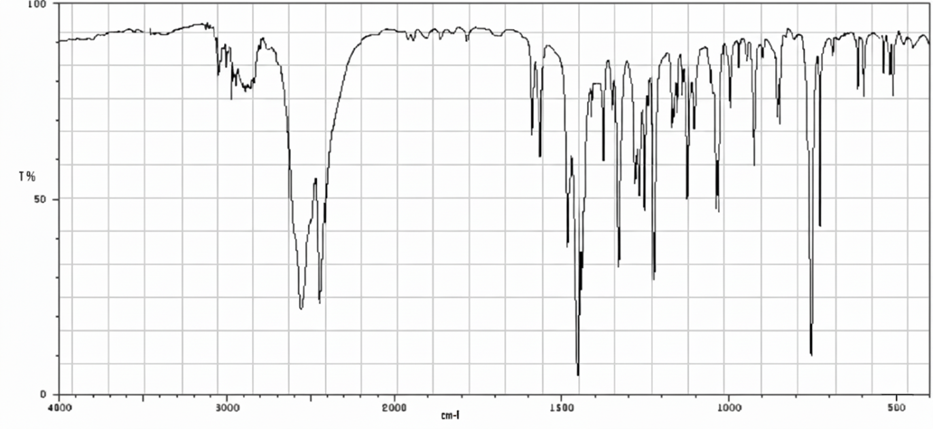
Figure No.4: FTIR Spectrum of PVP K30
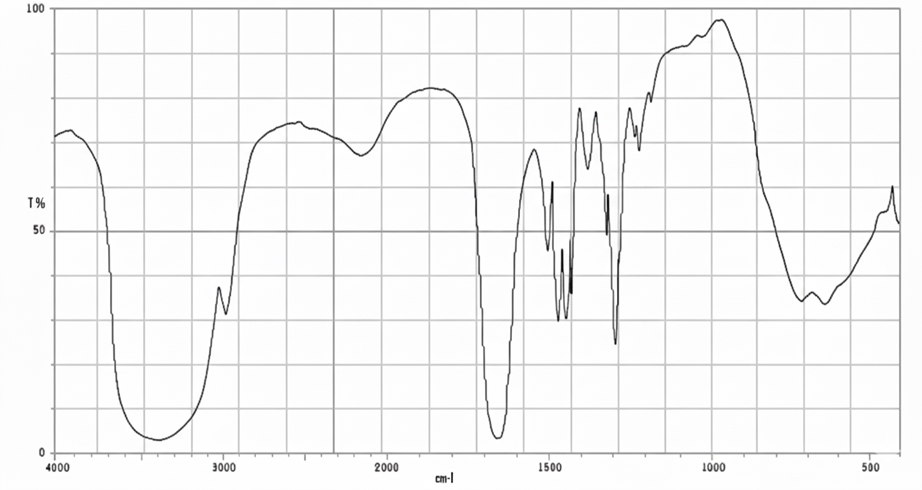
Figure No.5: FTIR Spectrum of HPMC K15
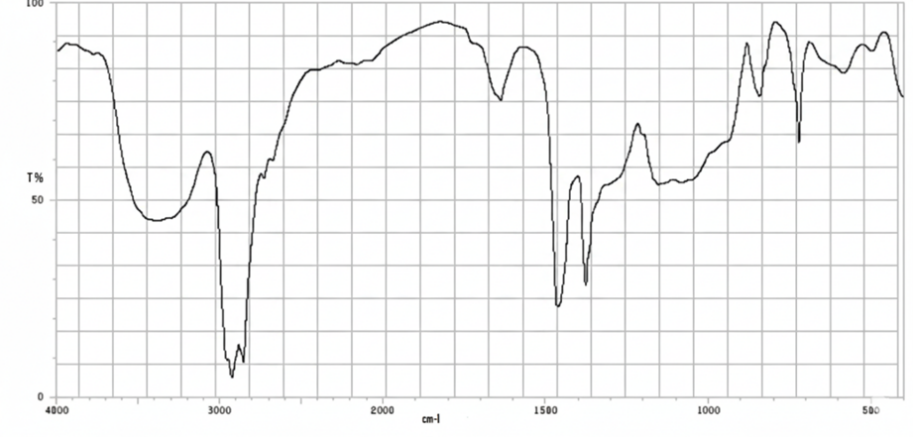
Figure No.6: FTIR Spectrum Cyclizine HCl+HPMC+PVP
Physical appearance of the patches
Table 7: Physical appearance of the transdermal patches
|
Formulation |
Colour |
Transparency |
Surface |
Flexibility |
|
F1 (HPMC: PVP 3:1) |
Colourless |
Semi-transparent |
Smooth, uniform |
Good |
|
F2 (HPMC: PVP 2:1) |
Slightly white |
Semi-transparent |
Smooth |
Good |
|
F3 (HPMC: PVP 1:1) |
Colourless |
Semi-Transparent |
Smooth, glossy |
Very good |
|
F4 (HPMC: PVP 1:2) |
Colourless to faint white |
Translucent |
Smooth but slightly sticky |
Excellent |
|
F5 (HPMC: PVP 4:1, higher plasticizer) |
Colourless |
Transparent |
Smooth |
Very soft, highly flexible |
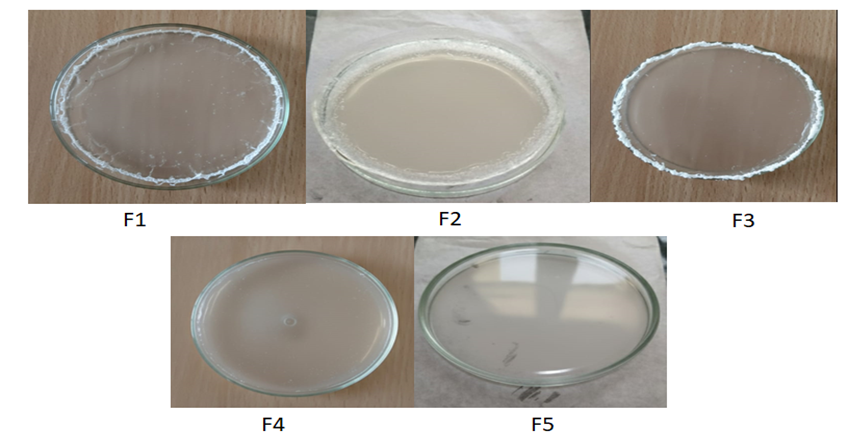
Figure 7: Physical appearance of Cyclizine HCl transdermal patches F1–F5.
Physicochemical evaluation of transdermal patches
All formulations showed uniform thickness (125–192 µm) and weight (55–60 mg), confirming consistent casting. Tensile strength decreased with higher PVP and PEG (8.5–4.2 MPa), while folding endurance (124–152 folds) improved, indicating greater flexibility. PVP-rich patches (F3, F4) absorbed more moisture, whereas HPMC-based films (F1, F2, F5) showed better stability. Drug content was uniform (97–99.5%). Overall, HPMC provided strength, and PVP–PEG enhanced flexibility; F3 (1:1) showed the most balanced performance for transdermal delivery.
Table 8: Physicochemical evaluation of transdermal patches (1)
|
Formulation |
HPMC:PVP Ratio |
Thickness (µm, mean ± SD, n=3) |
Weight Uniformity (mg, mean ± SD, n=3, %RSD) |
Tensile Strength (MPa) |
Folding Endurance (folds) |
|
F1 |
3:1 |
125 ± 2 |
55 ± 2 (3.6%) |
8.5 |
124 |
|
F2 |
2:1 |
130 ± 3 |
57 ± 2 (3.5%) |
7.8 |
127 |
|
F3 |
1:1 |
155 ± 4 |
58 ± 3 (5.2%) |
6.5 |
135 |
|
F4 |
1:2 |
140 ± 3 |
56 ± 2 (3.6%) |
5.8 |
138 |
|
F5 |
4:1, high PEG |
192 ± 4 |
60 ± 3 (5.0%) |
4.2 |
152 |
Table 9: Physicochemical evaluation of transdermal patches (2)
|
Formulation |
% Moisture absorption |
% Moisture loss |
Drug content (%) |
|
F1 |
2.5 |
3.0 |
98.5 |
|
F2 |
3.1 |
3.5 |
97.8 |
|
F3 |
4.2 |
4.0 |
99.2 |
|
F4 |
5.0 |
4.5 |
98.0 |
|
F5 |
3.8 |
3.2 |
99.5 |
In vitro Drug release
The in vitro drug release profiles (F1–F5) demonstrated the influence of polymer ratio and excipient composition on drug release. After 720 minutes, cumulative release ranged from 75% (F1) to 92% (F5). A reduction in polymer content or increase in hydrophilic excipient accelerated drug release. F1 (3:1 ratio) showed the slowest release, whereas F5 (4:1 with high PEG) achieved the fastest, highlighting PEG’s role in promoting hydration and diffusion. F3 (1:1) exhibited a balanced, sustained profile (86%). Overall, modulation of polymer and PEG ratios effectively governed release kinetics, with F5 providing maximum and F3 optimized sustained release.
Table 10: In vitro Release data of transdermal patches
|
Time (min) |
F1 (3:1) |
F2 (2:1) |
F3 (1:1) |
F4 (1:2) |
F5 (4:1, high PEG) |
|
0 |
0 |
0 |
0 |
0 |
0 |
|
30 |
8.0 |
10.0 |
12.0 |
14.0 |
16.0 |
|
60 |
15.0 |
18.0 |
20.0 |
22.0 |
25.0 |
|
120 |
25.0 |
28.0 |
32.0 |
35.0 |
38.0 |
|
240 |
40.0 |
45.0 |
52.0 |
55.0 |
60.0 |
|
360 |
52.0 |
58.0 |
65.0 |
68.0 |
73.0 |
|
480 |
62.0 |
68.0 |
75.0 |
78.0 |
84.0 |
|
720 |
75.0 |
80.0 |
86.0 |
88.0 |
92.0 |
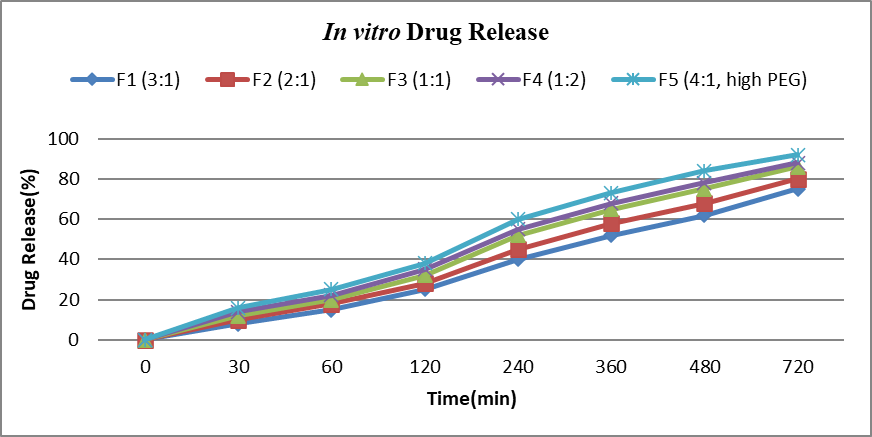
Figure No.7: In vitro Drug Release
Drug Release Kinetics
The drug release profile of formulation F3 (1:1 polymer ratio) was subjected to kinetic modeling to elucidate the mechanism of drug release. The in vitro data were fitted to zero-order, first-order, Higuchi, and Korsmeyer–Peppas models. The obtained regression coefficient (R²) values indicated that the first-order model (R² = 0.9988) provided the best fit compared to other models. This suggests that the release of the drug from the formulation is concentration-dependent, i.e., the rate of drug release decreases as the concentration of the drug in the system declines.
The Higuchi model (R² = 0.9906) also showed a good correlation, implying that the drug release is significantly governed by a diffusion-controlled mechanism through the polymeric matrix. Furthermore, fitting the data to the Korsmeyer–Peppas model yielded an R² of 0.9917 with a release exponent (n = 0.635). Since the value of n lies between 0.5 and 1.0, the mechanism can be characterized as non-Fickian (anomalous) transport, indicating that both diffusion and polymer relaxation/erosion contribute to the overall release mechanism.
The zero-order model (R² = 0.925) showed comparatively lower correlation, indicating that the system does not follow a constant drug release pattern over time. Instead, the release is better explained by a combination of diffusion and erosion, which aligns with the biphasic nature of the polymeric film.
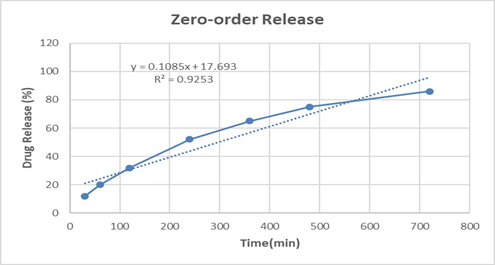
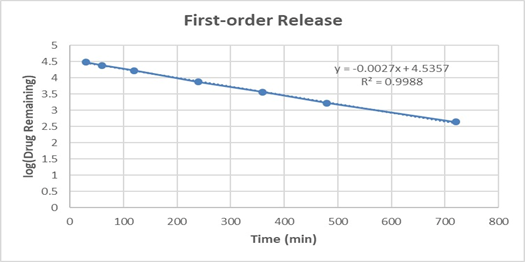
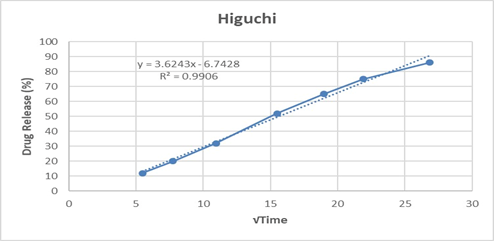
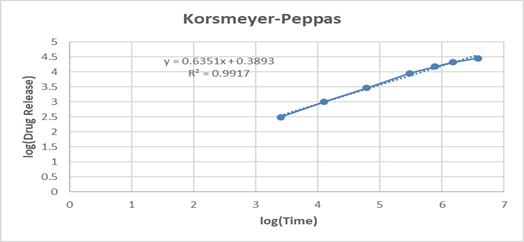
Figure No.8: Drug release kinetic
Table 11: In vitro drug release kinetics for F3 formulation
|
Model |
Slope (k?) |
Intercept |
R² |
|
Zero-order |
0.1085 |
17.693 |
0.9253 |
|
First-order |
-0.00268 |
4.536 |
0.9988 |
|
Higuchi |
3.6243 |
-6.743 |
0.9906 |
|
Korsmeyer–Peppas |
0.6351 (n) |
0.389 |
0.9917 |
Overall, the release kinetics study confirms that formulation F3 follows predominantly first-order kinetics with a diffusion–erosion-controlled mechanism, which is desirable for achieving sustained drug delivery. The anomalous transport behavior is particularly important for topical/transdermal delivery, as it ensures a balance between maintaining therapeutic drug levels and prolonging release.
CONCLUSION
The present study successfully developed and characterized transdermal patches of Cyclizine HCl using HPMC and PVP as film-forming polymers with PEG 400 as plasticizer. Preformulation and compatibility studies confirmed the suitability of the selected drug and excipients for formulation. The prepared patches were uniform, flexible, and stable, meeting the basic requirements of a transdermal system. In vitro release studies and kinetic modeling demonstrated that the formulation (F3) provided sustained drug release with a non-Fickian diffusion mechanism, indicating the involvement of both diffusion and polymer relaxation. Overall, the research establishes that Cyclizine HCl can be effectively delivered through the transdermal route, offering advantages such as avoidance of first-pass metabolism, improved patient compliance, and prolonged therapeutic effect. This approach holds promise as an alternative to conventional oral administration.
ACKNOWLEGDEMENT
The authors thank the faculty, staff, and administration of Sarada Vilas College of Pharmacy, Mysuru, for their guidance, support, and facilities provided for this study.
REFERENCES

Priyanka N, Venkatesh, Salman M, Hanumanthachar Joshi, Formulation and Evaluation of Transdermal Patch Containing Cyclizine HCl, Int. J. of Pharm. Sci., 2025, Vol 3, Issue 10, 3168-3179. https://doi.org/10.5281/zenodo.17475199
 10.5281/zenodo.17475199
