1,2,3 Dr. L. H. Hiranandani College of Pharmacy, University of Mumbai, Maharashtra, India.
4,5 Orah Nutrichem Pvt. Ltd., Nigdi, Pune, Maharashtra, India
Sunscreen is essential to protect skin from harmful Ultraviolet (UV) radiation, which can cause oxidative stress, aging, and skin cancer. UV exposure generates Reactive Oxygen Species (ROS), increasing damage risk, especially in children. Ascorbic acid and Tocotrienols offer potent antioxidant protection by neutralizing ROS. Natural vegetable oils like Olive oil, Almond oil and Sesame oil contribute to SPF, nourish skin, and improve vitamin penetration. Using such oils reduces the need for organic UV filters, minimizing adverse effects and meeting consumer demand for safe and natural sunscreen. The aim of the present research work was to develop a “Sunscreen ingredient” that can be incorporated in any base to form a “Sunscreen” for kids (age 12 years and onwards). Oil- in- Water (O/ W) emulsion was prepared as Sunscreen Ingredient. Emulsion preparation was carried out in multiple steps like, selection of surfactant combination, determination of quantity of oil that can be loaded in emulsion, minimizing quantities of surfactant mixture in emulsion and optimization of oil ratio for maximizing SPF. The Optimized Sunscreen ingredient was formulated and incorporated in the Vanishing cream base, thus developing Prototype formulation. Both Optimized Sunscreen ingredient and Prototype formulation were subjected to various evaluation tests like in-vitro SPF, antioxidant activity, pH, accelerated stability studies, etc. Both demonstrated satisfactory results.
The skin, referred to as the cutaneous membrane, is the body's outer layer.1 While barrier integrity matures by six years of age, complete physiological and microbiological maturation extends into later childhood.2, 3, 4, 5 Of the UV radiation reaching Earth, about 95% is UVA and 5% is UVB. UVA causes skin aging and tanning, while UVB leads to sunburn by penetrating deeper layers of skin. Both types generate ROS, initiating photochemical reactions and photosensitization. Prolonged UV exposure is linked to eye disorders, immune suppression, and skin cancers. UV radiation induces DNA mutations essential for carcinogenesis. Chronic exposure causes hyperpigmentation, collagen degradation, and mutation accumulation, with 86% of melanomas and 90% of non-melanoma skin cancers attributed to UV exposure. UVB (280–320?nm) causes DNA lesions like Cyclobutane pyrimidine dimers (CPDs) and Pyrimidine-pyrimidone (6-4) photoproducts, disrupting replication and transcription. UVA (320–400?nm) is needed in small amounts for circadian rhythm regulation but at high doses suppresses immunity and promotes ROS formation. ROS damages DNA, lipids, and proteins, contributing to photoaging and cancer. Melanin protects against UV but can act as a pro-oxidant under exposure, leading to CPD formation in melanocytes and facilitating melanoma.6 Melanocytes and Interfollicular epidermal stem cells are present in the basal layer of skin. When these cells get high UV exposure in childhood, risk of developing skin cancer later in life increases. This is because epidermal stem cells have lifelong persistence, thus being an ideal site for carcinogenic effect. Also such UV exposure serves to be a starting point for melanocytic nevi development.7 Skin sensitivity to UV varies by skin tone. Darker skin has greater resistance to sunburn and better UV tolerance but remains susceptible to damage. The World Health Organization (WHO) recommends using sunscreen along with protective clothing, hats, sunglasses, and shade. Daily sunscreen use helps prevent premature aging and skin cancer. Hence, it is recommended to use sunscreens daily, irrespective of skin type.8
All organic sunscreen agents can cause adverse effects like irritation, allergic contact reactions, photoallergy, and phototoxic effects.9 Zinc oxide (ZnO) and Titanium dioxide (TiO2) are widely used inorganic UV filters. However, ZnO’s thicker consistency may cause clogged pores in certain people, particularly when used with other comedogenic substances. For those with acne-prone skin, this may result in outbreaks or skin irritation.10 For TiO2 the two main issues raised were the possibility that TiO2 nanoparticles could produce ROS in response to UV light, which could harm skin cells' DNA, and the nanoparticles' ability to penetrate the skin.11
Vitamin C is a powerful antioxidant found in the aqueous compartment of the cells. It counteracts oxidative damage caused by a variety of causes, most prevalent of which is UV damage. Deep stratum corneum layers contain a large amount of Vitamin E, which serves as the skin’s main defence against oxidative stress brought about by UV radiations. Topically Vitamin E shields the skin from UV- induced cutaneous damage as well as chemical agent’s carcinogenic and mutagenic properties.12 According to one study, tocotrienols have 1600 times the antioxidant capacity of alpha tocopherol. According to some reports, the unsaturation in the aliphatic tail of tocotrienol may be responsible for its superior antioxidant activity by facilitating easier tissue penetration.13
In the current research work attempt is being made to develop a sunscreen ingredient that can be incorporated in any base to develop Sunscreen formulation making use of antioxidants and vegetable oils. A blend of vegetable oils is expected to reflect the UV rays, thus contributing to the Sun Protection Factor (SPF). L- Ascorbic acid and Tocotrienol will contribute to antioxidant activity of “Sunscreen ingredient”, this will take care of oxidative stress generated due to UV radiations exposure. Kaolin being an inorganic sunscreening agent, will help to improve the SPF. Also, it will aid in the stability of “Sunscreen ingredient” which is Oil- in- Water (O/W) emulsion by acting as a suspending agent.
MATERIALS AND METHODS:
Materials:
Gift sample of Tocotrienol with brand name Orah Vit E (OE) was obtained from Orah NutriChem Pvt. Ltd., Pune. L- ascorbic acid (AA) was procured from Molychem, Mumbai. Olive oil, Almond oil, Sesame oil were purchased from Vishal Chem, Mumbai. Glycerin, Propylene glycol, Kaolin, Tween 80, Span 80, Stearic acid and Potassium hydroxide were procured from renounced sources.
Methods:
Step 1: Determination of ratio of surfactant mixture (Smix)
Hydrophilic Lipophilic balance (HLB) value was determined assuming ratio of oils as 5: 3: 2 for Olive oil: Almond oil: Sesame oil and considering required HLB (RHLB) values of individual oils.
HLB of Oil blend = (Parts of Olive oil x RHLB of Olive oil) + (Parts of Almond oil x RHLB of Almond oil) + (Parts of Sesame oil x RHLB of Sesame oil)
HLB of Oil blend = 6.7
Thus, tentatively Oil blend was assumed to have RHLB of 6.7.
Now, by doing theoretical calculations the ratio of surfactant quantities was determined for getting HLB of 6.7.
Step 2: Procedure followed for developing emulsion
Aqueous phase consisted of AA, Kaolin, Tween, Glycerin, Propylene glycol and Water. Aqueous phase was stirred for 10 min. for uniformly dispersing Kaolin. Kaolin was weighed separately, then sieved from sieve no. 100 to break lumps, make it free flowing and then transferred to aqueous phase. The oil phase consisted of a blend of oils, OE and Span. Oil phase was stirred manually and added drop wise to aqueous phase. This was followed by stirring for 30 min. on a magnetic stirrer. Resultant course emulsion was subjected to probe sonication for 15 min., with 5 sec. pulse cycle.
Step 3: Determination of Concentration of the internal phase that can be loaded in emulsion
Various batches of emulsion were prepared having different concentrations of oil with 5% (w/w) Smix. Emulsions were then exposed to stress conditions. Those stress conditions were Centrifugation (1000 RPM, 20 min.), Accelerated conditions (40?, 75 % RH; 1 week) and Freeze Thaw cycles (48 hrs each, 3 cycles; freezing at 0? and thawing at room temperature). The objective was to maximize the quantity of oils in emulsion.
Step 4: Minimizing the Smix concentration
Emulsions were prepared of the selected Smix by gradually reducing concentration of Smix in them. Developed emulsions were exposed to above mentioned stress conditions to evaluate their stability. The objective was to minimize the quantity of Smix in emulsion.
Step 5: Optimization of oil ratio
Using 23 Factorial design ratio of olive oil: almond oil: sesame oil was optimized, so that maximum SPF can be achieved. Output factor/ Response was in- vitro SPF. Input factors with their levels are summarized below,
Table no. 1: Coded and Uncoded levels of Factors for Factorial design
|
Name of oil |
Low level (Coded) |
Low level (Actual) Parts |
High level (Coded) |
High level (Actual) Parts |
|
Olive oil |
-1 |
3 |
+1 |
7 |
|
Almond oil |
-1 |
1 |
+1 |
5 |
|
Sesame oil |
-1 |
1 |
+1 |
3 |
Step 6: Development of Optimized emulsion, Sunscreen Ingredient
By executing experimental design and analyzing data using StatEase software, software recommended a 7: 1: 1 ratio of Olive oil: Almond oil: Sesame oil for achieving maximum SPF. Using oils in said ratio and executing procedure given in Step: 2 optimized emulsion was developed in triplicates.
Step 1: Formulation of Vanishing cream base
Vanishing cream base was used to develop PF. Formula of Vanishing cream given in literature (14) was modified to achieve desired organoleptic characteristics in final formulation. Stearic acid and Potassium hydroxide in formula will generate in- situ emulsifier, glycerin will act as humectant in the formulation. Modified formula for vanishing cream base is as follows:
Table no. 2: Formula of Vanishing Cream base
|
Name of Ingredient |
Quantity (% w/ w) |
|
Stearic acid |
45 |
|
Potassium Hydroxide |
0.8 |
|
Glycerin |
8 |
|
Water |
Q. S. to 100 |
Procedure: Aqueous phase and Oil phase were prepared separately. Aqueous phase consists of Potassium hydroxide, glycerin and water. The oil phase has Stearic acid. Required quantities of ingredients were weighed and transferred into respective beakers. Both beakers were heated in a water bath until stearic acid melts completely. Once both phases were liquid, the aqueous phase was transferred to the Oil phase. This was followed by vigorous stirring until formulation cooled. Thus, forming a vanishing cream base.
Step 2: Blending of Vanishing cream base and SI
It was predecided that base and ingredient will be mixed in 1: 1 ratio. For that purpose in one beaker vanishing cream base was weighed. Pre- formulated SI was transferred into the same beaker in small portions followed by mixing (Geometric dilution). This ensured uniform and thorough mixing. Once all the quantity of SI was added, the resultant mixture was stirred for 10 to 15 min. Thus, developing the Prototype formulation.
Viscosity (cP) = Dial reading x Factor
Where,
Table no. 3: Values of EE (????) x I (????) 16
|
Wavelength (????) (nm) |
EE(????) x I (????) |
|
290 |
0.0150 |
|
295 |
0.0817 |
|
300 |
0.2874 |
|
305 |
0.3278 |
|
310 |
0.1864 |
|
310 |
0.0837 |
|
320 |
0.0180 |
Antioxidant activity (%) =
( Absorbance of Blank - Absorbance of sampleAbsorbance of Blank ) x 100

{a} {b}
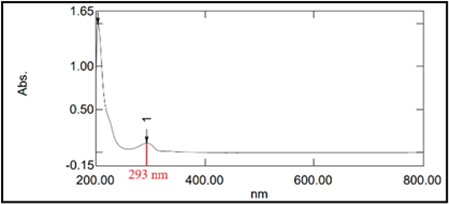
Fig. no. 1: UV Visible spectrum {a}: OE, {b}: AA
SI and PF were kept for Stability studies under Accelerated conditions, 40? and 75 % RH for a duration of 45 days. Samples of both were collected periodically and analyzed. The FTIR spectrum of samples taken on day 1 and day 45 were compared, to comment on content of AA and OE in formulation. For that purpose, a small quantity of sample was solubilized in Chloroform and spread over a blank KBr pellet, then FTIR spectrum was recorded.
RESULTS:
Determination of ratio of surfactant mixture (Smix)
Following were the three ratios that were screened for emulsion development,
|
Span 80: Tween 20= 81: 19 |
Span 80: Tween 60= 77: 23 |
Span 80: Tween 80= 78: 22 |
Determination of Concentration of the internal phase that can be loaded in emulsion.
Results of stability on exposure to stress conditions of various batches of emulsion are summarized below. Based on the results it was observed that, Smix of Tween 80 and Span 80 gave stable emulsion with 40 % w/ w oil. However this emulsion showed separation of one oil droplet over the surface. Thus, this surfactant combination was chosen for development of SI and the quantity of oil in emulsion was reduced to 36 % w/ w.
Table no. 4: Stability data of various batches of emulsion prepared with different concentrations of oil
|
Surfactant combination |
Smix (% w/w) |
Oil (% w/w) |
Internal Phase (% w/w) |
Post Centrifugation (1000 RPM, 20 min.) |
Post Accelerated conditions exposure (40? C, 75 % RH, 1 week) |
Post Freeze Thaw cycles (3, each of 48 hrs.) |
|
Tween 20: Span 80 |
5 |
20 |
24 |
Stable |
Stable |
Stable |
|
Tween 60: Span 80 |
5 |
20 |
24 |
Stable |
Phase separation |
Signs of Phase separation |
|
Tween 80: Span 80 |
5 |
20 |
24 |
Stable |
Stable |
Stable |
|
Tween 20: Span 80 |
5 |
40 |
44 |
Stable |
Phase separation |
Stable |
|
Tween 80: Span 80 |
5 |
40 |
44 |
Stable |
Stable |
Stable (an oil droplet over surface) |
|
Tween 80: Span 80 |
5 |
45 |
49 |
Phase separation |
- |
- |
Minimizing the Smix concentration
Attempt was made to reduce surfactant concentration ensuring that maximum quantity of oil is being loaded in emulsion with minimum Smix concentration, such that resulting emulsions are stable enough. For that purpose emulsions having 40 % oil phase were prepared by gradually reducing the concentration of Smix. Stability data for this study is summarized in table no. 5.
Table no. 5: Stability data of various batches of emulsion prepared with different concentrations of Smix
|
Surfactant combination |
Smix (% w/w) |
Oil (% w/ w) |
Internal Phase (% w/ w) |
Post Centrifugation (1000 RPM, 20 min.) |
Post Accelerated conditions exposure (40? C,75 %RH, 1 week) |
Post Freeze Thaw cycles (3, each of 48 hrs.) |
|
Tween 80: Span 80 |
5.0 |
36 |
40 |
Stable |
Stable |
Stable |
|
Tween 80: Span 80 |
4.5 |
36 |
40 |
Stable |
Stable |
Stable |
|
Tween 80: Span 80 |
4.0 |
36 |
40 |
Phase separation |
- |
- |
From this study it was observed that 5.0 % w/ w and 4.5 % w/ w Smix gave emulsions which were stable under multiple stress conditions. Emulsion with 4.0 % w/ w Smix showed phase separation on centrifugation. Thus, the Smix concentration was decided to be kept 4.5 % w/ w.
Optimization of oil ratio
StatEase software was used for optimization. Experimental design with response values was as follows,
Table no. 6: Experimental design with response values
|
Std |
Run |
Factor A: Olive oil (Parts) |
Factor B: Almond oil ( Parts) |
Factor C: Sesame oil ( Parts) |
Response 1 In- vitro SPF |
|
3 |
1 |
3 |
5 |
1 |
19.6042 |
|
6 |
2 |
7 |
1 |
3 |
18.2439 |
|
2 |
3 |
7 |
1 |
1 |
20.9450 |
|
7 |
4 |
3 |
5 |
3 |
20.6036 |
|
5 |
5 |
3 |
1 |
3 |
20.0470 |
|
4 |
6 |
7 |
5 |
1 |
19.0454 |
|
1 |
7 |
3 |
1 |
1 |
20.6826 |
|
8 |
8 |
7 |
5 |
3 |
19.4700 |
Software provided a Pareto chart. In that Pareto chart bars of A, B, C and AC were of blue color suggesting that the effect of these factors is Negative on the response. Bars of BC and ABC were of orange color suggesting that these factors have Positive effect on response.
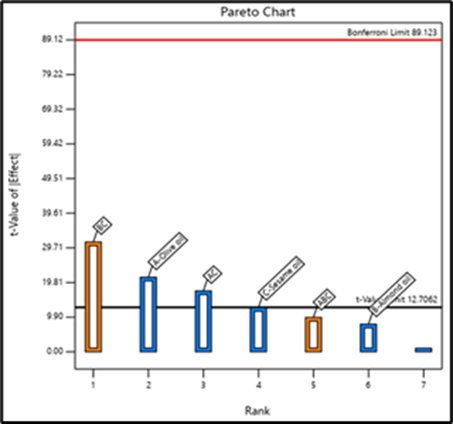
Fig. no. 2: Pareto chart
Software generated ANOVA table for the data which is given below (Table no. 7). Model F- value of 343.27 implies that the model is significant. Model terms A, AC and BC have their P- value less than 0.0500, indicating that those model terms are significantly affecting the response i.e. in- vitro SPF.
Table no. 7: ANOVA table
|
Source |
Sum of Square |
df |
Mean Square |
F value |
P value |
|
|
Model |
5.9200 |
6 |
0.9875 |
343.27 |
0.0413 |
Significant |
|
A- Olive oil |
1.3100 |
1 |
1.3100 |
454.22 |
0.0298 |
|
|
B- Almond oil |
0.1786 |
1 |
0.1786 |
62.08 |
0.0804 |
|
|
C- sesame oil |
0.4573 |
1 |
0.4573 |
158.97 |
0.0504 |
|
|
AC |
0.8714 |
1 |
0.8714 |
302.93 |
0.0365 |
|
|
BC |
2.8300 |
1 |
2.8300 |
984.85 |
0.0203 |
|
|
ABC |
0.2778 |
1 |
0.2778 |
96.56 |
0.0646 |
|
|
Residual |
0.0029 |
1 |
0.0029 |
|
|
|
|
Cor Total |
5.9300 |
7 |
|
|
|
|
Software also provides equation in terms of Coded factors which helps to predict the relative effect of each factor, interaction factor and higher order interaction factor on the response by comparing the factor coefficients. Coded equation is,
Y = 19.83 - 0.4041A - 0.1494B - 0.2391C - 0.3300 AC + 0.5951BC + 0.1863ABC
2D Contour plots and 3D Surface response plots were generated by the software giving graphical representation of the relationship between factors and response variable.
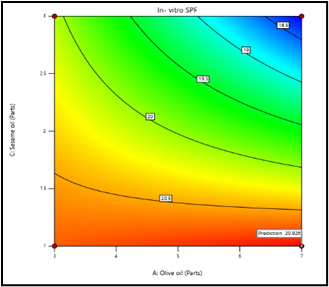
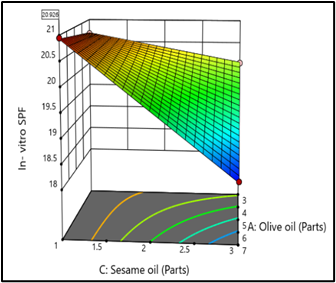
Fig. no. 3: 2D Contour Plot for factor A and factor C Fig. no. 4: 3D Surface Response plot for factor A and factor C
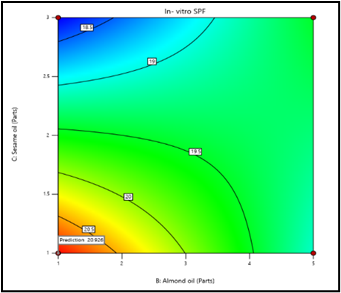
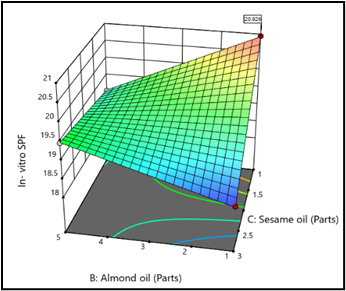
Fig. no. 5: 2D Contour Plot for factor B and factor C Fig. no. 6: 3D Surface Response plot for factor B and factor C
Overlay plots were obtained which depicted the design space according to the desired criteria (maximum in- vitro SPF). Yellow region is the design space. 64 solutions were provided by the software, from which the most suitable solution was adopted as the optimized batch. It was ensured that the chosen solution has desirability close to 1.
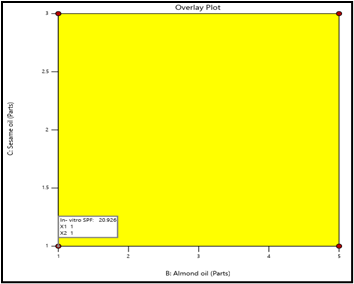
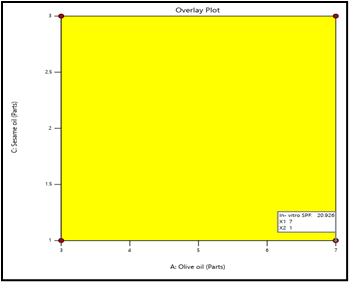
Fig. no. 7: Overlay plot for factor B and factor C Fig. no. 8: Overlay plot for factor A and factor C
Table no. 8 illustrates the Fit Statistics data. The adjusted R2 (0.9966) is in reasonable agreement with the predicted R2 (0.9689), i.e., the difference is less than 0.2. Thus, it can be inferred that the model is significant. Adeq Precision measures signal to noise ratio. The Adeq precision value is 53.8389 which is greater than the threshold value of 4 and thus it indicates the model can be used to navigate the design space. The C.V. % is 0.2705 which is less than 10%. This indicates that the model is reproducible. Table no. 9 gives the Optimized oil ratio, the predicted response values, and the experimental response values.
Table no. 8: Fit Statistics
|
Std. Dev. |
0.0536 |
R2 |
0.9995 |
|
Mean |
19.83 |
Adjusted R2 |
0.9966 |
|
C. V. % |
0.2705 |
Predicted R2 |
0.9689 |
|
|
|
Adeq Precision |
53.8389 |
Table no. 9: Optimized oil ratio
|
Independent variables |
Dependent variables |
|||
|
Factor |
Quantity (Parts) |
Response |
Predicted value |
Experimental value |
|
Olive oil |
7 |
In- vitro SPF |
20.926 |
19.923 ? 0.790 (N=3) |
|
Almond oil |
1 |
|||
|
Sesame oil |
1 |
|||
The results depict that the response values predicted by the software have been reproduced and hence the oil ratio 7: 1: 1 was concluded to be the Optimized oil ratio.
Through laboratory work and by analysing statistical data given by the StatEase software, a formula of the SI was developed which is given in table no. 10. Orah Vit E and L- ascorbic acid work as antioxidant, oil blend as Sunscreen agent, Glycerin and Propylene glycol as humectant, Span and Tween 80 as emulsifier, Kaolin plays dual role, it acts as Sunscreen agent and emulsion stabilizer. Optimized SI was formulated in triplicates and evaluated.
Table no. 10: Formula of SI
|
Ingredients |
Quantity (% w/ w) |
|
Orah Vit E |
4.00 |
|
Olive oil |
28.00 |
|
Almond oil |
4.00 |
|
Sesame oil |
4.00 |
|
L- ascorbic acid |
2.00 |
|
Kaolin |
1.00 |
|
Glycerin |
10.00 |
|
Propylene glycol |
10.00 |
|
Span 80 |
3.51 |
|
Tween 80 |
0.99 |
|
Water |
Q. S. to 100 |
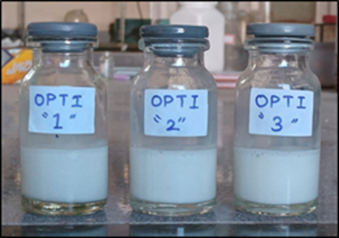
Fig. no. 9: Optimized SI formulated in triplicates
Table no. 11: Results of evaluation of SI
|
Parameter |
Result |
|
Organoleptic Properties: Color |
White |
|
Organoleptic Properties: Odor |
Slight and unpleasant |
|
pH |
3.69 ± 0.044 |
|
Dilution Test: With water |
No phase separation |
|
Dilution Test: With oil |
Phase separation observed |
|
In-vitro SPF Determination |
19.923 ± 0.790 |
|
Antioxidant Study (DPPH method) |
90.767 ± 0.549 % |
|
Particle Size |
179.867 ± 32.690 nm |
|
PDI |
0.118 ± 0.082 |
|
Zeta Potential |
-77.733 ± 1.514 mV |
Formulation:
Vanishing cream was decided to be used as a base for developing sunscreen cream. For that purpose a vanishing cream base was prepared.
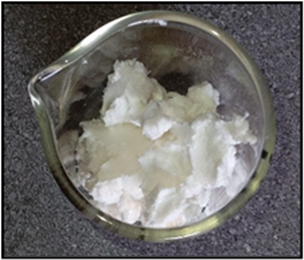

Fig. no. 10: Vanishing cream base Fig. no. 11: Prototype formulation
Evaluation:
Table no. 12: Results of evaluation of PF
|
Parameter |
Result |
|
Organoleptic Evaluation |
White color, odorless, smooth texture |
|
Homogeneity |
Achieved |
|
pH |
6.023 ± 0.015 (N=3) |
|
Spreadability |
2.113 ± 0.196 cm (N=3) |
|
Washability |
Easy with slight rubbing |
|
In-vitro SPF Determination |
12.725 |
|
Antioxidant Study (DPPH Method) |
88.941 % |
|
Viscosity |
2466.667 cP (N=3) |
|
Assay (AA and OE content) |
Unable to quantitate |
|
In-vitro SPF (COLIPA 2011 Guidelines) |
1.08 ± 0.01 |
SI was subjected to stability studies for a duration of 45 days. Periodically samples were withdrawn and analyzed to characterize stability of the SI over a period. To the results obtained, a statistical test Single sample t- test was applied to evaluate if results vary significantly or not.
Table no. 13: Accelerated stability study data for SI
|
Evaluation test |
Day 1 |
Day 7 |
Day 15 |
Day 30 |
Day 45 |
|
Color |
White |
White |
Off White |
Off White |
Off White |
|
Odor |
Slight but unpleasant |
Slight but unpleasant |
Slight but unpleasant |
Slight but unpleasant |
Slight but unpleasant |
|
pH |
3.770 |
3.723 |
3.283 |
3.037 |
3.333 |
|
In- vitro SPF |
21.1577 |
21.3068 |
19.2821 |
20.5989 |
19.7664 |
|
Anti-oxidation activity |
88.538 % |
85.950 % |
85.923 % |
78.149 % |
58.283 % |
|
Particle size |
155.1 nm |
209.9 nm |
212.5 nm |
257.2 nm |
279.6 nm |
|
Zeta potential |
- 79.5 mV |
- 71.3 mV |
- 49.9 mV |
- 44.9 mV |
-48.6 mV |
|
PDI |
0.097 |
0.188 |
0.217 |
0.096 |
0.108 |
FTIR spectra of SI samples kept for accelerated stability studies were recorded on Day 1 and Day 45. FTIR spectra of SI were studied to ensure that AA and OE are present in the sample, sufficient to develop characteristic peaks. Given below are the FTIR spectra of samples,
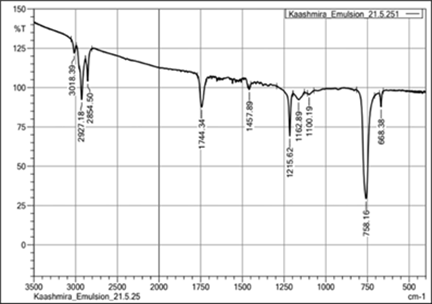
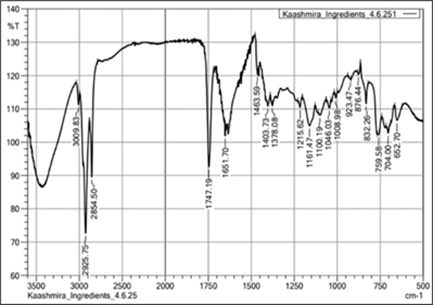
Fig. no. 12: FTIR spectra of SI Day 1 sample Fig. no. 13: FTIR spectra of SI Day 45 sample
Peaks specifically shown by AA and OE were retained in the FTIR spectrum after 45 days of accelerated stability studies. The following table gives the peaks specifically shown by OE and AA.
Table no. 14: FTIR peaks specifically shown by AA and OE in sample of SI
|
AA |
OE |
||||||
|
Reference peaks21 (cm-1) |
Day 1 sample peaks (cm-1) |
Day 45 sample peaks (cm-1) |
Significance21 |
Reference peaks 18, 19 (cm-1) |
Day 1 sample peaks (cm-1) |
Day 45 sample peaks (cm-1) |
Significance18,19 |
|
3040 |
3004.13 |
3009.83 |
C-H bond |
2929.00 |
2927.18 |
2925.75 |
O-H bond |
|
1750 |
1744.34 |
1747.19 |
C=O bond |
2857.52 |
2854.50 |
2854.80 |
C-H bond |
|
1450 |
1457.89 |
1463.59 |
C-H bond (bending) |
1678- 1668 |
1744.34 |
1747.19 |
C=C bond |
|
1125 |
1162.89 |
1161.47 |
C-O-C bond |
1375- 1465 |
1457.89 |
1463.59 |
C-H bond |
|
1030 |
1100.19 |
1100.19 |
C-O-H bond |
|
|
|
|
|
790 |
758.16 |
759.58 |
O-H bond |
|
|
|
|
PF was subjected to stability studies for a duration of 45 days. Periodically samples were withdrawn and analyzed to characterize stability of the PF over a period. To the results obtained, a statistical test Single sample t- test was applied to evaluate if results vary significantly or not.
Table no. 15: Accelerated stability study data for PF
|
Evaluation test |
Day 1 |
Day 7 |
Day 15 |
Day 30 |
Day 45 |
|
Color |
White |
White |
Off White |
Off White |
Off White |
|
Odor |
Absent |
Slight but unpleasant |
Slight but unpleasant |
Slight but unpleasant |
Slight but unpleasant |
|
Texture |
Smooth |
Smooth |
Smooth |
Smooth |
Smooth |
|
pH |
6.023 |
5.747 |
5.867 |
5.380 |
4.373 |
|
Homogeneity |
Achieved |
Achieved |
Achieved |
Achieved |
Achieved |
|
Spreadability |
2.113 cm |
2.043 cm |
1.690 cm |
2.111 cm |
1.800 cm |
|
Washability |
Easy with slight rubbing |
Easy with slight rubbing |
Easy with slight rubbing |
Easy with slight rubbing |
Easy with slight rubbing |
|
In- vitro SPF |
12.7250 |
10.0863 |
9.0990 |
9.8509 |
6.6376 |
|
Anti-oxidation activity |
88.941 % |
65.640 % |
86.213 % |
79.238 % |
66.168 % |
FTIR spectra of PF samples kept for accelerated stability studies were recorded on Day 1 and Day 45. FTIR spectra of PF were studied to ensure that AA and OE are present in the sample, sufficient to develop characteristic peaks. Given below are the FTIR spectra of samples,
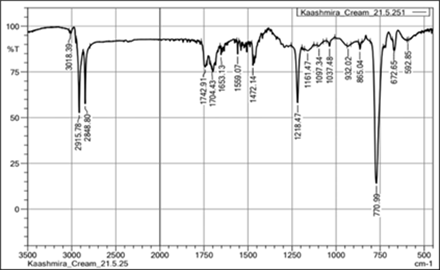
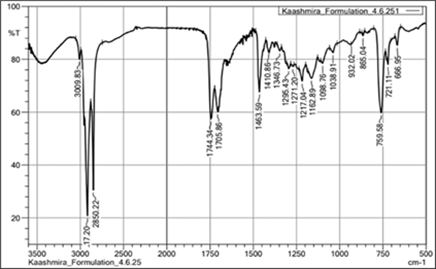
Fig. no. 14: FTIR spectra of PF Day 1 sample Fig. no. 15: FTIR spectra of PF Day 45 sample
Peaks specifically shown by AA and OE were retained in the FTIR spectrum after 45 days of accelerated stability studies. The following table gives the peaks specifically shown by OE and AA.
Table no. 16: FTIR peaks specifically shown by AA and OE in sample of PF
|
AA |
OE |
||||||
|
Reference peaks21 ( cm-1) |
Day 1 sample peaks ( cm-1) |
Day 45 sample peaks ( cm-1) |
Significance21 |
Reference peaks18, 19 ( cm-1) |
Day 1 sample peaks ( cm-1) |
Day 45 sample peaks ( cm-1) |
Significance18, 19 |
|
3040 |
3004.13 |
3009.83 |
C-H bond |
2929.00 |
2915.78 |
2917.20 |
O-H bond |
|
1750 |
1744.34 |
1744.34 |
C=O bond |
2857.52 |
2848.80 |
2850.22 |
C-H bond |
|
1450 |
1457.89 |
1463.59 |
C-H bond (bending) |
1678- 1668 |
1742.91 |
1744.34 |
C=C bond |
|
1125 |
1162.89 |
1162.89 |
C-O-C bond |
1375- 1465 |
1472.14 |
1463.59 |
C-H bond |
|
1030 |
1100.19 |
1098.76 |
C-O-H bond |
|
|
|
|
|
790 |
758.16 |
759.58 |
O-H bond |
|
|
|
|
DISCUSSION:
Determination of Concentration of the internal phase that can be loaded in emulsion: Initially emulsions with 20 % w/ w oil were developed and exposed to stress conditions. However, emulsion having Tween 60 and Span 80 showed phase separation. Thus this combination was ruled out. With the remaining two Smix using 40 % oil phase, emulsions were developed. From those emulsions, Tween 20 and Span 80 containing emulsion showed phase separation on exposure to stress conditions. The only left combination was of Tween 80 and Span 80, forming a stable emulsion containing 40 % oil. However post freeze thaw cycles, this emulsion showed separation of tiny droplet of oil. Further Tween 80 and Span 80 with 45 % oil showed phase separation on centrifugation. Thus, the selected surfactant combination was Span 80 and Tween 80 and Oil phase concentration was decided to be kept 40 % w/w.
Minimizing the Smix concentration: Exposure to excessive surfactants can lead to drying, irritation, itching of skin due to dehydration. So surfactants should be used in minimum concentration. Emulsion with 4.0 % w/ w Smix showed phase separation on centrifugation. However, emulsion with 4.5 % w/ w Smix was stable under all three stress conditions. Thus, Smix quantity was reduced to 4.5 % w/ w.
Optimization of oil ratio: Considering the data given by Pareto chart, ANOVA table, Coded equation, 2D Contour plots and 3D Surface response plots we observe that factor A, interaction factor AC and interaction factor BC significantly affect the In- vitro SPF value. Effect of factor A i.e. Olive oil and interaction factor AC (Olive oil and Sesame oil) is Negative. This means that with an increase in the amount of Olive oil in the formulation, in- vitro SPF will reduce. However, the coefficient of factor A in the coded equation is small. This signifies that though an increase in the quantity of Olive oil will reduce SPF, this reduction will not be drastic. Interaction factor AC will also reduce SPF but as indicated by its small coefficient, reduction will not be drastic. When we observe the 3D Surface Response plot for AC factors, we can clearly observe that, as the quantity of Olive oil increases (with constant quantity of sesame oil), significant reduction in SPF is not observed. However, with increasing quantities of Sesame oil, SPF is drastically reducing. Thus, highlighting the need to minimize the quantity of Sesame oil to achieve maximum SPF. This also becomes evident through the negative coefficient associated with factor C, Sesame oil. The effect of interaction factor BC is Positive and largest amongst other factors. This means that interaction between Almond oil and Sesame oil is improving SPF. However, this positive trend is not observed throughout the concentration range of Almond oil and Sesame oil, after a certain concentration trend is getting reversed. Further increase in quantity of both oils is reducing SPF. The optimized oil ratio recommended by StatEase software is 7: 1: 1 for olive oil: almond oil: sesame oil to achieve maximum in- vitro SPF. High amount of Olive oil is acceptable due to minimum SPF reduction. Low amount Sesame oil is essential to minimize its strong negative effect on SPF. A low amount of Almond oil will avoid mild negative effects and will also preserve the beneficial effect of interaction factor BC.
Table no. 17: Significance of evaluation of SI
|
Parameter |
Significance |
|
Organoleptic Properties |
Acceptable |
|
pH |
Acidic, due to L- ascorbic acid content. |
|
Dilution Test |
Dilution with water showed no phase separation, confirming the nature of emulsion as Oil- in- Water (O/ W). |
|
In-vitro SPF Determination |
Normal Indians have Skin type III and type IV (Classification of skin types given by Fitzpatrick). SPF needed to protect these skin types from harmful UV radiations is at the most 5. For skin type I which is most sensitive to UV radiations, SPF required is at least 8. (Sharma, 2014) Developed SI has SPF of 19.923 ± 0.790. Thus, confirming that developed SI will offer sufficient UV protection. |
|
Antioxidant Study (DPPH method) |
A stable DPPH radical in ethanol can absorb light of up to 517 nm. The reaction between the molecules of the antioxidants and the DPPH radical is what causes the decrease in absorbance of the radical. Therefore, DPPH is frequently employed as a material to assess antioxidant activity.20 Antioxidant study helped to understand if developed SI will show resistance towards ROS generated by sun exposure or not. SI showed 90.767 ± 0.549 % antioxidant activity. Indicating that SI will show good ROS scavenging activity. |
|
Particle Size |
Particle size and PDI help to comment on stability of emulsion. Mean particle size of emulsion was 179.867 ± 32.690 nm. The small value of particle size indicates that the oil phase is well dispersed in the aqueous phase, which is essential for stability of emulsion. |
|
PDI |
PDI was found to be 0.118 ± 0.082 confirming the Monodisperse nature of emulsion. Monodisperse emulsions are stable in nature. |
|
Zeta Potential |
For dispersion systems to remain stable, zeta potential should be ± 30 mV. (Malvern, 2015) Larger value of zeta potential indicates that there is sufficient charge available on the surface of dispersed phase droplets. This charge will prevent coalescence of dispersed droplets due to repulsive forces between the droplets. SI has a zeta potential of -77.733 ± 1.514 mV, indicating stability of SI. |
Formulation: Vanishing cream is designed to spread easily on skin and then rapidly vanish leaving behind a thin, invisible layer. (Rieger, 2009) They are light in feel being oil- in- water emulsion, formula is well established and formulation is simple. Thus, vanishing cream was decided to be used for developing PF.
Evaluation:
Table no. 18: Significance of evaluation of PF
|
Parameter |
Significance |
|
Organoleptic Properties |
Acceptable |
|
Homogeneity |
Homogeneous mixing of SI with base was achieved as indicated by absence of clumps and grittiness on touch. |
|
pH |
PF had a pH of 6.023 ± 0.015 (N=3). pH of skin ranges from 4 to 6. (Bikiaris, 2023) PF has pH very close to that of pH of skin thus ensuring that formulation will not cause any irritation to skin. |
|
Spreadability |
Spreadability is essential for topical formulations like sunscreens because more the spreadability of formulation, more skin surface area will be covered by formulation thus better sun protection will be achieved. PF was observed to spread easily. |
|
Washability |
Sunscreen formulations should stay over the surface of skin even on exposure to water, to ensure that sun protection is achieved even while engaging in water sports. However, over a period formulation should get washed- off ensuring that it does not turn comedogenic. PF required rubbing of the glass slide to wash it off. This indicates that formulation will stay over the surface of skin and not get easily washed- off, which is desirable. |
|
In-vitro SPF Determination |
PF had SPF of 12.7253, which is more than that of SPF required to protect sensitive skin against sun damage. This indicates the capability of PF to protect skin against sun damage. |
|
Antioxidant Study (DPPH method) |
Antioxidant activity of PF was found to be 88.941 %. This indicates that PF was showing good enough antioxidant activity, having been formulated using well established anti-oxidants AA and OE. |
|
Viscosity |
Mean viscosity was found to be 2466.667 cP, meeting user expectations for texture and usability. |
|
Assay ( for AA and OE content) |
When absorbance of sample solutions were recorded it was observed that recorded absorbance’s were very high. Investigation revealed that oils absorbed heavily at around wavelength of maximum absorption of AA and OE. Several solvents were used like Acetonitrile, Ethanol, Methanol and their aqueous mixtures, blend of methanol and ethanol with 20 % and 40 % ammonia were also used. However, no solvent system was able to reduce interference from oils. AA having good absorptivity was showing significant absorbance at 293 nm, wavelength of maximum absorbance of OE. This further complicated the situation. Thin layer Chromatography (TLC) was performed to separate oils from AA and OE, however due to lipophilic nature, OE did not separate from oils. Instead, both oils and OE showed similar travel. As a result, quantitation of AA and OE in PF was not possible. |
|
In- vitro SPF determination according to COLIPA- 2011 guidelines |
As determined by this method in- vitro SPF of PF was found to be 1.08 ± 0.01. Significant difference is observed in the SPF determined using Mansur’s equation and according to the method given by COLIPA guidelines which involves use of PMMA plates. PMMA plates mimic human skin, thus giving results that are more representative of in- vivo results. This SPF comparison highlights the need of developing a suitable in- vitro method of determining SPF, which can be performed easily on laboratory scale giving results like those obtained by the methods given by regulatory guidelines. |
Organoleptic properties of SI were unaffected by exposure to accelerated conditions. Statistical analysis of data revealed that pH, in- vitro SPF, Antioxidant activity and PDI of SI are not significantly different from the day 1 results. This indicates that even on exposure to stress conditions in- vitro SPF and Antioxidant activity of SI are remaining unaffected. Statistical analysis reveals that particle size and zeta potential for SI has changed significantly in 45 days. Though there is significant decline in zeta potential over a period, zeta potential is more than ± 30 mV. Particle size though increasing significantly, values do not suggest large instability of emulsion. Thus, the conclusion is that although particle size and zeta potential are varying significantly, this variability is not capable of bringing about immediate instability in the developed SI.
Peaks specifically shown by AA and OE were retained in the FTIR spectrum after 45 days of accelerated stability studies, suggesting that AA and OE are present in considerable quantities in the formulation even after exposure to stress conditions.
Thus, based on accelerated stability studies conducted, we conclude that developed SI is remaining stable.
Organoleptic properties, Homogeneity and Washability of PF were unaffected by exposure to accelerated conditions. Statistical analysis of data revealed that pH, Spreadability and Antioxidant activity of PF are not significantly different from the day 1 results whereas, in- vitro SPF has declined significantly. Reasons for decline in SPF can be attributed to pH changes in formulation affecting stability of oils, degradation of oils and antioxidants. Reduction in pH of PF can be due to degradation of AA. Though not significant, reduction in antioxidant activity is observed, indicating loss of some amount of antioxidant.
An interesting observation is noted in antioxidant activity during accelerated stability studies of PF. After 7 days of study, the antioxidant activity of PF has dropped drastically to around 65 % however, on 15th day the activity has improved again to around 85 %. This can be attributed to the fact that, due to stress conditions one or both antioxidants in small quantities must have got oxidized, as indicated by reduced antioxidant activity. However, as reported in literature Vitamin C and Vitamin E work synergistically. When one of the vitamins is oxidized the other one revives the oxidized vitamin. This chain continues, and thus stability of both improves. (Bikiaris et al.,2023, Packer et al.,2001). Similar behavior is observed here, a desired synergy between AA and OE is developed.
Peaks specifically shown by AA and OE were retained in the FTIR spectrum after 45 days of accelerated stability studies, suggesting that AA and OE are present in considerable quantities in the formulation even after exposure to stress conditions.
Overall based on accelerated stability studies conducted, we can conclude that developed PF is remaining stable, however reduction in SPF needs to be investigated.
CONCLUSION:
The present study successfully formulated and evaluated a novel sunscreen ingredient as an Oil-in-Water emulsion incorporating natural Vegetable oils, L-ascorbic acid, Tocotrienol, and Kaolin. The optimized emulsion demonstrated satisfactory SPF, antioxidant activity, stability, and appropriate physicochemical characteristics. Incorporation into a vanishing cream base produced a prototype formulation with acceptable SPF, antioxidant activity, spreadability, pH, and homogeneity. The approach highlights the potential of combining natural oils and antioxidants to minimize use of organic UV filters, addressing safety and consumer preferences for natural sun protection while ensuring effective skin care. Study was limited by the inability to quantify antioxidants and lacks in-vivo validation.
ACKNOWLEDGEMENT:
I am deeply thankful to my professors, family and friends for their unwavering support and constant encouragement throughout the course of this project. I express my deep sense of gratitude to Orah NutriChem Pvt., Ltd., Pune for providing a gift sample of Orah Vit E.
REFERENCES

Kashmira Wagh, Dr. Sushma Singh, Dr. Paraag Gide, Kajal Deshmukh, Dr. Roheit Dubepatil, Formulation and Evaluation of a Sunscreen Ingredient, Int. J. of Pharm. Sci., 2026, Vol 4, Issue 1, 975-993. https://doi.org/10.5281/zenodo.18207670
 10.5281/zenodo.18207670
