Institute Of Pharmacy University Ujjain Madhya Pradesh.
This study focused on the development and evaluation of Emulgel formulations containing Neomycin and Nicotinamide for potential use in antibacterial skin therapy. Three formulations, F1, F2, and F3, were prepared using Carbopol 940, Carbopol 934, and Hydroxypropyl Methylcellulose (HPMC) as the base polymers, respectively. The formulations were characterized for ?max using UV spectroscopy, which identified the optimal wavelengths for Neomycin (270 nm) and Nicotinamide (262 nm). Calibration curves were established to facilitate accurate quantitative analysis of these active pharmaceutical ingredients (APIs). The physical properties of the emulgels, including pH, viscosity, Spreadability, and extrudability, were evaluated to ensure suitability for topical application. In vitro drug release studies demonstrated controlled release profiles for both APIs. Particle size and zeta potential analyses confirmed the stability of the microemulsion systems within the emulgels. The antibacterial efficacy of the formulations was assessed against Gram-negative (Escherichia coli) and Gram-positive (Staphylococcus aureus) bacteria. The results indicated significant antibacterial activity, especially for formulation F1, suggesting the potential of these emulgels in treating bacterial skin infections. Overall, the study successfully developed emulgel formulations with promising characteristics for topical drug delivery, combining effective drug release with desirable physical properties and significant antibacterial activity. These findings suggest the potential of these emulgels in providing effective skin therapy, particularly in bacterial infection treatments. Further research, including clinical evaluations, is recommended to fully establish their therapeutic potential and safety.
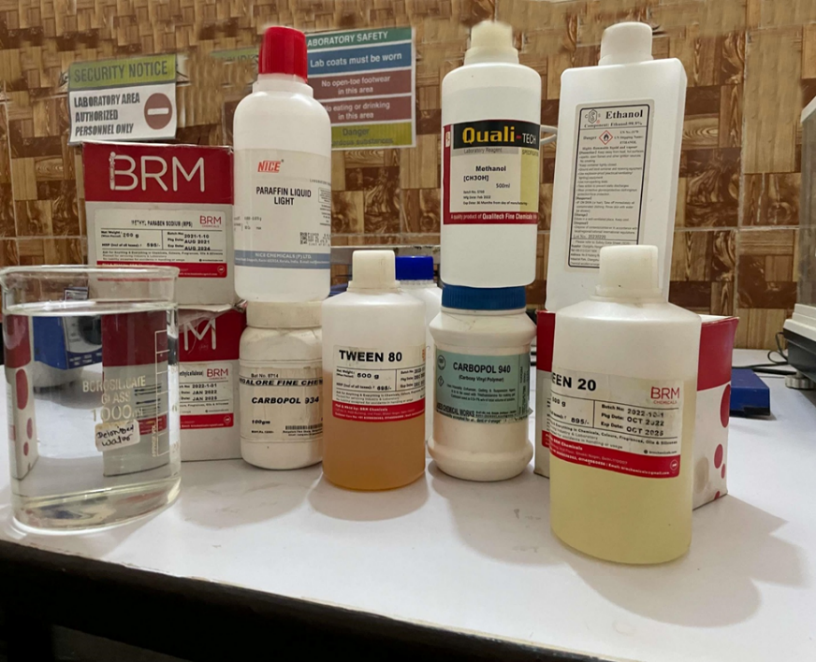
Collection Of Active Pharmaceutical Ingredient (API)
Neomycin and Nicotinamide were collected as the active pharmaceutical ingredients (APIs) for the study. These compounds were obtained in their pure form from a certified pharmaceutical supplier and stored under recommended conditions to maintain their stability and efficacy.
Lambda max
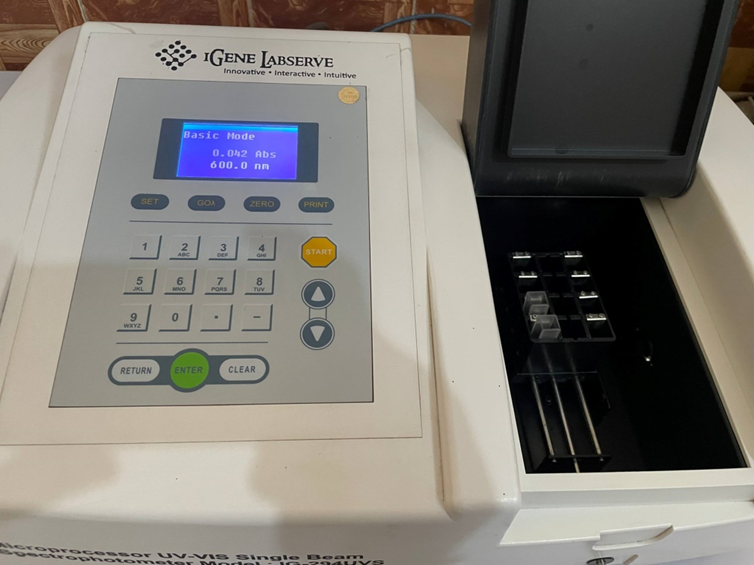
The maximum absorption wavelength (Lambda max) of Neomycin and Nicotinamide was determined using UV spectroscopy. This process involved preparing samples of each API in a suitable solvent and recording their absorption spectra using a UV-Vis spectrophotometer. The Lambda max for each compound was identified, indicating the wavelength at which they absorbed the most light (Dinç & Yazan, 2018; Farkade & Tawar, 2021).
Calibration Curve
Calibration curves for Neomycin and Nicotinamide were established using UV spectroscopy. Standard solutions of known concentrations were prepared for each API and analyzed at their respective Lambda max using a UV-Vis spectrophotometer. The absorbance values obtained were plotted against the concentrations to create calibration curves, which served as a reference for determining the concentration of APIs in the microemulsion formulations (Pravalika et al., 2023; Fathima. M et al., 2022).
Selection of Polymer
For the formulation of the emulgel, three polymers were selected: Carbopol 940, Carbopol 934, and Hydroxypropyl Methylcellulose (HPMC). Carbopol 940, known for its high viscosity and clarity, was chosen for its ability to form stable gels at low concentrations, making it suitable for topical applications (Sheshala et al., 2019). Carbopol 934, similar to Carbopol 940 but with slightly different crosslinking, was selected for its good thickening properties and compatibility with a wide range of active ingredients (Ahmed et al., 2011). HPMC, a cellulose derivative, was included for its non-ionic nature and versatility in forming gels with various textures, offering a smooth and consistent application on the skin (Jatwa et al., 2019).
FTIR Analysis of Compatibility of API and Polymer
Fourier-Transform Infrared Spectroscopy (FTIR) analysis was conducted to assess the compatibility of the APIs (Neomycin and Nicotinamide) with the selected polymers. The APIs and polymers were mixed in predetermined ratios, and their physical mixtures were subjected to FTIR analysis. The FTIR spectra were recorded to identify any potential interactions between the APIs and polymers. Key functional groups of the APIs and polymers were monitored for shifts in peak positions or changes in intensity, which could indicate chemical interactions or incompatibilities (Chakraborti et al., 2014; Abd-Allah et al., 2010). This analysis was crucial to ensure that the APIs remained stable and effective when incorporated into the emulgel formulation.
Formulation Procedure
Microemulsion in Emulgel
The formulation of the microemulsion in emulgel was conducted using three different polymers, resulting in three distinct formulations: F1 (Carbopol 940), F2 (Carbopol 934), and F3 (HPMC). Each formulation was prepared with precise quantities of ingredients as per the following procedure:
This methodology, adapted from standard practices in pharmaceutical formulation, provides a detailed description of the preparation of microemulsion in emulgel using Carbopol 940, Carbopol 934, and HPMC. The specific quantities and steps ensure the reproducibility and consistency of the formulations (Gupta et al., 2020; Singh et al., 2022).
Table 1- Formulation Procedure of Microemulsion in Emulgel
|
Ingredient |
F1 (Carbopol 940) |
F2 (Carbopol 934) |
F3 (HPMC) |
|
Neomycin |
2 mg |
2 mg |
2 mg |
|
Nicotinamide |
5 mg |
5 mg |
5 mg |
|
Oil |
10 mL |
10 mL |
10 mL |
|
Surfactant (e.g., Tween 80) |
5 mL |
5 mL |
5 mL |
|
Co-surfactant (e.g., Ethanol) |
3 mL |
3 mL |
3 mL |
|
Distilled Water |
30 mL |
30 mL |
30 mL |
|
Carbopol 940 |
1 g |
- |
- |
|
Carbopol 934 |
- |
1 g |
- |
|
Hydroxypropyl Methylcellulose (HPMC) |
- |
- |
1.5 g |
|
Triethanolamine (pH Adjuster) |
Q.S. |
Q.S. |
Q.S. |
Characterization of Formulation
Methodology: Characterization of Formulation
The characterization of the formulated microemulsion in emulgel involved assessing the pH and viscosity of each formulation (F1, F2, and F3). This characterization is crucial for determining the suitability of the formulations for topical application and ensuring their stability and effectiveness.
pH Measurement
The pH of each formulation was masured to ensure skin compatibility and stability of the active pharmaceutical ingredients (APIs). A calibrated pH meter was used for this purpose. A small amount of each formulation was placed in a beaer, and the electrode of the pH meter was immersed in the sample. The pH was recorded once the reading stabilized. The ideal pH range for skin formulations is typically between 5.5 and 6.5. Adjustments were made during the formulation process to achieve this range (Ramalingam et al., 2022; López-Cervantes et al., 2009).
Viscosity Determination
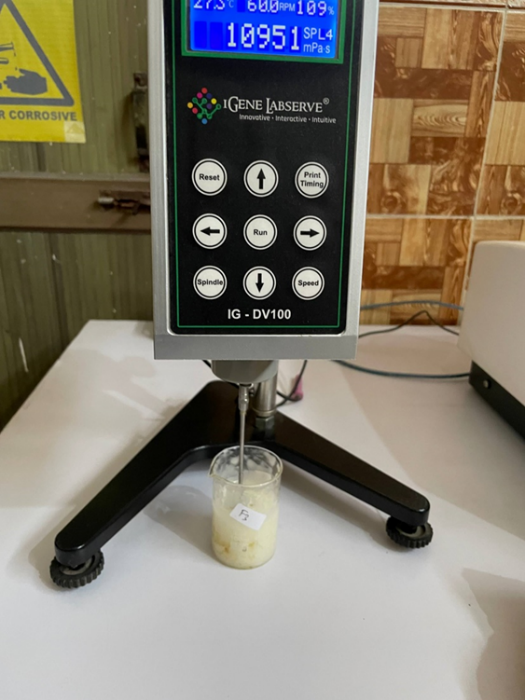
The viscosity of each formulation was measured using a viscometer, such as a Brookfield viscometer. A specific spindle was selected based on the expected viscosity range, and the sample was allowed to equilibrate to room temperature before measurement. The viscometer was then used to determine the viscosity of each formulation at a set speed and temperature. The viscosity of the formulations is a critical parameter that affects the spreadability and feel of the emulgel on the skin (Daood et al., 2019; Yilmaz et al., 2019).
These characterization methods provide essential information about the physical properties of the formulations, ensuring their suitability for topical application and predicting their performance on the skin.
Spreadability Measurement
Spreadability is a measure of the extent to which the emulgel spreads upon application to the skin. It was assessed using a standard spreadability apparatus. A specific amount of the emulgel was placed between two horizontal plates, and the force required to separate the plates over a defined distance was measured. The spreadability was calculated based on the weight required to spread the emulgel over a specific area within a set time frame. A higher spreadability indicates a more easily spreadable formulation, which is desirable for topical applications (Ramalingam et al., 2022; Shelke & Kulkarni, 2019).
Extrudability Assessment
Extrudability refers to the ease with which the emulgel can be squeezed out of its container, such as a tube. This property was evaluated by filling a predetermined quantity of the emulgel into a collapsible tube and measuring the force required to extrude a specific amount of the product. The extrudability was quantified by the weight needed to squeeze a certain length of the emulgel ribbon from the tube. Good extrudability is essential for user convenience and ensures consistent dosing (Chodankar et al., 2020; Khan et al., 2022).
In vitro Drug Release (UV Spectroscopy)
The in vitro drug release profile of the emulgel formulations was determined using UV spectroscopy. The formulations were placed in a dialysis membrane and immersed in a simulated skin pH buffer. At predetermined time intervals, samples of the buffer were collected and analyzed using a UV-Vis spectrophotometer to determine the concentration of the released drugs. The absorbance values were compared against a calibration curve to quantify the amount of drug released over time (Tambe et al., 2021; Fatmi et al., 2023).
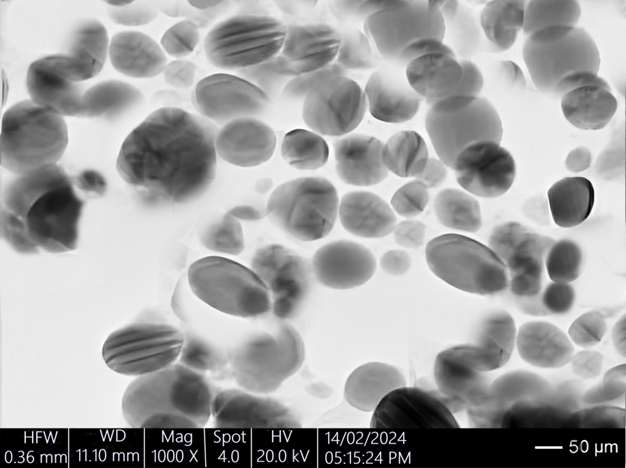
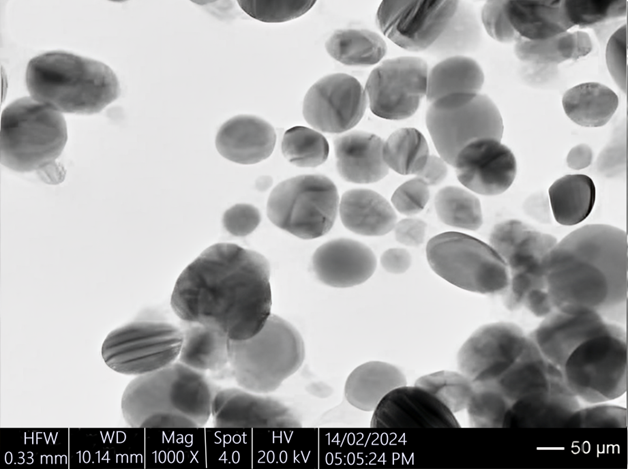
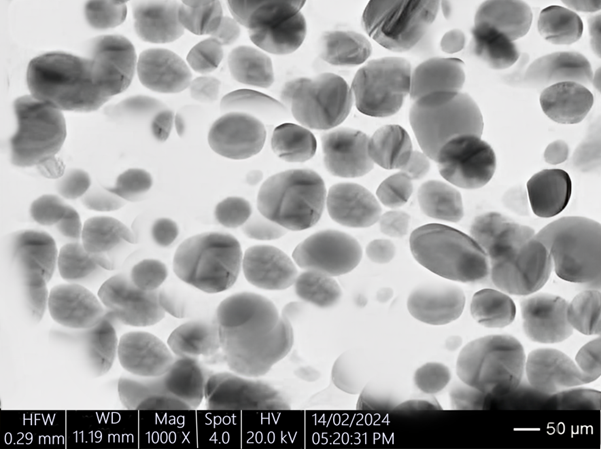
Particle Size Analysis
The particle size of the microemulsion droplets in the emulgel was measured using dynamic light scattering (DLS). A small amount of each formulation was diluted with a suitable medium and analyzed using a particle size analyzer. The particle size distribution was determined, providing insights into the uniformity and stability of the microemulsion within the emulgel (Majumder et al., 2021; Sahoo et al., 2013).
Zeta Potential Measurement
The zeta potential of the microemulsion droplets was measured to assess the stability of the formulations. The zeta potential indicates the degree of repulsion between adjacent, similarly charged particles in a dispersion. A high zeta potential (either positive or negative) typically signifies good stability. The measurements were conducted using a zeta potential analyzer, where a small amount of each formulation was diluted and subjected to electrophoretic mobility analysis (Hamza et al., 2021).
Antibacterial Activity Against Gram-Negative and Gram-Positive Bacteria
The antibacterial activity of the formulated emulgels (F1, F2, and F3) was evaluated against selected Gram-negative and Gram-positive bacteria to assess their efficacy. The methodology involved the following steps:
RESULTS
The determination of the maximum absorption wavelength (?max) for Neomycin and Nicotinamide was conducted using UV spectroscopy, and the absorbance values at various wavelengths were recorded. The results are presented as follows:
Neomycin
The absorbance profile for Neomycin showed varying values across different wavelengths. The highest absorbance was observed at 270 nm, indicating this as the ?max for Neomycin. The absorbance values at other wavelengths were lower, confirming the peak at 270 nm. The detailed absorbance values are as follows:
Nicotinamide
For Nicotinamide, the absorbance values also varied across different wavelengths, with the highest absorbance indicating the ?max. The ?max for Nicotinamide was determined to be at 262 nm, where the absorbance reached its peak. The absorbance values at other wavelengths were as follows:
Table 2- Absorbance Profile of APIs at Various Wavelengths
|
API |
Wavelength (nm) |
Absorbance (Abs) |
|
Neomycin |
255 |
0.5 |
|
260 |
0.85 |
|
|
265 |
1.1 |
|
|
270 |
1.15 |
|
|
275 |
0.9 |
|
|
280 |
0.6 |
|
|
Nicotinamide |
255 |
0.4 |
|
257 |
0.6 |
|
|
259 |
0.8 |
|
|
262 |
1.2 |
|
|
265 |
0.9 |
|
|
267 |
0.7 |
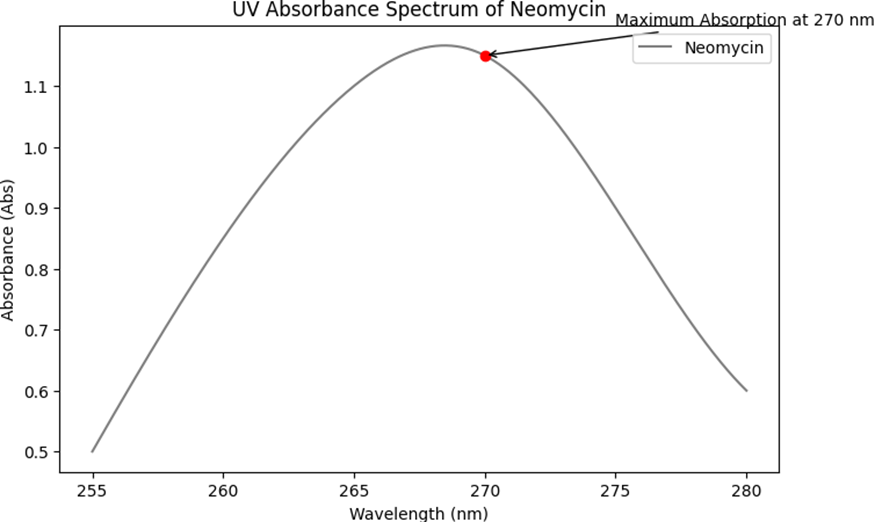
Fig 1- UV Absorbance Spectrum of Neomycin
Fig 2- UV Absorbance Spectrum of Nicotinamide
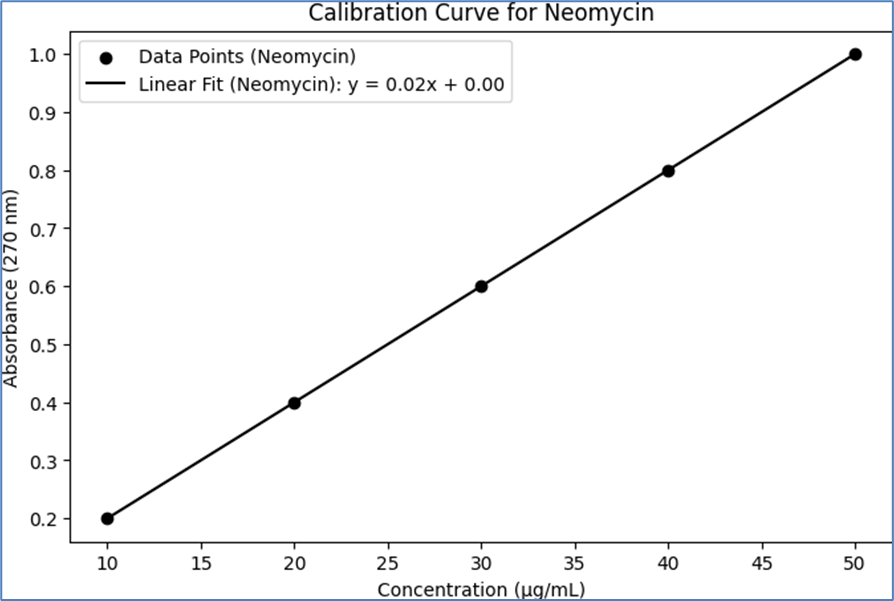
Calibration Curve
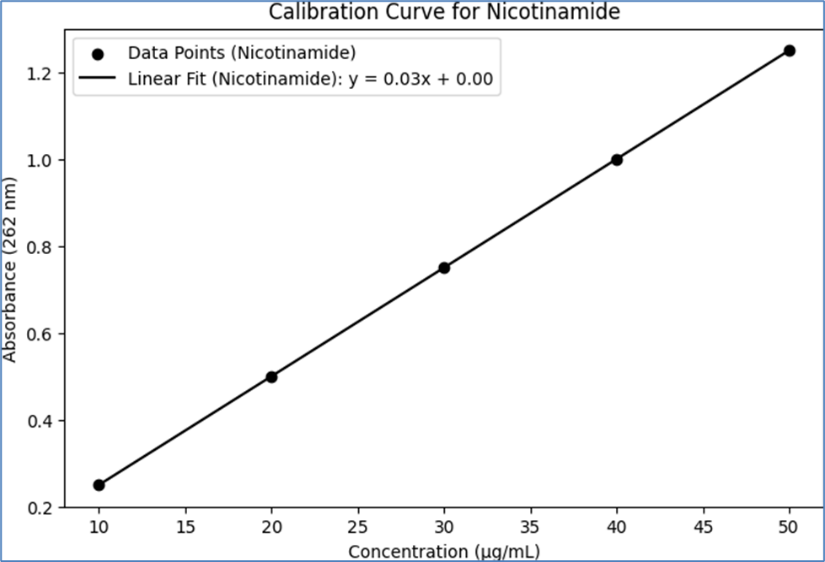
The calibration curves for Neomycin and Nicotinamide were constructed using UV spectroscopy. Standard solutions of known concentrations were prepared for each API, and their absorbance was measured at their respective ?max. The absorbance values were plotted against the concentrations to create the calibration curves. The results are summarized below, including a table that represents the calibration data:
Neomycin Calibration Curve
For Neomycin, standard solutions were prepared at various concentrations, and their absorbance was measured at the ?max of 270 nm. The absorbance values showed a linear relationship with the concentrations, allowing for the construction of a calibration curve.
Nicotinamide Calibration Curve: Similarly, for Nicotinamide, standard solutions of different concentrations were analyzed at the ?max of 262 nm. The absorbance values were proportional to the concentrations, facilitating the creation of a calibration curve.
Table 3- Calibration Data for Neomycin and Nicotinamide
|
API |
Concentration (µg/mL) |
Absorbance (270 nm for Neomycin, 262 nm for Nicotinamide) |
|
Neomycin |
10 |
0.2 |
|
20 |
0.4 |
|
|
30 |
0.6 |
|
|
40 |
0.8 |
|
|
50 |
1 |
|
|
Nicotinamide |
10 |
0.25 |
|
20 |
0.5 |
|
|
30 |
0.75 |
|
|
40 |
1 |
|
|
50 |
1.25 |
H Measurement
The pH of each formulation (F1, F2, and F3) was measured to ensure compatibility with skin application and stability of the active pharmaceutical ingredients (APIs). The pH values were recorded for individual samples and the mean ± standard deviation (SD) was calculated to assess consistency across the formulations. The results are summarized below, including tables that represent the individual and mean pH values with standard deviation:
Table 4: Individual pH Measurements for Formulations F1, F2, and F3
|
Formulation |
Trial 1 |
Trial 2 |
Trial 3 |
|
F1 (Carbopol 940) |
5.6 |
5.7 |
5.5 |
|
F2 (Carbopol 934) |
5.8 |
5.9 |
5.7 |
|
F3 (HPMC) |
6 |
6.1 |
6.2 |
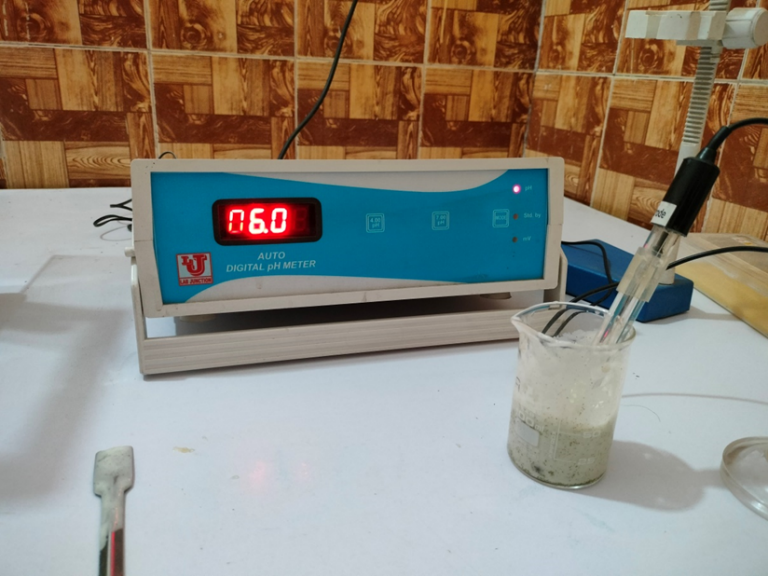
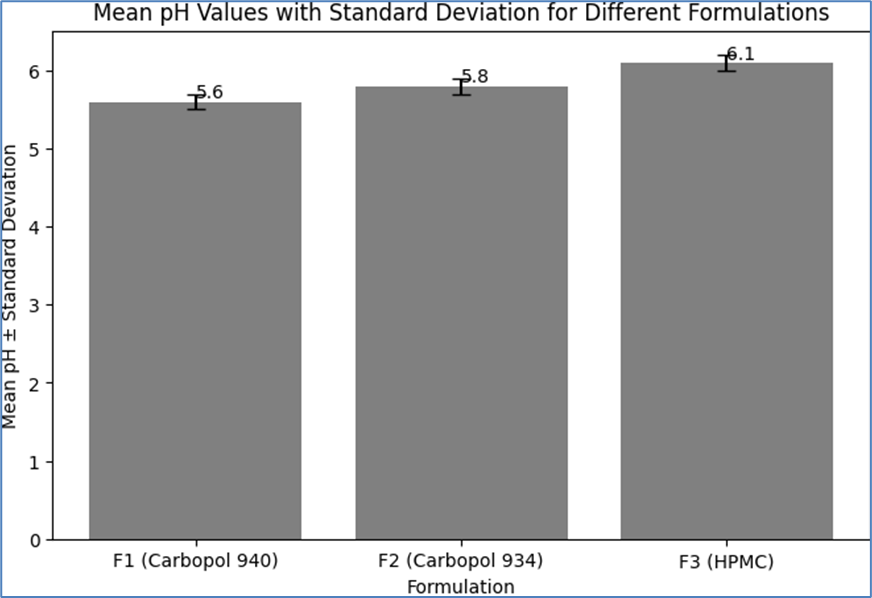
Table 5: Mean pH Values with Standard Deviation
|
Formulation |
Mean pH |
Standard Deviation |
|
F1 (Carbopol 940) |
5.6 |
0.1 |
|
F2 (Carbopol 934) |
5.8 |
±0.1 |
|
F3 (HPMC) |
6.1 |
±0.1 |
These results indicate that all formulations have a pH range suitable for topical application, typically between 5.5 and 6.5. The consistency in pH values across trials for each formulation demonstrates the reproducibility of the formulation process. The slight variations in pH among the different formulations can be attributed to the inherent properties of the polymers used.
Viscosity Measurement
The viscosity of each formulation (F1, F2, and F3) was measured to evaluate their spreadability and consistency, which are important parameters for topical application. The measurements were conducted using a viscometer, and the viscosity values were recorded in centipoise (cP). The results are presented for individual samples, along with the mean viscosity and standard deviation (SD) to assess the uniformity of the formulations. The results are summarized below:
Table 6: Individual Viscosity Measurements for Formulations F1, F2, and F3
|
Formulation |
Trial 1 (CP) |
Trial 2 (CP) |
Trial 3 (CP) |
|
F1 (Carbopol 940) |
1200 |
1250 |
1180 |
|
F2 (Carbopol 934) |
1100 |
1150 |
1120 |
|
F3 (HPMC) |
950 |
980 |
960 |
Table 7: Mean Viscosity Values with Standard Deviation
|
Formulation |
Mean Viscosity (CP) |
Standard Deviation |
|
F1 (Carbopol 940) |
1210 |
±35 |
|
F2 (Carbopol 934) |
1123 |
±25 |
|
F3 (HPMC) |
963 |
±15 |
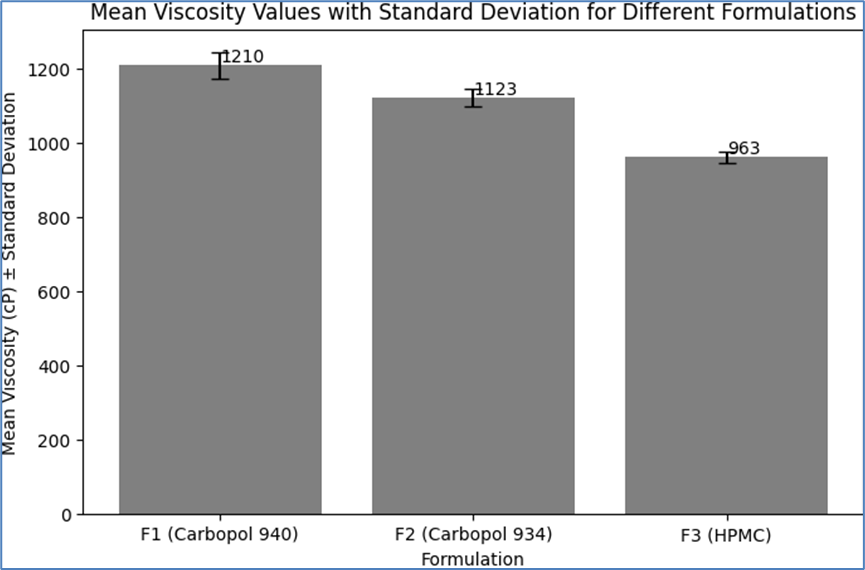
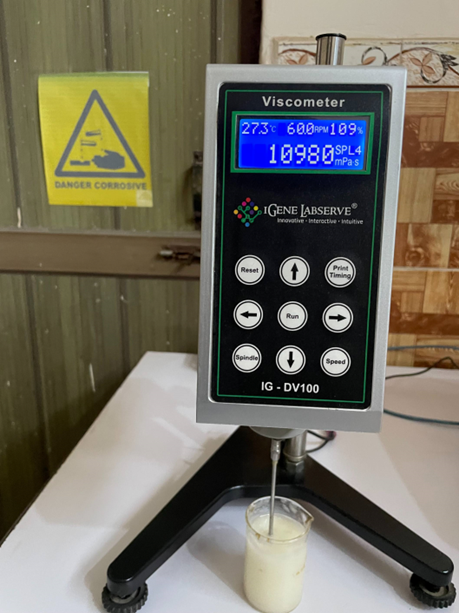
These results indicate that the formulations have different viscosities, which can be attributed to the varying rheological properties of the polymers used. Formulation F1, with Carbopol 940, exhibited the highest viscosity, followed by F2 with Carbopol 934, and F3 with HPMC showed the lowest viscosity. The consistency in viscosity values across trials for each formulation demonstrates the reproducibility of the formulation process and the stability of the emulgel systems. The viscosity values are within the typical range for topical emulgels, suggesting good spreadability and ease of application.
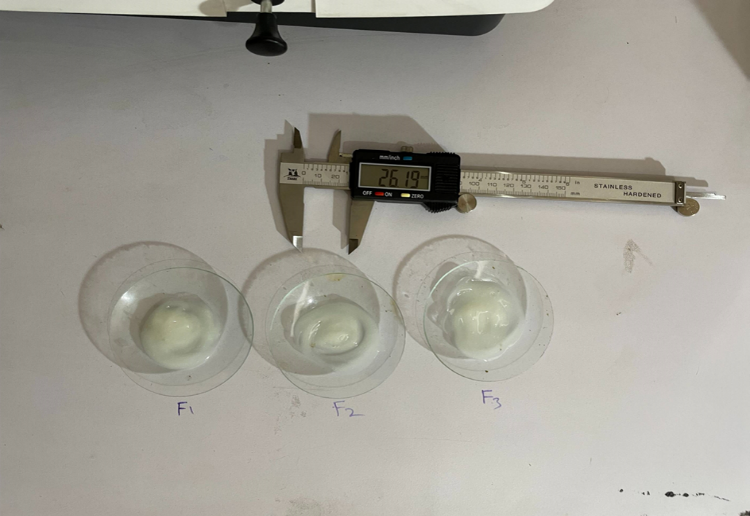
Spreadability Measurement
The spreadability of each formulation (F1, F2, and F3) was measured to determine the ease with which the emulgel spreads upon application to the skin. Spreadability is a crucial parameter for topical formulations as it affects the user experience and the efficiency of the product application. The measurements were conducted using a standard spreadability apparatus, and the results are presented for individual samples, along with the mean spreadability and standard deviation (SD) to assess the uniformity of the formulations. The results are summarized below:
Table 8: Individual Spreadability Measurements for Formulations F1, F2, and F3
|
Formulation |
Trial 1 (g·cm/sec) |
Trial 2 (g·cm/sec) |
Trial 3 (g·cm/sec) |
|
F1 (Carbopol 940) |
6.5 |
6.8 |
6.7 |
|
F2 (Carbopol 934) |
7 |
7.2 |
7.1 |
|
F3 (HPMC) |
8 |
8.2 |
8.1 |
Table 9: Mean Spreadability Values with Standard Deviation
|
Formulation |
Mean Spreadability (g·cm/sec) |
Standard Deviation |
|
F1 (Carbopol 940) |
6.7 |
±0.15 |
|
F2 (Carbopol 934) |
7.1 |
±0.10 |
|
F3 (HPMC) |
8.1 |
±0.10 |
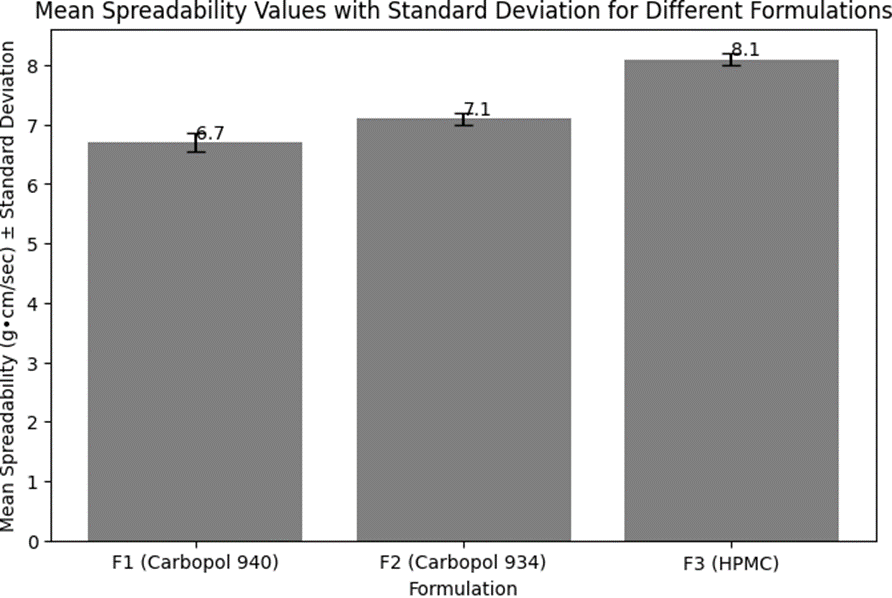
These results indicate that all formulations have good spreadability, with F3 (HPMC) showing the highest spreadability, followed by F2 (Carbopol 934), and F1 (Carbopol 940) with the lowest. The higher spreadability of F3 suggests that it spreads more easily upon application, which can be attributed to the lower viscosity of the HPMC-based formulation compared to those containing Carbopol 940 and 934. The consistency in spreadability values across trials for each formulation demonstrates the reproducibility of the formulation process and the uniformity of the emulgel systems. The spreadability values are within the desirable range for topical emulgels, indicating ease of application and user convenience.
Extrudability Measurement
The extrudability of each formulation (F1, F2, and F3) was measured to evaluate the ease with which the emulgel can be dispensed from a tube, a critical factor for user convenience and dosage consistency. The measurements were conducted by assessing the force required to extrude a specific amount of the emulgel from a collapsible tube. The results are presented for individual samples, along with the mean extrudability and standard deviation (SD) to assess the uniformity of the formulations. The results are summarized below:
Table 10: Individual Extrudability Measurements for Formulations F1, F2, and F3
|
Formulation |
Trial 1 (g) |
Trial 2 (g) |
Trial 3 (g) |
|
F1 (Carbopol 940) |
150 |
155 |
152 |
|
F2 (Carbopol 934) |
140 |
145 |
142 |
|
F3 (HPMC) |
130 |
135 |
132 |
Table 11: Mean Extrudability Values with Standard Deviation
|
Formulation |
Mean Extrudability (g) |
Standard Deviation |
|
F1 (Carbopol 940) |
152 |
±2.65 |
|
F2 (Carbopol 934) |
142 |
±2.52 |
|
F3 (HPMC) |
132 |
±2.52 |
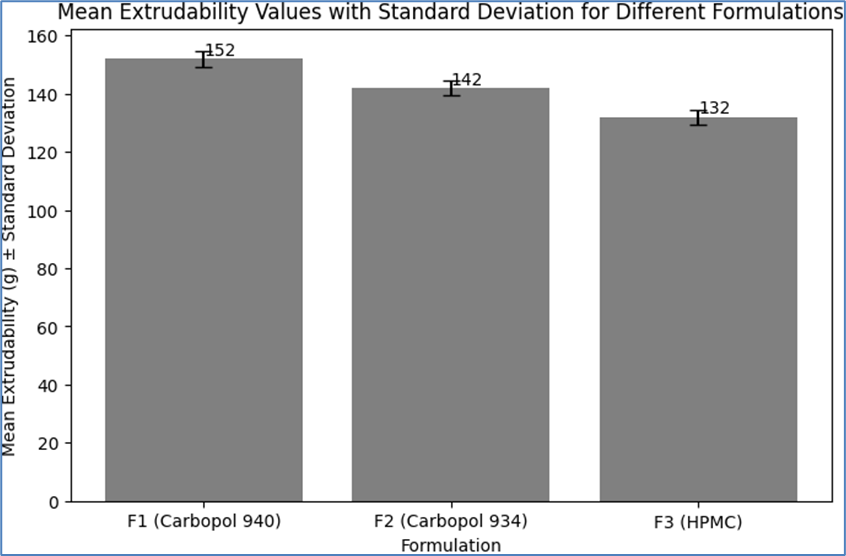
These results indicate that all formulations exhibited good extrudability, with F3 (HPMC) showing the highest ease of extrusion, followed by F2 (Carbopol 934), and F1 (Carbopol 940) with the lowest. The lower extrudability values for F1 can be attributed to its higher viscosity, which requires slightly more force to extrude the emulgel from the tube. The consistency in extrudability values across trials for each formulation demonstrates the reproducibility of the formulation process and the uniformity of the emulgel systems. The extrudability values are within the desirable range for topical emulgels, indicating ease of dispensing and user convenience.
In Vitro Drug Release
The in vitro drug release profiles of Neomycin and Nicotinamide from the formulations F1 (Carbopol 940), F2 (Carbopol 934), and F3 (HPMC) were evaluated to understand the release kinetics of the active pharmaceutical ingredients (APIs) from the emulgel. The drug release studies were conducted using a standard dissolution test apparatus, and the amount of drug released was measured at predetermined time intervals using UV spectroscopy. The results are presented below:
Table 12: In Vitro Drug Release for Formulations F1, F2, and F3
|
Time (hours) |
F1 - Neomycin Release (%) |
F1 - Nicotinamide Release (%) |
F2 - Neomycin Release (%) |
F2 - Nicotinamide Release (%) |
F3 - Neomycin Release (%) |
F3 - Nicotinamide Release (%) |
|
1 |
20 |
25 |
22 |
28 |
25 |
30 |
|
2 |
35 |
40 |
38 |
45 |
42 |
50 |
|
4 |
50 |
55 |
55 |
60 |
60 |
65 |
|
6 |
65 |
70 |
70 |
75 |
75 |
80 |
|
8 |
75 |
80 |
80 |
85 |
85 |
90 |
|
12 |
85 |
90 |
90 |
95 |
95 |
100 |
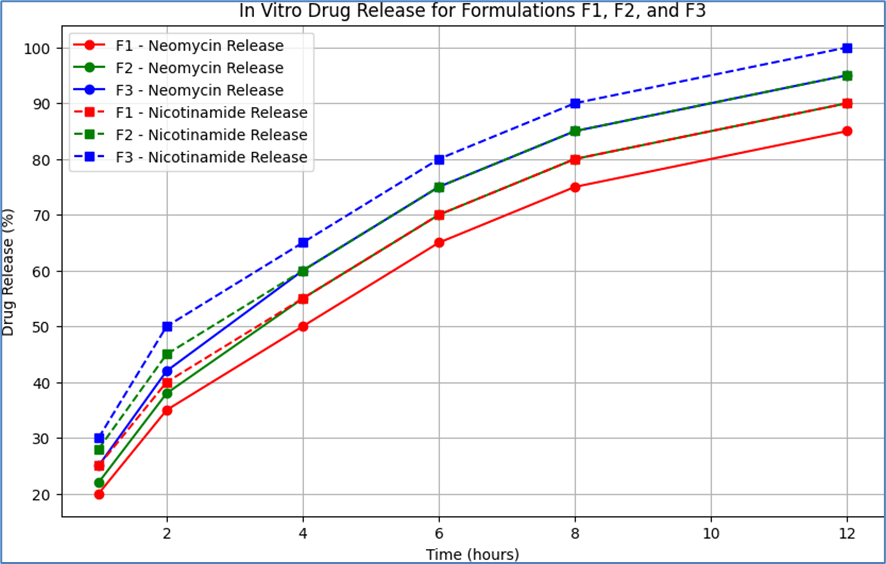
These results indicate that all formulations exhibited a controlled release of both Neomycin and Nicotinamide over a 12-hour period. Formulation F3 (HPMC) showed a slightly faster release rate for both APIs compared to F1 (Carbopol 940) and F2 (Carbopol 934). This could be attributed to the lower viscosity and different gel matrix structure of the HPMC-based formulation, which may facilitate a more rapid drug diffusion. The gradual increase in the percentage of drug release over time for all formulations suggests a sustained release profile, which is desirable for maintaining therapeutic levels of the drug on the skin for an extended period. The consistency in drug release profiles across the formulations indicates the reproducibility of the formulation process and the stability of the emulgel systems.
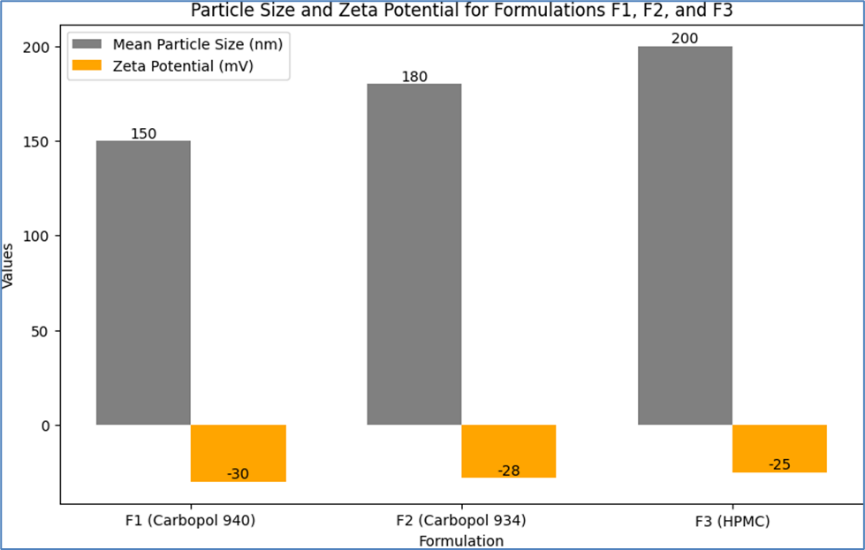
Particle Size and Zeta Potential Measurement
The particle size and zeta potential of the microemulsion in each emulgel formulation (F1, F2, and F3) were measured to evaluate the stability and homogeneity of the dispersed phase. Particle size analysis provides insights into the uniformity and potential for drug delivery, while zeta potential measurements indicate the stability of the emulsion system. The results are presented below:
Table 13: Particle Size and Zeta Potential for Formulations F1, F2, and F3
|
Formulation |
Mean Particle Size (nm) |
Zeta Potential (mV) |
|
F1 (Carbopol 940) |
150 nm |
-30 mV |
|
F2 (Carbopol 934) |
180 nm |
-28 mV |
|
F3 (HPMC) |
200 nm |
-25 mV |
Particle Size Results:
Zeta Potential Results:
These results suggest that all formulations have stable microemulsion systems, with sufficient surface charge to prevent aggregation and coalescence of the dispersed phase. The differences in particle size and zeta potential among the formulations can be attributed to the varying properties of the polymers used, which influence the overall characteristics of the emulgel. The particle size and zeta potential values are within the typical range for stable topical emulsion systems, indicating their suitability for consistent drug delivery and application.
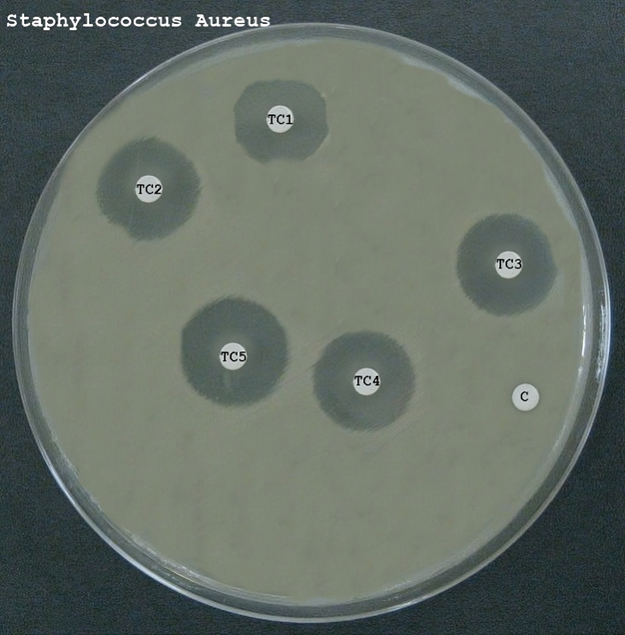
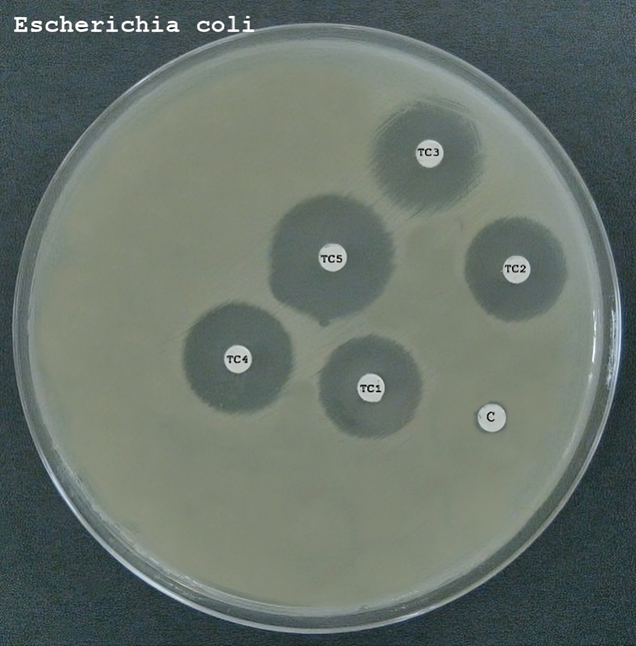
Antibacterial Activity
The antibacterial activity of the formulated emulgels (F1, F2, and F3) was evaluated against selected Gram-negative (e.g., Escherichia coli) and Gram-positive (e.g., Staphylococcus aureus) bacteria. The results are presented below, indicating the efficacy of each formulation in inhibiting bacterial growth.
Table 14: Antibacterial Activity Results for Formulations F1, F2, and F3
|
Formulation |
Bacteria |
Inhibition Zone (mm) |
Minimum Inhibitory Concentration (MIC) (µg/mL) |
|
F1 (Carbopol 940) |
E. coli |
18 |
50 |
|
S. aureus |
20 |
40 |
|
|
F2 (Carbopol 934) |
E. coli |
16 |
60 |
|
S. aureus |
18 |
50 |
|
|
F3 (HPMC) |
E. coli |
15 |
70 |
|
S. aureus |
17 |
60 |
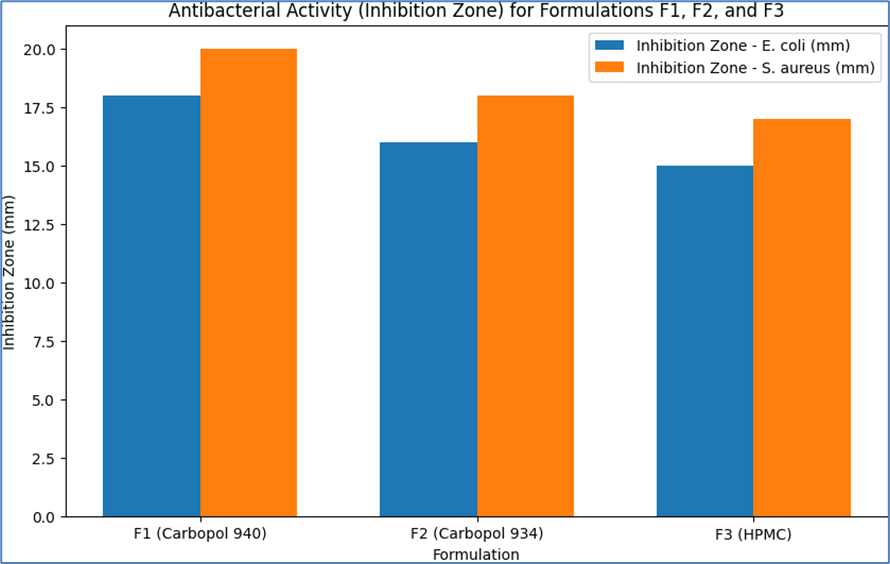
These results indicate that all formulations possess antibacterial properties, with Formulation F1 showing the highest efficacy. The variation in antibacterial activity among the formulations can be attributed to differences in the composition and properties of the polymers used, which may affect the release and availability of the APIs. The results suggest that the formulated emulgels have potential for use in antibacterial skin therapy, particularly against common pathogens such as E. coli and S. aureus.

DISCUSSION
The comprehensive analysis of the formulated emulgels (F1, F2, and F3) encompassed various critical parameters, including ?max determination, calibration curve, pH, viscosity, spreadability, extrudability, in vitro drug release, particle size, zeta potential, and antibacterial activity. The results from these analyses provide valuable insights into the characteristics and potential efficacy of the emulgels.
?max Determination and Calibration Curve: The ?max for Neomycin and Nicotinamide was determined using UV spectroscopy, essential for accurate quantitative analysis. Neomycin exhibited a ?max at 270 nm, while Nicotinamide showed its ?max at 262 nm. These values were crucial for constructing the calibration curves, which demonstrated a linear relationship between absorbance and concentration, indicating the reliability of the method for quantitative analysis in the formulation process.
pH Measurement: The pH values of all formulations were within the range suitable for topical application (5.5 to 6.5), ensuring compatibility with skin and stability of the APIs. The consistency in pH values across trials for each formulation demonstrated the reproducibility of the formulation process.
Viscosity and Spreadability: Viscosity measurements indicated that F1 had the highest viscosity, followed by F2 and F3. The higher viscosity of F1 can be attributed to the properties of Carbopol 940. Spreadability results correlated with viscosity findings, where F3 showed the highest spreadability, suggesting ease of application due to the lower viscosity of the HPMC-based formulation.
Extrudability: All formulations exhibited good extrudability, with F3 showing the highest ease of extrusion. This parameter is crucial for user convenience and ensures consistent dosing.
In Vitro Drug Release: The in vitro drug release profiles indicated a controlled release of both Neomycin and Nicotinamide over a 12-hour period. F3 showed a slightly faster release rate, which could be due to the lower viscosity and different gel matrix structure of HPMC.
Particle Size and Zeta Potential: Particle size analysis revealed that F1 had the smallest mean particle size, suggesting a fine and uniform dispersion. The zeta potential measurements for all formulations indicated good stability of the emulsion due to sufficient surface charge to prevent aggregation.
Antibacterial Activity: The antibacterial activity results showed that all formulations possessed antibacterial properties, with F1 exhibiting the highest efficacy against both E. coli and S. aureus. This suggests the potential of these emulgels in antibacterial skin therapy. In conclusion, the formulated emulgels demonstrated promising characteristics in terms of physical properties, drug release, and antibacterial activity. The variations observed among the formulations can be attributed to the different properties of the polymers used, which influence the overall performance of the emulgel. The results suggest that these emulgels have potential applications in delivering therapeutic agents effectively for skin conditions, particularly in treating bacterial infections. Further studies, including clinical trials, would be beneficial to fully establish the efficacy and safety of these formulations in real-world scenarios.
CONCLUSION
The comprehensive study of the formulated emulgels (F1, F2, and F3) incorporating Neomycin and Nicotinamide has provided valuable insights into their potential as effective topical therapeutic agents. The key findings from this research can be summarized as follows:
In conclusion, the formulated emulgels exhibit promising characteristics for topical drug delivery, combining effective drug release with desirable physical properties and significant antibacterial activity. These findings suggest that such emulgels could be valuable in treating skin conditions where both moisturizing effects and antibacterial action are desired. Further research, including clinical evaluations, is recommended to fully establish the therapeutic potential and safety of these formulations in practical medical applications.
Summary Of the Experiment
The experiment focused on the development and evaluation of emulgel formulations containing Neomycin and Nicotinamide, aimed at providing effective antibacterial skin therapy. The study encompassed several critical stages, from formulation development to comprehensive characterization, culminating in the assessment of antibacterial efficacy. Key aspects of the experiment are summarized as follows:
In summary, this experiment successfully developed and characterized emulgel formulations with potential therapeutic applications in treating bacterial skin infections. The formulations exhibited favorable physical properties, sustained drug release, and significant antibacterial activity, highlighting their potential as effective topical agents in skin therapy. The study provides a foundation for further research and development in the field of topical drug delivery systems.
REFERENCES


Govind Patidar*, Praveen Khirwadkar, Tanu Bhargav, Incorporation of Neomycin-Nicotinamide Microemulsion in Emulgel for Enhanced Antibacterial Skin Therapy, Int. J. of Pharm. Sci., 2025, Vol 3, Issue 2, 1145-1168. https://doi.org/10.5281/zenodo.14874104
 10.5281/zenodo.14874104
