Mount Zion College of Pharmaceutical Sciences and Research, Adoor, Kerala, India, 691556
A simple, accurate, precise, and cost-effective multivariate UV spectrophotometric method was developed and validated for the quantitative estimation of Topiroxostat in bulk drug and pharmaceutical tablet dosage form. The method is based on multivariate calibration using absorbance measurements at five selected wavelengths (271, 273, 275, 277, and 279 nm) using methanol as the solvent. Calibration curves were linear in the concentration range of 5–25 µg/mL with good correlation coefficients (R² > 0.99) at all selected wavelengths. The developed method was validated as per ICH Q2(R1) guidelines for parameters including linearity, accuracy, precision, sensitivity, and robustness. The accuracy of the method was confirmed by recovery studies at different concentration levels, showing satisfactory percentage recovery. Precision studies demonstrated low %RSD values, indicating good repeatability and reproducibility. The assay of the marketed formulation showed results within acceptable limits, confirming the suitability of the method for routine quality control analysis. The proposed multivariate UV spectrophotometric method is reliable, economical, and suitable for regular analysis of Topiroxostat in pharmaceutical dosage forms.
Multivariate calibration is a chemometric approach that establishes a mathematical relationship between spectral absorbance data collected at multiple wavelengths and specific sample properties, such as concentration, content, or identity. The method employs a calibration set of reference samples with known characteristics to construct predictive models, with Partial Least Squares (PLS) regression being among the most widely applied techniques. Using digitized UV–visible spectra, these models enable accurate estimation of properties in unknown samples. By transforming a single dependent response into multiple wavelength-dependent variables, multivariate calibration enhances analytical resolution, sensitivity, and efficiency, making it a powerful and cost-effective tool for routine quality control and quantitative analysis of pharmaceutical and chemical products. The following formula can be expressed for each of the five wavelengths at which the absorption of the analyte (X) is measured.
Aλ1 = aXCx +k1 ---------------------(1)
Aλ2 = bXCx +k2 --------------------(2)
Aλ3 = cXCx+k3 ---------------------(3)
Aλ4 = dXCx+k4 ---------------------(4)
Aλ5 = eXCx+ k5 ---------------------(5)
Where, Aλ represents the absorbance of the analyte; a, b, c, d, and e are the slopes of the linear regression functions of the analyte; k1, k2, k3, k4, and k5 are the intercepts of the linear regression functions at the five selected bandwidth and Cx represents the concentration of the analyte. The above five equation systems (1-5) can be summarized as follows:
AT = axCx +bxCx +cxCx +dxCx +exCx +KT ----------------------(6)
Which can be further simplified to,
AT = Cx (a+b+c+d+e) +KT
Cx=AT-kTa+b+c+d+?
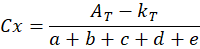
Where, AT and KT represent the sum of the absorbance obtained and the sum of intercepts of regression equations at five wavelengths set, respectively. The concentration of the analyte X in a solution can be calculated using the equation.2Topiroxostat is a particular xanthine oxidase inhibitor, and the chemical name is 4-[5-(4-Pyridinyl)-1H-1,2,4-triazol-3-yl]-2-pyridinecarbonitrile. It is used to treat and control hyperuricemia and gout. Hyperuricemia is a metabolic disorder; it has occurred mainly due to the elevated level of uric acid in the blood.
Topiroxostat Inhibiting xanthine oxidase and it specifically stops hypoxanthine from converting to xanthine and, eventually, uric acid. Topiroxostat effectively reduces uric acid production by blocking this enzyme, lowering blood levels and reducing the risk of urate crystal formation and gout attacks.4

Fig no: 1 Structure of Topiroxostat
Method validation:
The process of proving that analytical techniques are appropriate for their intended purpose is known as analytical method validation. For daily tasks in the quality assurance setting, the approach should be robust, dependable, accurate, precise, transportable, and validatable. Validation tests must be carried out using certified and calibrated instruments and equipment, and they must be appropriately recorded. There are several kinds of validation qualities, including: Precision, Accuracy, Specificity, Range, Linearity, Limit of detection and Quantitation limit.3
MATERIALS AND METHODS
Absorption measurements were performed using a Cary 5000 UV–Vis–NIR spectrophotometer, operating with a double-beam photometric system and equipped with deuterium and tungsten halogen lamps, covering a wavelength range of 175–3300 nm. All weighings were carried out using an analytical balance.5
Topiroxostat reference standard was procured from Yarrow Chem Products (Mumbai, India), while the marketed tablet formulation (Topiroxo, 20 mg) was obtained from a local market. Methanol, sourced from V Associates (Kottayam, India), was selected as the solvent based on its favorable solubility characteristics. A standard stock solution (1 mg/ml) was prepared in methanol and further diluted to obtain working solutions in the range of 5–25 µg/ml.6
The absorption maximum (λmax) was determined using a 10 µg/ml solution, and UV spectra were recorded at 275 nm to enhance correlation and minimize instrumental variations.7,8
For analysis of the marketed formulation, powdered tablets equivalent to 0.01 mg of topiroxostat were dissolved in methanol, sonicated for 20 min, filtered through Whatman grade 42 filter paper, and suitably diluted for absorbance measurement.9
Method validation
The proposed analytical method was validated in accordance with ICH Q2(R1) guidelines.10 Linearity was established over a concentration range of 5–25 µg/ml by measuring absorbance at selected wavelengths around the λmax (275 nm), specifically 271, 273, 275, 277, and 279 nm, to improve correlation and minimize instrumental variations.11 Method sensitivity was evaluated by determining the limit of detection (LOD) and limit of quantification (LOQ) using calibration curve data and standard deviation, calculated as LOD = 3.3σ/S and LOQ = 10σ/S, where σ represents the standard deviation of the lowest concentration and S is the slope of the calibration curve.12 Precision was assessed through interday and intraday studies using a 10 µg/ml solution scanned at the five selected wavelengths, with results expressed as mean, standard deviation, and %RSD. Accuracy was determined by recovery studies employing the standard addition method at 20%, 40%, and 80% levels, and percentage recovery was calculated from measured absorbance values.13,14
Assay
Ten tablets of topiroxostat were accurately weighed, and the average weight was calculated. The tablets were finely powdered, and a quantity equivalent to 0.1 g of topiroxostat was transferred to a glass-stoppered flask, dissolved in 10 ml of methanol, and further diluted to 100 ml with the same solvent. An aliquot of 6 ml of this solution was subsequently diluted to volume with methanol to obtain a final concentration of 6 µg/ml. The absorbance of the prepared tablet solution was measured at 271, 273, 275, 277, and 279 nm, and the drug content in the formulation was calculated from the corresponding absorbance values.15
RESULT AND DISCUSIION
Topiroxostat's λmax was determined to be 275 nm using methanol as a solvent, as illustrated in the figure. No. 2. Within the designated concentration range of 5–10 µg/mL, the method is linear. With R2 = 0.9907–0.9953 for calibration plots, the analysis of linear regression data demonstrates a strong linear relationship. It was discovered that the recovery percentage fell within the recommended range. As a result, the values discovered fulfilled the acceptance criteria in accordance with the ICH standard limitations of validation parameters.
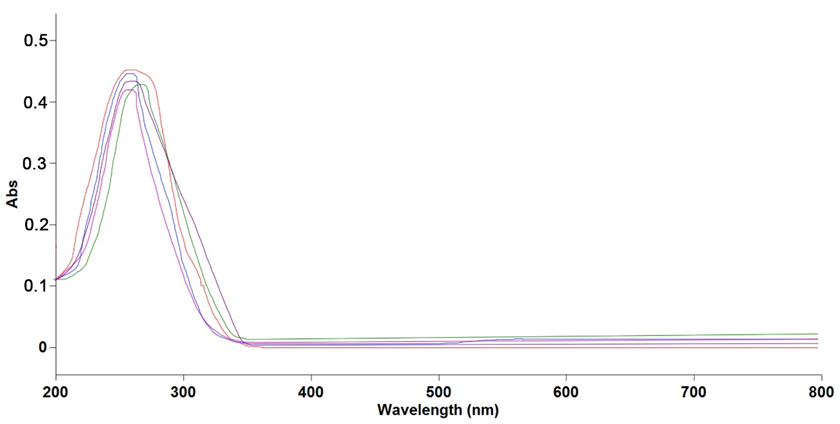
The method demonstrated good linearity over the concentration range of 5–25 µg/ml when evaluated at 271, 273, 275, 277, and 279 nm, as evidenced by the calibration curves (Figures 3–7). Low %RSD values at each wavelength indicated satisfactory accuracy and precision. The limits of detection (LOD) ranged from 2.243 to 2.562 µg/ml, while the limits of quantification (LOQ) were within 6.75–12.43 µg/ml (Table 2). Intra- and interday precision studies showed minimal variations in absorbance with low standard deviation and %RSD values, confirming that the proposed method is precise, reliable, and reproducible. The accuracy was measured using the usual addition method. Recovery trials at 40%, 60%, and 80% ranges verified the method's accuracy, demonstrating a recovery percentage in between of 97.22–99.50% along with low %CV values demonstrating the method's accuracy and lack of interference.
Assay: Assay The amount of the drug in a sample solution was determined by measuring the tablet formulation's UV absorbance at 275 nm. The quantity determined in the preparation was 14.27 mg, the assay percentage of topiroxostst was 86.6%w/w, and the percentage RSD value was found to be less than 2%.49,50 Table No. 6 contains the tabulation of the assay findings.
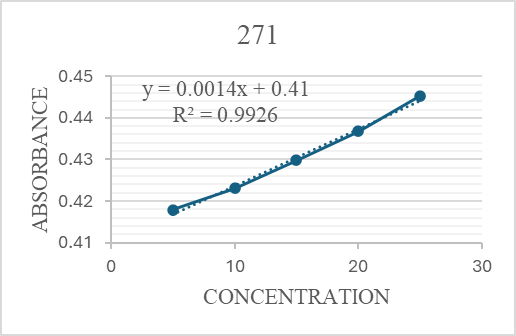
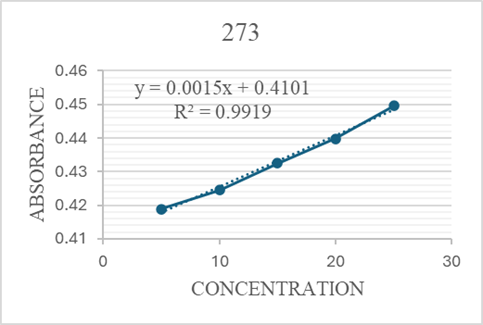
Fig No: 3 Calibration at 271nm Fig No: 4 Calibration at 273nm
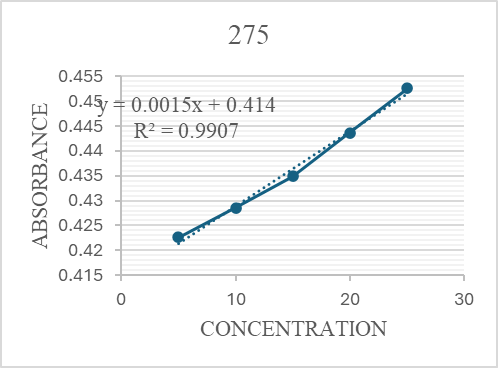
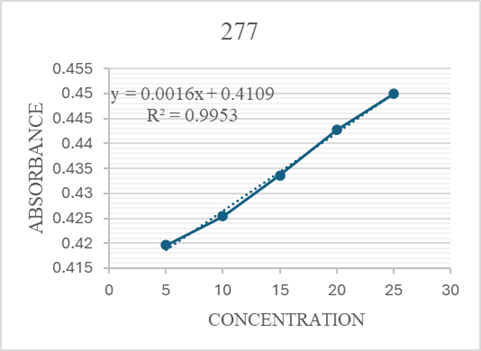
Fig No: 5 Calibration at 275nm Fig No: 6 Calibration at 277nm
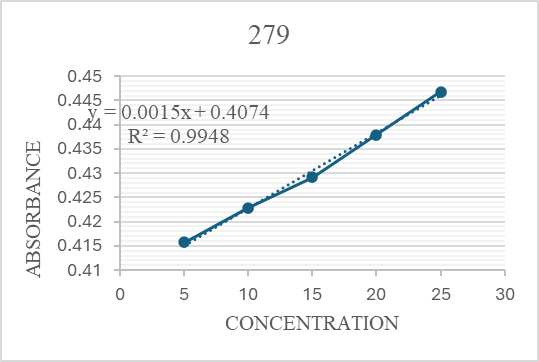
Fig No: 7 Calibration at 279nm
Table 1: UV Calibration data at five distinct wavelengths
|
Concentration (µg/mL) |
Absorbance |
||||
|
271 nm |
273 nm |
275 nm |
277 nm |
279 nm |
|
|
5 |
0.4179 |
0.4189 |
0.4226 |
0.4196 |
0.4158 |
|
10 |
0.4231 |
0.4245 |
0.4286 |
0.4254 |
0.4229 |
|
15 |
0.4298 |
0.4325 |
0.4349 |
0.4336 |
0.4292 |
|
20 |
0.4368 |
0.4398 |
0.4436 |
0.4427 |
0.4379 |
|
25 |
0.4453 |
0.4496 |
0.4526 |
0.4499 |
0.4468 |
Table 2: Regression characteristics
|
SL NO |
Wavelength (nm) |
Regression Equation |
Slope |
Intercept |
R2 |
LOD (µg/mL) |
LOQ (µg/mL) |
|
1 |
271 |
y = 0.0014x+0.41 |
0.0014 |
0.41 |
0.9926 |
2.5 |
13.3 |
|
2 |
273 |
y = 0.0015x+0.4101 |
0.0015 |
0.4101 |
0.9919 |
2.4 |
12.4 |
|
3 |
275 |
y = 0.0015x+0.414 |
0.0015 |
0.414 |
0.9907 |
2.5 |
12.4 |
|
4 |
277 |
y =0.0016x+0.4109 |
0.0016 |
0.4109 |
0.9953 |
2.2 |
6.7 |
|
5 |
279 |
y =0.0015x+0.4074 |
0.0015 |
0.4074 |
0.9948 |
2.5 |
12.4 |
*nm= nanometre; µg/ mL = microgram per millilitre
Table 3: Interday and Intraday precision for Topiroxostat
|
Interday precision |
Absorbance |
%LC ± % RSD |
||
|
10:00 am |
12:00 pm |
2:00 pm |
||
|
271 nm |
6.1431 |
6.1446 |
6.1458 |
97.130±0.0021 |
|
273 nm |
6.1449 |
6.1531 |
6.1592 |
97.255±0.0022 |
|
275 nm |
6.2214 |
6.2269 |
6.2761 |
98.663±0.0010 |
|
277 nm |
6.1647 |
6.1663 |
6.1675 |
97.473±0.0011 |
|
279 nm |
6.1574 |
6.1589 |
6.1623 |
97.368±0.0020 |
|
Intraday precision |
Day 1 |
Day 2 |
Day 3 |
|
|
271 nm |
6.1356 |
6.1364 |
6.1384 |
97.009±0.0021 |
|
273 nm |
6.1481 |
6.1563 |
6.1584 |
97.285±0.0024 |
|
275 nm |
6.2342 |
6.2243 |
6.2561 |
98.612±0.0011 |
|
277 nm |
6.1636 |
6.1658 |
6.1643 |
97.448±0.0014 |
|
279 nm |
6.1571 |
6.1588 |
6.1591 |
97.349±0.0022 |
Table 4: Repeatability
|
Wavelength (nm) |
Absorbance |
Amount ± %RSD |
% LC ± CV |
||||
|
271 |
5.7584 |
5.7584 |
5.7584 |
5.7585 |
5.7585 |
13.654±0.2011 |
91.028±0.0020 |
|
273 |
5.9941 |
5.9941 |
5.9941 |
6.0052 |
6.0052 |
14.223±0.2142 |
94.823±0.0021 |
|
275 |
6.1282 |
6.1282 |
6.2131 |
6.2131 |
6.2131 |
14.651±0.1045 |
97.678±0.0010 |
|
277 |
5.9984 |
5.9984 |
5.9984 |
6.1235 |
6.1235 |
14.341±0.1128 |
95.612±0.0011 |
|
279 |
5.8463 |
5.8463 |
5.8463 |
5.9236 |
5.9236 |
13.935±0.2241 |
92.905±0.0022 |
Table 5: Recovery Studies
|
Level of recovery % |
Amount (µg/ml) |
Amount added (µg) |
Absorbance |
Amount Recovered ± RSD |
% LC ±CV |
|
40 |
15 |
6 |
0.4128 |
14.51±0.2154 |
97.220±0.0021 |
|
0.4168 |
14.71±0.2214 |
98.092±0.0022 |
|||
|
0.4169 |
14.72±0.2268 |
98.186±0.0022 |
|||
|
60 |
15 |
9 |
0.4172 |
14.73±0.2176 |
98.257±0.0021 |
|
0.4178 |
14.75±0.1132 |
98.398±0.0011 |
|||
|
0.4185 |
14.78±0.1805 |
98.56±0.0018 |
|||
|
80 |
15 |
12 |
0.4192 |
14.80±0.2354 |
98.72±0.0023 |
|
0.4198 |
14.83±0.2398 |
98.86±0.0023 |
|||
|
0.4225 |
14.93±0.1090 |
99.50±0.0010 |
Table 6: Assay of Topiroxostat
|
Drug |
AT |
KT |
a+b+c+d+e |
Cx |
Amount in tablets |
%LC |
|
Topiroxostat |
2.1823 |
2.0524 |
0.0075 |
17.32 |
20 mg |
86.6 |
CONCLUSION
A multivariate UV spectrophotometric method was successfully developed and validated for the estimation of topiroxostat in bulk and tablet dosage forms. The method utilizes absorbance measurements at five wavelengths around the λmax (275 nm), reducing instrumental and experimental variability and enhancing analytical accuracy. It exhibited linearity over the range of 5–25 µg/ml with high correlation coefficients and complied with Beer–Lambert’s law. Validation studies, performed according to ICH guidelines, confirmed that the method is precise, accurate, sensitive, and reproducible. Recovery and precision studies supported its reliability, and assay results of marketed tablets were within acceptable limits. The method is simple, rapid, cost-effective, and suitable for routine quality control of topiroxostat in pharmaceutical analysis.
REFERENCES


Jisha M S, Ayshath A, Ciril J Varghese, Jesna Nizam, Jishana N, Ramsy S, Multivariate UV Optimization of Topiroxostat in Pharmaceutical Dosage Form, Int. J. of Pharm. Sci., 2026, Vol 4, Issue 2, 2411-2418. https://doi.org/10.5281/zenodo.18663843
 10.5281/zenodo.18663843
