*1Navinta LLC, 1499 Lower Ferry Road, Ewing, New Jersey, USA-08618.
2Krishna School of Pharmacy and research, KPGU, Vadodara.
3Indukaka Ipcowala College of Pharmacy, The CVM University.
4Indukaka Ipcowala College of Pharmacy, The CVM University.
A simple, specific and stability indicating reversed phase high performance liquid chromatographic method was developed for the quantitative determination Cilnidipine (CIL) and Telmisartan (TEL) in tablet dosage form. A SunFire C18, 5?m column having 250?4.6 mm in isocratic mode, with mobile phase containing acetonitrile: methanol: 0.02 M potassium dihydrogen orthophosphate buffer (10:70:20, v/v/v, pH 3 adjusted with 1 % O-phosphoric acid) was used. The flow rate was 1.0 mL min-1 and effluents were monitored at 254 nm. The retention time of CIL and TEL were 7.2 and 3.1 min respectively. The linearity for CIL and TEL were in the range of 0.5 -10 µg/ ml and 2-40 µg/ml respectively. The recoveries obtained for CIL and TEL were 98.4–104.5% and 100.3- 101.8 respectively. CIL and TEL stock solutions were subjected to acid and alkali hydrolysis, peroxide oxidation, UV light degradation. The degraded product peaks were well resolved from the pure drug peak with significant difference in their retention time values. Stressed samples were assayed using developed LC method. The proposed method was validated with respect to linearity, accuracy, precision and robustness. The method was successfully applied to the estimation of CIL and TEL in tablet dosage forms.
Cilnidipine (CIL) is a light yellowish powder. Chemically it is 1,4-dihydro-2,6-dimethyl-4-(3-nitrophenyl)-3,5-pyridinedicarboxylic acid2-methoxyethyl(2E)-3phenyl-2-prpenyl ester [1] (Fig.1.A). It is antihypertensive agent and calcium channel blocker. Cilnidipine is a dual L-/N-type calcium channel protein inhibitor and blocker. Cilnidipine has displayed renal and vascular protective effects and improved baroreflex sensitivity in patients with hypertension. Telmisartan (TEL) is white crystalline powder. Chemically, it is 4′-[[4-Methyl-6-(1-methyl-1H-benzimidazol-2-yl)-2-propyl-1H-benzimidazol-1-yl]methyl]biphenyl-2-carboxylic acid [1,2] (Fig. 1: B). It is very soluble in methanol and practically insoluble in water. It is Angiotensin-converting Enzyme Inhibitors and Angiotensin II Type 1 Receptor Blockers agents. The mechanism by which Telmisartan is an angiotensin II receptor blocker (ARB) that shows high affinity for the angiotensin II receptor type 1 (AT1), with a binding affinity 3000 times greater for AT1 than AT2. It has the longest half-life of any ARB (24 hours) and the largest volume of distribution [1]. The combination of CIL and TEL is indicated as antihypertensive agents.[3]
Literature survey revealed that Cilnidipine can be estimated by spectrophotometry [4-6] and by liquid chromatographic methods [7-9] individually or in combination with other drugs, and Telmisartan can be estimated by spectrophotometry [10-14] and by liquid chromatographic methods individually or in combination with other drugs [15-17]. Two methods UV spectroscopy[18] , RP-HPLC [19] have been reported for the estimation of Cilnidipine and Telmisartan in their combined dosage form. The reported methods are highly sophisticated, costly, time-consuming and require special sample preparation. But not single stability indicating RP-HPLC method is reported till date upt our knowledge.
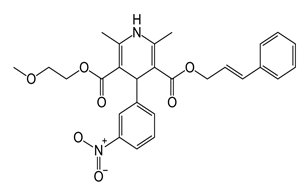
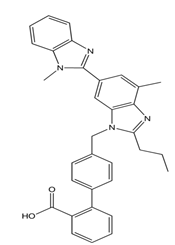
Figure 1: (A) Structure of Cilnidipine (B) Structure of Telmisartan
EXPERIMENTAL
Apparatus
The liquid chromatographic system of waters (Calcutta, India) containing 515 HPLC isocratic pump, variable wavelength programmable 2998 photodiode array detector and rheodyne injector with 20 ml fixed loop was used. A SunFire C18 column with 250×4.6 mm i.d. and 5 mm particle size was used as stationary phase.
Reagents and materials
Analytically pure CIL and TEL were procured as gratis sample from J.B Chemicals and Pharmaceutical Pvt. Ltd., (Bombay, India) .ACN, Methanol, water (E. Merck, Mumbai, India) was of LC grade, while potassium dihydrogen phosphate and ortho-phosphoric acid (S.D. fine chemicals, Mumbai, India) were of analytical grade and used for the preparation of mobile phase. Tablet formulation (Cilacar T (10 mg CIL and 40mg TEL), J.B Chemicals and Pharmaceutical Pvt. Ltd., (Bombay, India) containing labeled amount of 10 mg of Cilnidipine and 40mg of Telmisartan was purchased from local market.
Preparation of mobile phase and stock solution
Mobile phase was prepared by mixing 10 ml of Acetonitrile, 70 ml of Methanol and 20 ml of 0.02 M KH2PO4 pH=3. Solution was filtered through Whatman filter paper No. 41 and sonicate for 10 min and this solution was used as a mobile phase.
CIL (10 mg) and TEL (10 mg) were accurately weighed and transferred to two separate 10 ml volumetric flask and dissolved in few ml of methanol. Volumes were made up to the mark with methanol to yield a solution containing 1000 μg/ml of CIL and 1000 μg/ml of TEL, respectively. Appropriate aliquots from above solution were taken and diluted with mobile phase to obtain 100 μg/ml of CIL and 100 μg/ml of TEL, respectively.
Chromatographic conditions
A Sunfire C-18 (250 x 4.6 mm id) chromatographic column equilibrated with mobile phase Acetonitrile: Methanol : 0.02 M KH2PO4 (10:70: 20 % v/v/v) at pH 3 was used. Mobile phase flow rate was maintained at 1 ml/min and effluents were monitored at 254 nm. The sample was injected using a 10 µL fixed loop, and the total run time was 15 min
Calibration curves for CIL and TEL
Appropriate aliquot of stock solution of CIL and TEL was taken in same 10 ml volumetric flasks. The volume was made up to the mark with mobile phase to obtain final concentration of 0.5, 2, 4, 6, 8, 10 μg/ml of CIL and 2, 8, 16, 24, 32, 40, μg/ml of TEL respectively.
Analysis of Marketed Formulations
Twenty tablets were weighed accurately and finely powdered. Tablet powder equivalent to 10 mg CIL and 40 mg of TEL was taken in 100 ml volumetric flask. 50 ml of methanol was added to the above flask and the flask was sonicated for 15 minutes. The solution was filtered using Whatman filter paper No.41 and volume was made up to the mark with the mobile phase. Appropriate volume of the aliquot from Stock of both the solutions was transferred to a 10 ml volumetric flask and the volume was made up to the mark with the mobile phase to obtain a solution containing 10 µg/ml of CIL and 40 µg/ml of TEL. The solution was sonicated for 10 min.It was injected as per the above chromatographic conditions and peak area of CIL and TEL were recorded. The quantifications were carried out by keeping these values to the straight line equation of calibration curve.
Validation
The method was validated for accuracy, precision, specificity, detection limit, quantitation limit and robustness.
Accuracy
The accuracy of the method was determined by calculating recoveries of CIL and TEL by method of standard additions. Known amount of CIL (0%, 50%, 100%, 150%) and TEL (0%, 50%, 100%, 150% respectively) were added to a pre quantified sample solution, and the amount of CIL and TEL were estimated by measuring the peak areas and by fitting these values to the straight-line equation of calibration curve.
Precision
The intra-day and inter-day precision studies (intermediate precision) were carried out by estimating the corresponding responses 3 times on the same day and on 3 different days for three different concentrations of CIL (2, 6, 10 mg/ml) and TEL (8, 24, 40 mg/ml), and the results are reported in terms of relative standard deviation.
Specificity
The specificity was estimated by spiking commonly used excipients (starch, talc and magnesium stearate) into a pre weighed quantity of drug. The chromatogram was taken by appropriate dilutions and the quantities of drugs were determined.
Limit of detection and quantification
The detection limit is defined as the lowest concentration of an analyte that can reliably be differentiated from background levels. Limit of quantification of an individual analytical procedure is the lowest amount of analyte that can be quantitatively determined with suitable precision and accuracy. LOD and LOQ were calculated using following equation as per ICH guidelines. LOD = 3.3 ×σ /S and LOQ = 10 ×σ /S, where s is the standard deviation of y-intercepts of regression lines and S is the slope of the calibration curve.
Robustness
Robustness of the method was studied by deliberately changing the experimental conditions like mobile phase ratio and flow rate. Robustness of the method was determined in triplicate at a concentration level of 10 μg /ml for both CIL and TEL respectively. The mean and % RSD of peak areas were calculated.
Forced degradation study
Stress degradation study using acid and alkali hydrolysis, chemical oxidation, exposure to sun light and dry heat degradation was carried out and interference of the degradation products was investigated. CNZ and DMH was weighed (10 mg) and transferred to 10 ml volumetric flasks and expose to different stress conditions.
(a) Alkali hydrolysis
Powder equivalent to 10 mg CIL and 40 mg TEL was weighed accurately and transferred into 10 ml volumetric flask and dissolve in methanol by soncation.The solution was subjected to 2 ml of 0.5N NaOH for time period of 1 hours at room temperature. After exposure to the degradation condition 0.5N HCl dropwise was added till pH was neutralized to pH 7.Make the volume up to mark with methanol and mix. Filter the solution with Whatman filter no. 41.The above solution was appropriately diluted with methanol to obtain the solution 100 µg/ml of CIL and 400 µg/ml of TEL. From this solution 0.2 ml was pipetted out in 10 ml volumetric flask and diluted with mobile phase to give solution of 2 µg/ml of CIL and 8 µg/ml TEL. The solution was analysed by the proposed method & chromatogram was recorded.
(b) Acid hydrolysis
Powder equivalent to 10 mg CIL and 40 mg TEL was weighed accurately and transferred into 10 ml volumetric flask and dissolve in methanol by sonication. The solution was subjected to 2 ml of 0.5N HCl for time period of 1 hours at room temperature. After exposure to the degradation condition 0.5N NaOH drop wise was added till pH was neutralized to pH 7.Make the volume up to mark with methanol and mix. Filter the solution with Whatman filter no. 41.The above solution was appropriately diluted with methanol to obtain the solution 100 µg/ml of CIL and 400 µg/ml of TEL. From this solution 0.2 ml was pipetted out in 10 ml volumetric flask and diluted with mobile phase to give solution of 2 µg/ml of CIL and 8 µg/ml TEL. The solution was analyzed by the proposed method & chromatogram was recorded.
(c) Oxidative stress degradation
From powdered tablet, equivalent to 10 mg CIL and 40 mg TEL was weighed accurately and transferred into 10 ml volumetric flask and dissolve in methanol by sonication. The solutions were subjected to 12%Hydrogen peroxide for time period of 1hour at room temperature. After exposure to the degradation condition solution was cooled and 2 ml of methanol and sonicate the solution for about 10 minutes with occasional shaking. Make the volume up to mark with methanol and mix. Filter the solution with Whatman filter no. 41. The above solution was appropriately diluted with methanol to obtain the solution 100 µg/ml of CIL and 400 µg/ml of TEL.From this solution 0.2 ml was pipetted out in 10 ml volumetric flask and diluted with mobile phase to give solution of 2 µg/ml of CIL and 8 µg/ml TEL. The solution was analysed by the proposed method & chromatogram was recorded.
e) To study photolytic (UV) degradation
From powderedtablet, equivalent to 10 mg CIL and 40 mg TEL was weighed accurately and transferred into 10 ml volumetric flask and dissolve in methanol by sonication. Expose itin UV light for 24 hours.Add 2 ml of methanol to it, and sonicate the solution for about 20 minutes with occasional shaking. Make the volume up to mark with methanol and mix. Filter the solution with Whatman filter no. 41. The above solution was appropriately diluted with methanol to obtain the solution 100 µg/ml of CIL and 400 µg/ml of TEL. From this solution 0.2 ml was pipetted out in 10 ml volumetric flask and diluted with mobile phase to give solution of 2 µg/ml of CIL and 8 µg/ml TEL. The solution was analysed by the proposed method & chromatogram was recorded.
All the reaction solutions were injected in the liquid chromatographic system and chromatograms were recorded.
Dissolution study of tablet formulation
Six tablets were taken and dissolution study was performed using USP apparatus II (Paddle apparatus). The dissolution media used was 0.1 N HCl as per the IP 2010 and dissolution database. Six tablets were kept into paddle apparatus containing 900 ml of 0.1 N HCl. Samples for dissolution study were pipette out at time interval of 0, 10, 20, 30, 40, 50, 60, min. The samples were appropriately diluted with mobile phase and injected as per above chromatographic conditions. The area and percentage drug release was calculated by RP-HPLC.
RESULTS AND DISCUSSION
Optimization of mobile phase
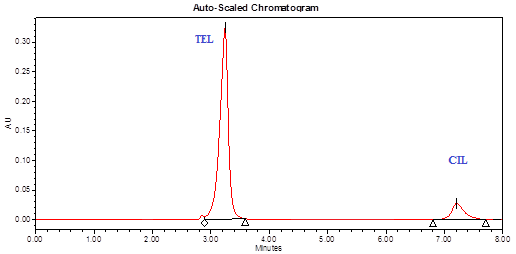
The objective of the method development was to resolve chromatographic peaks for active drug ingredients. Various mixtures containing methanol and water were tried as mobile phases in the initial stage of method development. Mixture of methanol: water (60:40, v/v), methanol: water (75:25 v/v), methanol: water (80:20), ACN:buffer (80:20, v/v) were tried as mobile phase but satisfactory resolution of drug and peaks were not achieved (Figure 5.2-5.5).The mobile phase ACN: methanol: 0.02M potassium dihydrogen phosphate buffer (10:70:20 % v/v/v) with orthophosphoric acid (0.1 ml 1%) added as a peak modifier was found to be satisfactory and gave two symmetric and well-resolved peaks for CIL and TEL (Table 5.2) (Figure 5.6-5.8). The retention time for CIL and TEL were 7.2 min and 3.1 min, respectively. The resolution between CIL and TEL was found to be 5.5, which indicates good separation of both the compounds. The asymmetric factors for CIL and TEL were 1.13 and 1.32, respectively. The mobile phase flow rate was maintained at 1 ml min-1.
(A)
(B)
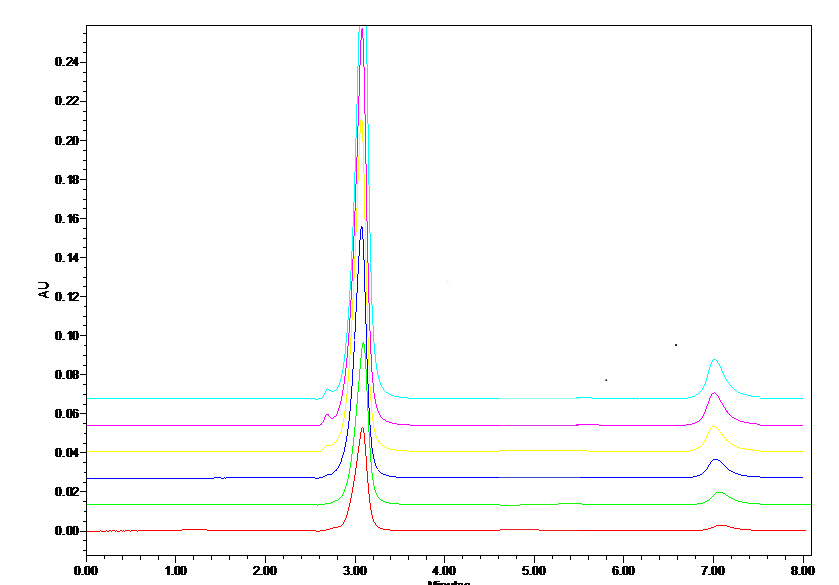
Fig.2. (A) Liquid chromatogram of CIL AND TEL (RT 7.2 AND 3.1 MIN) (B) Overlay chromatograms of CIL and TEL
Validation of the Proposed Methods
Linearity
The calibration curve for CIL was found to be linear in the range of 0.5-10 µg/ml with a correlation coefficient of 0.996. The calibration curve for TEL was found to be linear in the range of 2-40 µg/ml with a correlation coefficient of 0.998. The regression analysis of calibration curves are reported.
Precision
Instrument precision was determined by performing injection repeatability test and the. RSD values for CIL and TEL were found to be 0.58 and 0.52 respectively. The intra-day and inter-day precision studies were carried out and the results are reported.
Accuracy
The accuracy of the method was determined by calculating recoveries of CIL and TEL by method of standard addition. The recoveries found to be 101.1-104.3% and 98.2% - 102.3 % for CIL and TEL respectively. The high values indicate that the method is accurate.
TAB.1. Accuracy study for Cilnidipine and Telmisartan for proposed LC method
|
Amount of sample taken (mg/ml) |
Amount of standard drug added (mg/ml) |
Amount of drug recovered (mg/ml) |
% recovery ± RSD (n = 3) |
||||
|
CIL |
TEL |
CIL |
TEL |
CIL |
TEL |
CIL |
TEL |
|
2 |
8 |
0.0 |
0.0 |
2.04 |
8.18 |
101.1 ± 1.67 |
102.3 ± 1.45 |
|
2 |
8 |
1 |
4 |
3.07 |
11.7 |
104.38 ±1.39 |
98.2 ± 1.74 |
|
2 |
8 |
2 |
8 |
4.04 |
16.1 |
103.92 ±0.82 |
102.06 ± 1.14 |
|
2 |
8 |
3 |
12 |
5.03 |
19.8 |
101.92 ±0.97 |
98.3 ± 1.51 |
Limit of detection and limit of quantification
The detection limits for CIL and TEL were found to be 0.0012 µg/ml and 0.00032 µg/ml respectively, while quantitation limits were found to be 0.0035 µg/ml and 0.00097 µg/ml, respectively. The above data shows that a microgram quantity of both the drugs can be accurately and precisely determined.
Specificity
The specificity study was carried out to check the interference from the excipients used like starch, magnesium stearate and talc in the formulations by preparing synthetic mixture containing both the drugs and excipients. The chromatogram showed peaks for both the drugs without any interfering peak and the recoveries of both the drugs were above 98% (Figure 5.9-5.10). The peak was pure as peak angle was less than peak threshold
Forced degradation study
Chromatogram of base hydrolysis performed at room temperature for 1 hr showed degradation of CIL with 1 degradation product peak at retention time (RT) 10.9 and showed degradation of TEL with 2 degradation peak at retension time 5.07 min and 5.73 min (Figure 3).
Chromatogram of acid hydrolysis performed at room temperature for 1 hr showed degradation of CIL with 1 degradation product peak at retention time (RT) 9.7 and showed degradation of TEL with 2 degradation peak at retension time 2.07 min and 5.35 min (Figure 4). The chromatogram of oxidized CIL and TEL with 12% hydrogen peroxide at room temperature for 1 hour drug was found to be degradation of TEL with 1 degradation product peak at retention time (RT) 5.3 min and showed degradation of CIL with 2 degradation peak at retension time 11.5 min and 11.7 min. Chromatogram of uv light exposed performed under uv chamber for 24 hr showed degradation of CIL with 1 degradation product peak at retention time (RT) 11.1 and showed degradation of TEL with 2 degradation peak at retension time 2.08 min and 3.8 min (Figure 3).
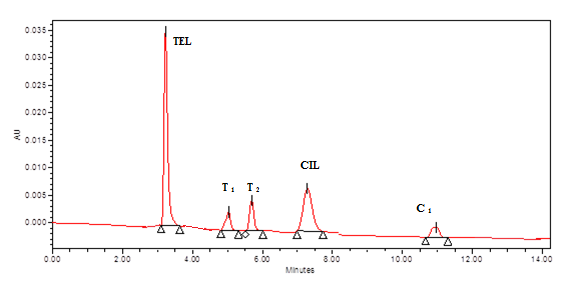
Fig. 3. Chromatogram of alkali degraded sample of (2ppm CIL and 8 ppm TEL at 0.5N NaOH for 1 hour at room temperature.
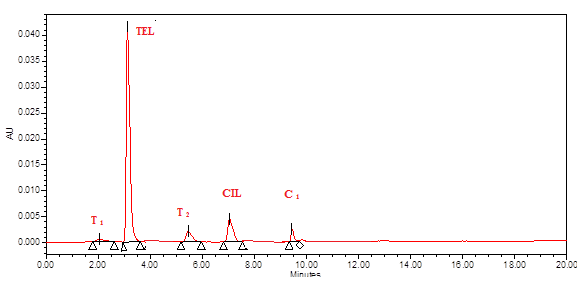
Fig. 4. Chromatogram of acid degraded sample of (2ppm CIL and 8 ppm TEL) at 0.5 N HCl for 1 hour at room temperature.
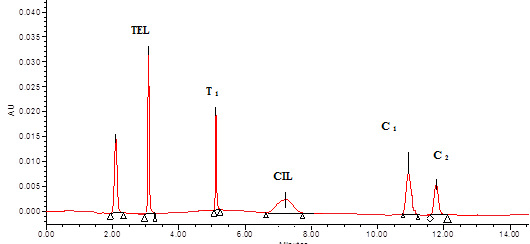
Figure 5.5 Chromatogram of H2O2 degraded sample of (2ppm CIL and 8 ppm TEL at 12% H2O2 for 1 hour at room temperature.
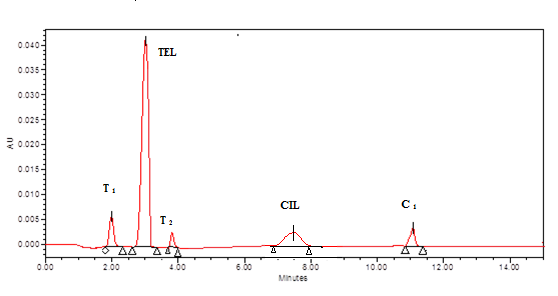
Figure 5.5 Chromatogram after exposure to UV lamp for 24 hours (2ppm CIL and 8 ppm TEL
Tab. 2. Data derived from forced degradation study for CIL and TEL proposed LC method
|
Conditions |
Time |
% degradation of CIL |
% degradation of TEL |
|
Basic(0.5 N NaOH) |
1 hour |
32.7 |
34.4 |
|
Acidic( 0.5 N HCl) |
1 hour |
34.2 |
23.1 |
|
Oxidative(12% H2O2) |
1 hour |
40.8 |
30.15 |
|
UV |
1 day |
38.5 |
17.79 |
Solution stability
Stability of standard and sample solution of CIL and TEL in methanol were evaluated at room temperature for 24 hr. Both the drugs were found to be stable with a recovery of more than 98%
Robustness
The method was found to be robust, as small but deliberate changes in the method parameters have no detrimental effect on the method performance as shown in table 3. The low value of relative standard deviation was indicating that the method was robust.
Tab. 3. Data derived from robustness by proposed LC Method
|
Parameter |
Method condition |
RT |
% RSD of peak area |
||
|
TEL |
CIL |
TEL |
CIL |
||
|
Flow rate |
0.9 ml/min |
3.81 |
7.73 |
1.49 |
1.88 |
|
1.1 ml/min |
2.77 |
6.68 |
1.79 |
1.68 |
|
|
Mobile phase Ratio ACN: Methanol : buffer |
5 :80 : 15 |
3.78 |
7.91 |
1.53 |
1.77 |
|
10 : 85 : 05 |
2.68 |
7.42 |
1.65 |
1.41 |
|
Analysis of marketed formulations
Marketed formulation was analyzed using proposed method which gave percentage recovery for CIL & TEL were 100.9 ± 1.34 and 99.23 ± 1.57 respectively.
CONCLUSION
Proposed study describes stability indicating LC method for the estimation of CIL and TEL in their pharmaceutical dosage form. The method was validated and found to be simple, sensitive, accurate and precise. Statistical analysis proved that method was repeatable and selective for the analysis of CIL and TEL without any interference from the excipients. The method was successfully used for determination of drug in their pharmaceutical formulation. Also the above results indicate the suitability of the method for acid, base, oxidation, and photolytic degradation study. As the method separates the drugs from its degradation products, it can be used for analysis of stability samples. The method is suitable for the routine analysis of CIL and TEL in tablets. In addition, the HPLC procedure can be applied to the analysis of samples obtained during accelerated stability experiments to predict expiration dates of pharmaceuticals.
Dissolution study of tablet formulation
Marketed formulations were analyzed for dissolution studies using proposed method in 0.1 N HCl which gave the good analysis for dissolute, both for CIL and TEL. The RT 7.2 and 3.1 was observed in the chromatogram for CIL and TEL. The % cumulative drug release was calculated and it complies with US-FDA guidelines for dissolution of uncoated tablet (Table 5.23) (Figure 5.19-5.20).
Table 5.23: Dissolution study of Tablet Formulation
|
Time (min) |
CPR |
|
|
|
CIL |
TEL |
|
0 |
0 |
0 |
|
10 |
29.05 |
13.86 |
|
20 |
44.01 |
34.20 |
|
30 |
54.72 |
50.40 |
|
40 |
68.78 |
66.15 |
|
50 |
81.01 |
71.94 |
|
60 |
93.98 |
86.48 |
|
90 |
94.41 |
87.10 |
%CPR is cumulative percentage release of drug (s)
Acknowledgements
Authors are grateful to J.B Chemicals and Pharmaceutical Ltd., Bombay, India for providing gift sample of standard cinnarizine and dimenhydrinate respectively. The authors are very thankful to SICART and Indukaka Ipcowala College of Pharmacy, New Vallabh Vidyanagar, for providing necessary facilities to carry out research work.
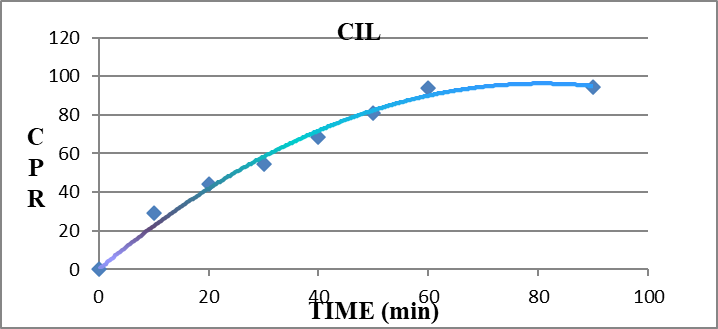
Figure 5.19: CPR of CIL
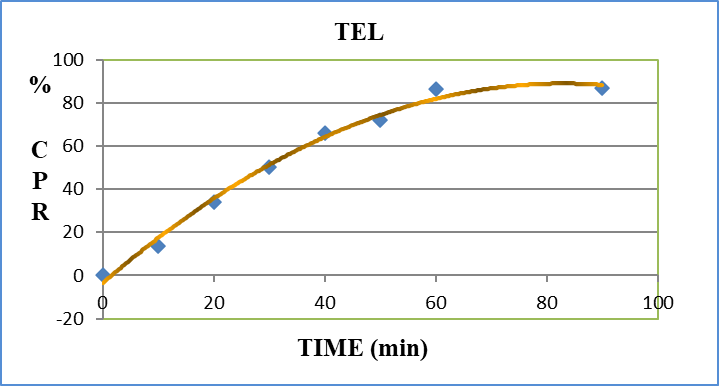
Figure 5. 20: CPR of TEL
REFERENCES


Shahin Iquabalbhai Vahor, Falgun Ashokbhai Mehta, Usmangani Chhalotiya, Dimal Shah, Stability-Indicating Liquid Chromatographic Method and Dissolution Study by RP-HPLC For the Simultaneous Estimation of Cilnidipine and Telmisartan in Tablet Dosage Form, Int. J. of Pharm. Sci., 2025, Vol 3, Issue 3, 3188-3199. https://doi.org/10.5281/zenodo.15110997
 10.5281/zenodo.15110997
