
We use cookies to ensure our website works properly and to personalise your experience. Cookies policy
Department of Pharmaceutical Quality Assurance, Bhagwan Mahavir Centre of Advance Research, Bhagwan Mahavir University, Surat Gujarat, India.
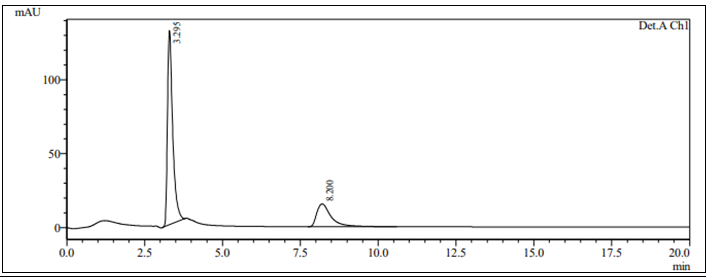
Chromatographic analysis was done using a statistical software called Design Expert 13 version, a stability indicator technique was created, developed and optimized for the concurrent quantitation of Nadifloxacin and Adapalene in marketed dosage form. For mobile phase optimization, the two-factor central composite design and randomized response surface methods were employed. The impact of the independent variables: pH of mobile phase and milliliters of acetonitrile were studied on their critical quality attributes (i.e. retention time of Nadifloxacin, Adapalene and resolution were examined). The C18 Stationary Phase dimension of (250 mm × 4.6 mm, particle size of 5 ?) was used to aid accomplish chromatographic separation using Methanol: Acetonitrile: Water (pH 4.5) adjusted by OPA at 35:55:10 % volume with 1mL min-1 of flow rate at 236 nm. Drugs were eluted with retention time of 3.295 min and 8.200 min for nadifloxacin and adapalene. The validation was completely performed as per ICH Q2 (R1) guideline. The drug stability was studied under forced degradation conditions of acidic, alkaline, thermal, oxidation and under sunlight conditions.
The definition of "Quality by Design" (QbD) is an approach that includes improving scientific understanding of crucial methods and final qualities, developing controls and tests during the development phase based on boundaries of scientific knowledge, and applying the knowledge gathered throughout the products life cycle to work on an environment that promotes continuous improvement [1]. Through a desired set of tests, QbD aims to comprehend the important components and the impacts of their interactions [2]. The knowledge and concept of various ICH Pharmaceutical Development Q8, Quality Risk Management Q9), Pharmaceutical Quality Management System Q10 standards served as the foundation for the QbD approach [3]. Nadifloxacin is a topical fluoroquinolone antibiotic used in treatment of acne vulgaris, skin infections. IUPAC name is 7-fluoro-8-(4-hydroxypiperidin-1-yl)-12-methyl-4-oxo-1-azatricyclo[7.3.1.05,13]trideca-2,5,7,9(13) tetraene-3-carboxylic acid} [4]. By blocking the enzyme DNA gyrase, which is necessary for bacterial DNA generation and replication, nadifloxacin prevents bacteria from multiplying [5]. Adapalene is a topical retinoid of the third generation used for the treatment of acne vulgaris [6]. IUPAC name is {6-[3-(1-adamantyl)-4-methoxyphenyl]naphthalene-2-carboxylic acid}. Adapalene interacts to RAR-beta and RAR-gamma, forming a complex that then attaches to one of three RXRs (retinoid X receptors), which together can bind DNA and control transcriptional activity [7]. Nadifloxacin and Adapalene which treat pimples . Nadifloxacin is an antibiotic. It kills bacteria by preventing them from reproducing and repairing themselves. Adapalene, a kind of vitamin A, unclogs pores, keeps sebum from building up, and permits the skin's outer layers to naturally exfoliate. The fixed dose combination of 10% nadifloxacin and 1?apalene topical gel was approved by CDSCO in June 2015 for the treatment of acne vulgaris [8]. Literature review recommended that various analytical methods like HPLC, UV, HPTLC, UPLC has been developed for individual drug or its combination with another approval pharmaceutical drug but there is no RP-HPLC or Stability indicating method using QbD approaches has been reported for concurrent analysis of nadifloxacin and adapalene in its combined cream formulation. So, the aim of this current research work is developing and optimising RP-HPLC stability indicating method to the pharmaceutical dosage form for quantitation of nadifloxacin and adapalene by using analytical QbD approach. The concepts of ICH Q8 guidelines for development of pharmaceuticals, ICH Q9 guidelines for quality risk management, and ICH Q10 guidelines for pharmaceutical quality system supports the foundation of the quality-by-design. Using design expert software, the chromatographic variables for the proposed approach were optimized using central composite design (2 factor 3 level design). The optimized condition were further used for forced degradation study in different stress conditions. The developed Assay method was completely validated as per ICH Q2(R1) Guideline [9].
MATERIAL AND METHODS:
API and Reagents:
A gift sample of Nadifloxacin (NADI) and Adapalene (ADAP) was acquired from Aarti Industries, Vapi. The method utilized analytical grade reagents and chemicals, HPLC grade solvents, and the marked formulations Nadoxin-A cream containing Nadifloxacin (10mg) and Adapalene (1mg) manufactured by Wockhardt Ltd was used for assay of dosage form.
Instrumentation and Chromatrographic conditions:
A Shimadzu LC-2010C HT Auto Sampler high-performance liquid chromatography system was used to devleop the technique. On a reverse phase column C18 stationary phase (250 × 4.6mm, particle size of 5µm) was intended with aim of chromatographic separation using isocratic elution comprises of Acetonitrile:Methanol:Water (using Ortho Phosphoric Acid, pH was adjusted to 4) of 55:35:10 %v/v/v as mobile phase. The eluents were monitored with a detector set to 236 nm and flow rate determined at 1 ml min-1. Drugs were eluted with retention time of 3.295 min and 8.200 min for nadifloxacin and adapalene. The system suitability parameters as per standards in ICH guidelines depicted in Table-1 were achieved using the chromatographic conditions mentioned above. Using central composite design, the HPLC technique for Nadifloxacin and Adapalene was optimized for a number of factors, selecting pH and mobile phase as two variables at three distinct levels. The trial version of Design Expert 13.0 was utilized to design and optimized the quality by design experiments.
Table 1: System Suitability Parameters
|
Parameters |
Nadifloxacin |
Adapalene |
|
Retention Time |
3.295 min |
8.20 min |
|
Tailing factor |
1.746 |
1.940 |
|
Theoretical plates |
12877.726 |
12549.268 |
|
Resolution |
9.292 |
|
RP-HPLC Method Development:
Preparation of Mobile Phase:
HPLC grade Methanol, Acetonitrile and Water were taken as per ratio in beaker. For pH adjustment of HPLC Grade water, 0.1% Ortho Phosphoric Acid was prepared in one litre volumetric flask was filled to capacity with 1 mL of orthophosphoric acid solution. A 100 mL HPLC water solution was then added to bring the total volume to 1000 mL. Using calibrated pH meter, HPLC grade water was adjusted to pH 4 using prepared ortho phosphoric acid. The whole content of methanol, acetonitrile and water was mixed in 1 litre of volumetric flask. The solution was allowed to degas for five minutes, and then it was filtered with help of a 0.45µ Millipore Whatman filter paper. The mobile phase was ready in ratio of 35:55:10 % v/v/v of {Methanol:Acetonitrile:Water}.
Preparation of Standard and Sample Solutions:
Prepare stock standard solution of Nadifloxacin and Adapalene of respective concentration (1000 µg/ml and 100 µg/ml) (Solution A). Aliquot of 10 ml (solution A) in volumetric flask capacity of 100 ml volumetric flask, the volume was marked up to using diluent which gives concentration of 100 µg/ml of NADI and 10 µg/ml of ADAP (Solution B). Aliquot of 9 ml of solution B in volumetric flask capacity of 10 ml volumetric flask, the volume was marked up with diluent which gives final working solution of 90 µg/ml and 9 µg/ml of NADI and ADAP
Preparation of Sample Solution from marketed dosage form [10]:
In 10 ml of tetrahydrofuran, distribute a portion of the marketed available cream (Nadoxin-A) that contains about 10 milligrams of NADI and 1 milligram of ADAP. After 15 minutes of shaking, 50 milliliters of a solvent combination (50 parts methanol and 50 parts acetonitrile) were added, and the flask was sonicated for ten minutes. The solvent combination was used to make the volume up to the mark. Using Whatman filter paper, the above solution was filtered which gives concentration of 1000 µg/ml and 100 µg/ml of NADI and ADAP. Aliquot of 9 ml was pipetted out from sub-working solution in volumetric flask of 10 ml to give final working solution of 90 µg/ml and 9 µg/ml of NADI and ADAP.
Selection of detection wavelength:
The standard solution of Nadifloxacin and Adapalene was scanned between 200 and 400 nm, and a detection wavelength of 236 nm was chosen as wavelength maxima for analysis.
Forced Degradation Study:
The standard solution for stability study was prepared from stock solution (1000 µg/ml and 100 µg/ml of NADI and ADAP. The appropriate aliquot was pipetted out from stock solution to give working solution of 90 and 9 µg/ml of both drug. Drug was exposed to different stress condition and ?gradation with any degradant peak was studied in alkaline, thermal, oxidative, acidic and photolytic conditions.
Forced degradation conditions [11,12,13]:
For acidic degradation, 3 ml of working solution was taken and added 3 ml of 0.1N HCl. The flask was kept at 60°C for 1 hours. After that 3 ml of 0.1N NaOH was added for neutralization and using diluent volume was made up to mark. For basic degradation working solution was added with 0.1N NaOH at 60°C and here 0.1N HCl was used for neutralisation and the procedure was performed same as explained above. For oxidative, 3% H2O2 was exposed at 60°C for 1 hours and after reaction time using diluent volume was made up to mark. For thermal, drug was exposed in oven at 80°C and the dilution was done with same procedure for above conditions. For photolytic, drug was exposed in UV-sunlight for 24 hours. After all, the sample ready was injected in HPLC and the area after degradation (?gradation) with any degradation peaks if found was study.
HPLC Method development using Design of Experiments:
Determining QTTP: [14]
The QTPP (Quality Targeted Product Profile) is a crucial tool for determining the factors influencing the QTPP parameters. For the suggested HPLC procedure, the retention duration of Nadifloxacin and Adapalene, resolution were determined as QTPP.
Determining CQA: [15]
The method variables that have a direct impact on the QTPP are called CQAs (Critical Quality Attributes). To keep the QTPP within an acceptable response range, two crucial technique parameters were selected in design of optimisation: Volume of Acetonitrile and Mobile Phase pH.
Application of DOE (Design of Experiment) in optimization of method: [16,17,18]
After selection of QTPP and CQA paramters, the central composite design was intended for optimization as the runs of screening are less as comparison to other factorial design. The screening was performed on three coded levels (Low {-1}, Medium {0}, High {+1}) [19]. QTPP parameters (Volume of Acetonitrile, Mobile phase pH) where selected as independent variable key input components. While (Retention time of both drugs, Resolution) were selected as CQA variable response components as shown in Table-2.
Table-2 Coded Value for Independent Variables
|
Factor |
Coded values given factor |
Levels |
||
|
-1 |
0 |
+1 |
||
|
Methanol: Acetonitrile: Water |
A |
40:50:10 |
35:55:10 |
30:60:10 |
|
pH of mobile phase |
B |
3.5 |
4 |
4.5 |
A CCD design of two factor: volume of acetonitrile and mobile phase pH at low, medium and high level, using statistical software (Design Expert, Version 13) gives matrix of design of total 11 experiments as shown in Table-3, where the interaction of effect was studied of volume of acetonitrile, mobile phase pH on retention duration of both drugs and resolution between them.
Table-3 Layout of design matrix using CCD.
|
Std |
Run |
Factor-1 Methanol: Acetonitrile: Water (ml) |
Factor-2 pH |
Response-1 Retention time of NADI (min) |
Response-2 Retention Time of ADAP (min) |
Response-3 Resolution |
|
6 |
1 |
40:50:10 |
4 |
3.67 |
12.31 |
10.77 |
|
1 |
2 |
30:60:10 |
3.5 |
3.99 |
8.55 |
9.56 |
|
3 |
3 |
30:60:10 |
4.5 |
2.87 |
8.84 |
8.69 |
|
5 |
4 |
30:60:10 |
4 |
3.29 |
8.25 |
9.53 |
|
4 |
5 |
40:50:10 |
4.5 |
4.12 |
11.45 |
11.87 |
|
11 |
6 |
35:55:10 |
4 |
3.99 |
8.24 |
9.18 |
|
10 |
7 |
35:55:10 |
4 |
3.56 |
8.76 |
7.67 |
|
2 |
8 |
40:50:10 |
3.5 |
3.41 |
12.93 |
11.27 |
|
8 |
9 |
35:55:10 |
4.5 |
3.87 |
9.122 |
9.34 |
|
9 |
10 |
35:55:10 |
4 |
3.48 |
8.168 |
8.85 |
|
7 |
11 |
35:55:10 |
3.5 |
4.20 |
9.44 |
9.26 |
Analytical Method Validation [20]:
A written proof that offers a high level of assurance for a particular technique that the procedure used to verify the analysis procedure is appropriate for its intended purpose is known as method validation. In accordance with ICH Q2 (R1) recommendations, the devised HPLC technique for concurrent quantification of both drugs was verified.
Specificity [21]:
Here the blank chromatogram of mobile phase is injected to check whether any foreign or other chromatogram is obtained or not. The specificity of method is shown in Fig 5.
System suitability parameters [21]:
As per standard in ICH guidelines, various parameter like resolution, theoretical plates, tailing factor etc are checked to assure that developed method can be use for its intended purpose.
Precision [22] :
Here the solution are analysed for six replicates to check how much the results are deviated for each other. For interday three concentration are analysed three times at a short interval time on same day and intraday three concentration for three different days. The result are accepted as per guideline if RSD is found to be less than 2%.
Linearity [20,13]:
Concentration series of 50-130 µg/ml and 5-13 µg/ml of Nadifloxacin and Adapalene were injected into HPLC and studied at 236nm wavelength. The data of peak area vs concentration graph is plotted to obtain calibration curve. With help of Microsoft excel tools, equation of regression line and R2 coefficient were determined
LOD and LOQ [22,13]:
This can be estimated with help of signal to noise ratio. It determine smallest concentration of drug that can be detected called LOD and smallest concentration of drug that can be quanitifed called LOQ.
LOD = 3.3 × standard deviation / slope of curve
LOQ = 10 × standard deviation / slope of curve
Robustness [22,13]:
It is performed by minor changes in parameter such as change in flow rate and mobile phase to see if any major effect is observed on developed method.
Accuracy [20,21,22,13]:
To characterize accuracy, percent recovery is calculated using an experiment with known added quantities of analytical solution at three levels 80%, 100%, 120%.
Assay [10]:
Disperse a quantity of the cream equivalent to (10mg of Nadifloxacin and 1mg of Adapalene) in 10 ml of tetrahydrofuran. The flask was shaken for 15min and add 50 ml of solvent mixture (50 volumes of methanol and 50 volumes of acetonitrile), Sonicated for 10 min. Volume was made up to the mark with solvent mixture upto mark. Resulting solution mixed is equivalent to 100 ?g/ml of NADI and 10 ?g/ml of ADAP. Above solution was filtered 0.42 ?. The solution was injected into HPLC and mean was calculated for six replicates.
RESULTS AND DISCUSSION:
The method development was started using 50:50 ratio of methanol and water which shows no peak for Nadifloxacin drug. After that, ratio was adjusted to 70:30 which again shows no peak for nadifloxacin drug. So the mobile phase was changed to 50:50 ratio of acetonitrile and water, here both drug showed peak but peak tailing and asymmetry were not achieved as per guideline. The mobile phase was changed to 60:40 ratio of acetonitrile and water, which shows that acetonitrile was needed to improve resolution between drug peaks. So, the final optimized mobile phase was introduce of methanol: acetonitrile: water at 236nm with flow rate 1ml/min. Tailing and broadness of peak was observed so using orthophosphoric acid as modifiers pH of water was adjusted to 4 which shows drug elution at 3.295 min and 8.200 min for NADI and ADAP as shown in Figure 1. For optimization of method, central composite design was applied to above chromatographic conditions.
HPLC method development using statistical approach and profile of predicition with help quality by design experiements:
Eleven runs of the quadric model in central composite design, and the response surface research type were employed. During the process of optimization, an experimental design was employed known as the central composite design (CCD) has given rise in an attempt to identify the best quality and efficient product from the current batches . The suggested CCD approach was used, and the pH of water and volume of acetonitrile were assessed in relation to the three response: Retention period of both drug and resolution between them for optimization of method. The data obtained where incorporated into matrix design of experiment as shown in Table-3. With help of design expert software, the model suggested was quadratic model and ANOVA analysis was done for Response 1 (Retention time of Nadifloxacin), Response 2 (Retention time of Adapalene), Response 3 (Resolution) depicted in Table-4.
Table-4 Anova Model for Quadratic Analysis
|
Response |
Source |
Sum of Squares |
DF |
Mean Square |
F-value |
p-value |
|
|
Response 1 – (Retention time of NADI) |
Model |
9.930E+10 |
2 |
4.965E+10 |
6.47 |
0.0213 |
significant |
|
A-mL of ACN |
8.995E+10 |
1 |
8.995E+10 |
11.72 |
0.0090 |
||
|
B-pH |
9.349E+09 |
1 |
9.349E+09 |
1.22 |
0.3019 |
||
|
Residual |
6.141E+10 |
8 |
7.677E+09 |
||||
|
Lack of Fit |
2.139E+10 |
6 |
3.565E+09 |
0.1781 |
0.9578 |
not significant |
|
|
Pure Error |
4.003E+10 |
2 |
2.001E+10 |
||||
|
Cor Total |
1.607E+11 |
10 |
|||||
|
Response 2 – (Retention time of ADAP) |
Model |
29.56 |
5 |
5.91 |
43.64 |
0.0004 |
significant |
|
A-mL of ACN |
7.62 |
1 |
7.62 |
56.23 |
0.0007 |
|
|
|
B-pH |
0.9874 |
1 |
0.9874 |
7.29 |
0.0428 |
|
|
|
Residual |
0.7885 |
1 |
0.7885 |
5.82 |
0.0607 |
|
|
|
Lack of Fit |
5.77 |
1 |
5.77 |
42.61 |
0.0013 |
|
|
|
Pure Error |
0.6501 |
1 |
0.6501 |
4.80 |
0.0800 |
|
|
|
Cor Total |
0.6775 |
5 |
0.1355 |
|
|
|
|
|
Response 3 – (Resolution) |
Model |
12.79 |
5 |
2.56 |
6.57 |
0.0297 |
significant |
|
A-mL of ACN |
5.10 |
1 |
5.10 |
13.10 |
0.0152 |
|
|
|
B-pH |
0.4964 |
1 |
0.4964 |
1.27 |
0.3102 |
|
|
|
AB |
0.5402 |
1 |
0.5402 |
1.39 |
0.2919 |
|
|
|
A?2; |
4.26 |
1 |
4.26 |
10.93 |
0.0213 |
|
|
|
B?2; |
0.5191 |
1 |
0.5191 |
1.33 |
0.3005 |
|
|
|
Residual |
1.95 |
5 |
0.3895 |
|
|
|
|
|
Lack of Fit |
0.6780 |
3 |
0.2260 |
0.3560 |
0.7946 |
not significant |
Response 1: The Model F-value of 6.47, 43.64, 6.57 supports the model is significant. P-values less than 0.0500 of all three models indicate model terms are significant. The Predicted R?2; of 0.6390 is in reasonable agreement with the Adjusted R?2; of 0.7634, 0.8663 is in reasonable agreement with the Adjusted R?2; of 0.9552; i.e. the difference is less than 0.2, 0.6012 is in reasonable agreement with the Adjusted R?2; of 0.7357, Signal to noise ratio of 8.731, 17.97, 6.73 is greater than 4 is an adequate signal. From figure 4a and polynomial equation for Response 1, Rt of NADI= -0.7802 + 2.44 × A + 1.71 × B – 04573 × AB – 0.3265 × A2 + 0.2295 × B2, it can be said that positive ?1 coefficient (2.44) indicated that as volume of ACN (A) increases, Retention time of Nadifloxacin also increases. From figure 4b and polynomial equation for Response 2, Rt of ADAP = +40.07 – 13.92 × A – 2.03 × B + 0.4440 × AB + 1.51 × A2 + 0.5066 × B2, it can be said that negative ?1 coefficient (-13.92) indicated that as volume of ACN (A) decreases, Retention time of Adapalene also decreases. From figure 4c and polynomial equation for Response 3, Rs = +33.51 – 11.39 × A + 1.44 × B - 0.3675 × AB + 1.30 × A2 + 0.4527 × B2, it can be said that negative ?1 coefficient (-11.39) indicated that as volume of ACN (A) decreases, Resolution also decreases. When seen as a two-dimensional plane in a contour plot, the response surface is formed by joining all points that have the same response to construct counterlines of constant responses. A surface plot can make the reaction easier to observe by providing a three-dimensional image of it. The perturbation plot suggest that volume of acetonitrile is key factor and has direct effect for increasing retention time and resolution as shown in Fig 2. Surface and counter plot for Retention time of nadifloxacin, Retention time of Adapalene, resolution between them are depicted in Fig 3 and Fig 4. After studing all reponses and interaction, the final optimized solution obtained from software is depicted in Table-5.
Table-5 Optimized Final Solution from DOE Software
|
Number |
mL of ACN |
pH |
R1-Retention Time |
R2-Theoretical Plates |
R3-Resolution |
Desirability |
|
1 |
60.000 |
4.000 |
3.233 |
8.211 |
8.960 |
0.441 |
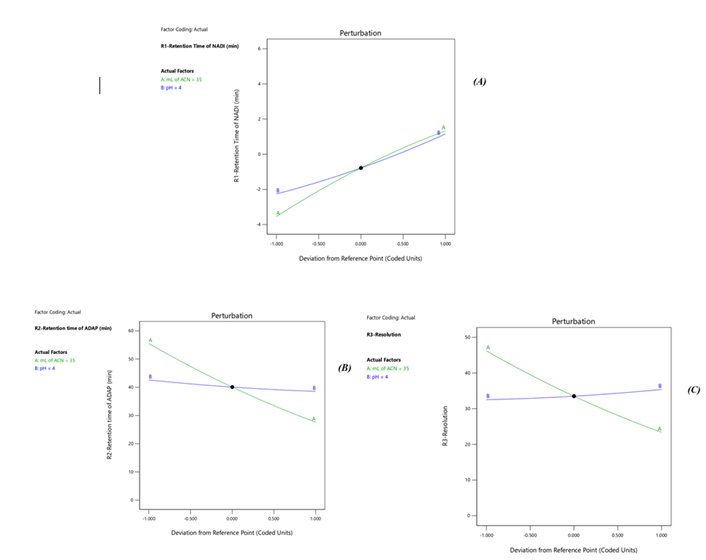
Fig 2. Pertubation Plot (A) Rt of Nadifloxacin, (B) Rt of Adapalene, (C) resolution, where A is ml of acetonitrile (v/v) and B is mobile phase pH
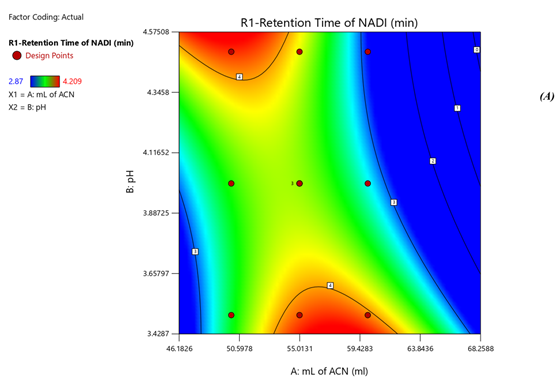
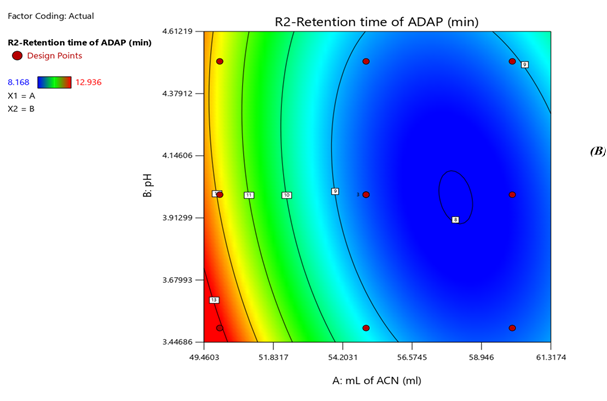
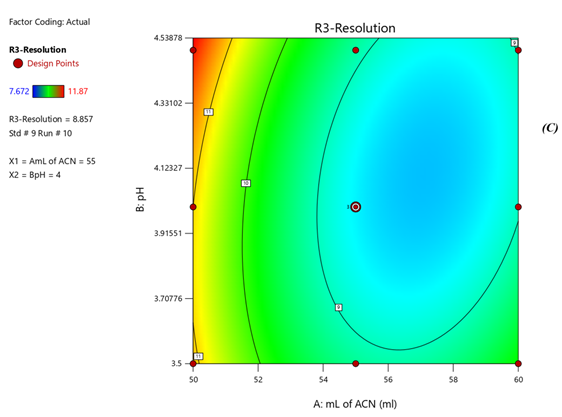
Fig 3. Contour plots of (A) Rt of Nadifloxacin, (B) Rt of Adapalene, (C) resolution
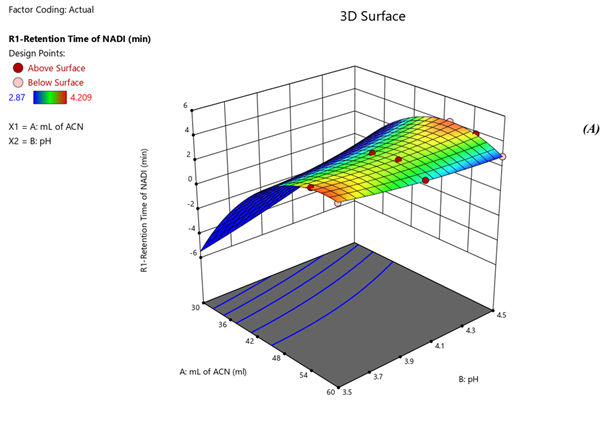
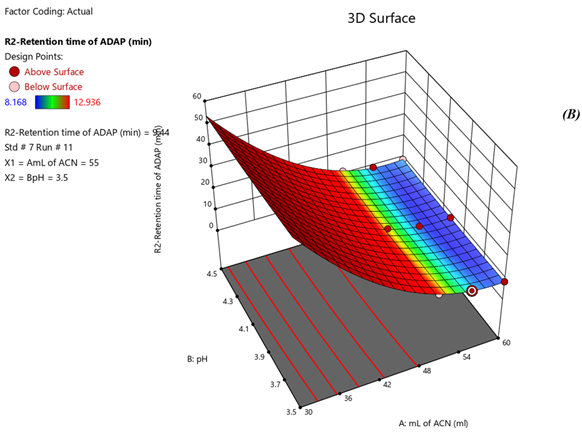
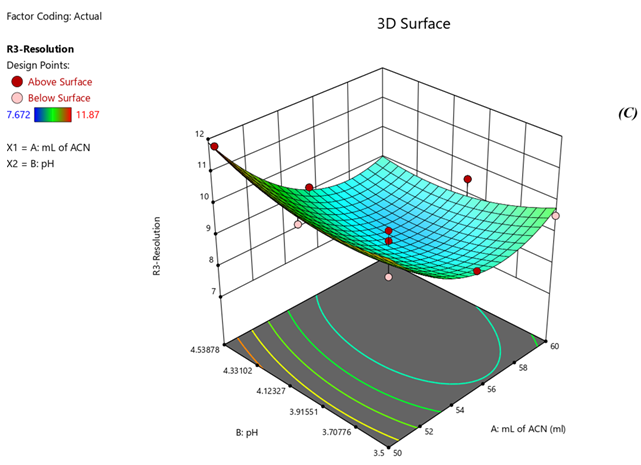
Fig 4. Surface Plots of (A) Rt of Nadifloxacin, (B) Rt of Adapalene, (C) resolution
Method Validation:
Linearity, LOD and LOQ:
The data obtained for linearity in range of 50-130 µg/ml and 5-13 µg/ml of Nadifloxacin and Adapalene by taking mean of six replicates and the lowest concentration for detection and quantitation limit is shown in Table-6. For linearity, R2 was achieved near to 1 which shows the relation is linear. LOD and LOQ was calculated with help of slope and standard deviation which was introduced later in formula.
Table-6 Linearity, LOD and LOQ
|
Parameters |
NADI |
ADAP |
|
Linearity concentration (µg/ml) |
50-130 |
5-13 |
|
Linear coefficient R2 |
0.9948 |
0.992 |
|
Linearity equation |
y=15260x+178748 |
y=49732x+43943 |
|
LOD (µg/ml) |
2.1648 |
0.2119 |
|
LOQ (µg/ml) |
6.6502 |
0.6514 |
Precision:
The % RSD for nadifloxacin (900 ?g/ml) and adapalene (90 ?g/ml) was calculated by measuring of same concentration for six replicates. Interday and intraday precisions were shown in Table-7.
Table-7 Precision Studies
|
Drugs
|
Concentration (µg/ml) |
Repeatability (n=6) |
Interday (n=3) |
Intraday (n=3) |
|||
|
% Assay found ± SD |
RSD (%) |
% Assay found ± SD |
RSD (%) |
% Assay found ± SD |
RSD (%) |
||
|
NADI |
90 |
99.23 ± 1.21 |
0.2507 |
98.88 ± 0.60 |
0.4520 |
99.20 ± 0.33 |
0.19 |
|
ADAP |
9 |
99.10 ± 0.87 |
0.4808 |
98.91 ± 0.46 |
0.5211 |
99.16 ± 0.48 |
0.52 |
Robustness:
In the intended method minor changes in parameter are done to see how unaffected method is. The minor changes were done in Mobile phase and flow rate which shows there was no significant change on peak area as depicted in Table-8 which proves method is robust.
Table- 8 Robustness of Method
|
Drugs |
Parameters |
Level |
Peak Area ± S.D. (n=3) |
% R.S.D |
Rt ± S.D. (n=3) |
% R.S.D |
|
NADI |
Mobile Phase (v/v) |
33:57:10 |
973934 ± 1404.96 |
0.1442 |
3.1745 ± 0.0309 |
0.9728 |
|
37:53:10 |
987562 ± 1581.54 |
0.1601 |
3.4736 ± 0.0244 |
0.7041 |
||
|
Flow Rate (ml/min) |
0.8 ml/min |
986633 ± 2947.27 |
0.2987 |
3.6593 ± 0.0286 |
0.7838 |
|
|
1.2 ml/min |
994785 ± 3197.81 |
0.3230 |
2.9492 ± 0.0110 |
0.3737 |
||
|
ADAP |
Mobile Phase (v/v) |
33:57:10 |
296956 ±± 789.36 1144.27 |
0.3853 |
8.5040 ± 0.041 41 |
0.5196 |
|
|
37:53:10 |
299428 ± 572.56 |
0.1912 |
8.2033 ± 0.0654 |
0.7976 |
|
|
Flow Rate (ml/min) |
0.8 ml/min |
273897 ± 865.78 |
0.2898 |
8.4953 ± 0.0380 |
0.4481 |
|
|
|
1.2 ml/min |
298209 ± 525.87 |
0.1763 |
8.1546 ± 0.0385 |
0.4727 |
Specificity:
Here the placebo and standard solution is injected into HPLC. By comparing the peak the developed method is checked to find if there is any interference from excipients or degradants. From Fig 5 it shows blank mobile phase run which give evidence for no other interference of peak was determined.
Fig 5. Blank mobile phase chromatogram
Accuracy:
Recovery study was performed to study accuracy. Three different amounts of spiking were used to create the sample solutions: 80%, 100%, and 120%. Table 9 displays the percentage recovery results that were acquired using the suggested HPLC procedure. The percentage of recovery within 98–102% supports the accuracy of the established approach in accordance with ICH Q2 (R1) recommendations [9].
Table-9 Accuracy Study
|
Drugs |
Label claim |
Amount added (ppm) |
Standard (ppm) |
Total concentration found (µg/ml) |
Amount of sample found |
% Recovery |
% RSD |
|
NADI |
10mg |
0 (0%) |
50 |
50 |
49.35 |
98.70 |
1.24 |
|
40 (80%) |
50 |
90 |
88.28 |
98.08 |
1.19 |
||
|
50 (100%) |
50 |
100 |
99.12 |
99.12 |
1.32 |
||
|
60 (120%) |
50 |
110 |
109.23 |
99.30 |
1.21 |
||
|
ADAP |
1mg |
0 (0%) |
5 |
5 |
4.94 |
98.80 |
1.43 |
|
4 (80%) |
5 |
9 |
8.91 |
99.00 |
1.39 |
||
|
5 (100%) |
5 |
10 |
9.92 |
99.20 |
1.53 |
||
|
6 (120%) |
5 |
11 |
10.91 |
99.18 |
1.28 |
Assay:
By performing the assay method explained above on marketed cream (Nadirest-M). The results are shown in Table-10. Drug content found was compared with label claim and % drug amount was found 99.34 ± 0.6274 and 99.02 ± 0.0152 (n=3) for Nadifloxacin and Adapalene.
Table-10 Assay of Marketed Cream (Nadirest-M)
|
Drugs |
Amount taken (µg/ml) |
Assay recovery (% ± SD) (n=6) |
% RSD |
|
NADI |
90 |
99.34 ± 0.6274 |
0.78 |
|
ADAP |
9 |
99.02 ± 0.0152 |
0.62 |
Forced Degradation Study [11,12,23]:
To check drug deterioration and stability, working solution (90 µg/ml and 9 µg/ml of nadifloxacin and adapalene) was exposed to different stress conditions like acidic (Fig 6), alkaline (Fig 7), thermal (Fig 8) , oxidative (Fig 9) and photolytic (Fig 10) condition. For acidic degradation, a degradant peak was observed at 2.851 min with 7.11% and 13.99?gradation was found for NADI and ADAP. For basic degradation, a degradant peak was observed at 2.913 min with 2.36% and 18.88?gradation was found for NADI and ADAP. For oxidative degradation, no degradant peak was obtained and 27.61% and 50.31?gradation was found for NADI and ADAP. For photolytic degradation, 2.64% and 13.97?gradation was found for NADI and ADAP with no degradant peak. For thermal degradation, no degradant peak was found and 5.79%, 14.29?gradation was found for NADI and ADAP. The treated sample was injected into HPLC using peak area and comparing with standards peak, ?gradation were calculated. The data of degradation is represented in Table-11 [24].
Table-11 Forced Degradation Study Data for Nadifloxacin and Adapalene
|
Degradation media |
Degradation conditions |
Degradation (%) |
Potency (%) |
||
|
NADI |
ADAP |
NADI |
ADAP |
||
|
Acidic degradation |
0.1 N HCl, 60 ? |
7.11 |
13.99 |
92.89 |
86.01 |
|
Alkaline degradation |
0.1 N NaOH, 60 ? |
2.36 |
18.88 |
97.64 |
81.12 |
|
Thermal degradation |
Oven at 80 ? |
5.79 |
14.29 |
94.2 |
85.71 |
|
Photolytic degradation |
Sunlight for 24 hours |
2.64 |
13.97 |
97.36 |
86.03 |
|
Oxidative degradation |
3% H202, 60 ? |
27.16 |
50.31 |
72.84 |
49.69 |
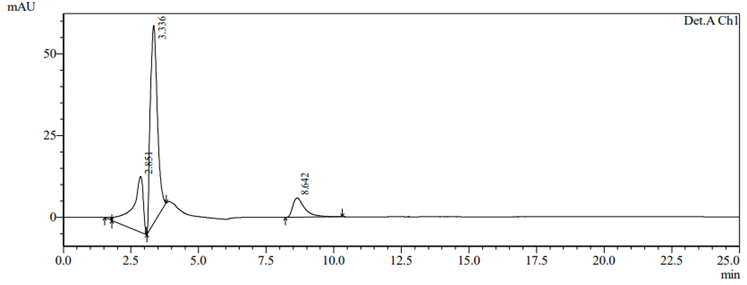
Fig 6. Acidic degradation chromatogram
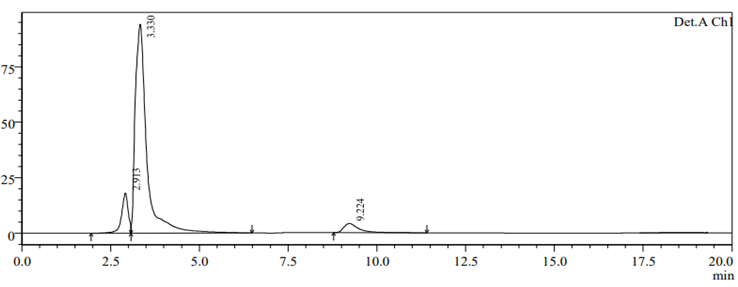
Fig 7. Alkaline degradation chromtogram
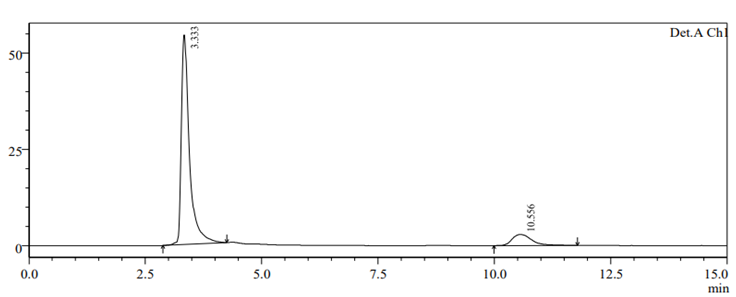
Fig 8. Thermal degradation chromatogram
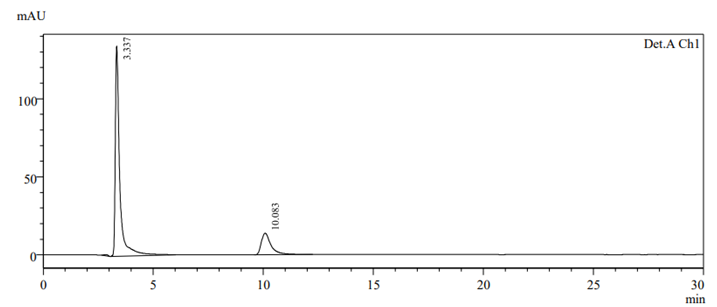
Fig 9. Oxidative degradation chromatogram
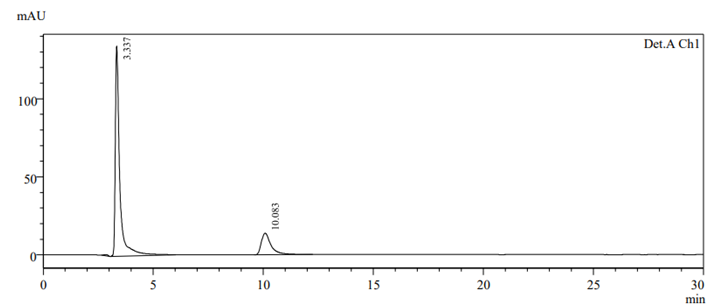
Fig 10. Photolytic degradation chromatogram
CONCLUSION:
An approach to above method development using quality-by-design has been explained. The ATPP helps to clarify the technique aims. The experimental design details the investigation of the essential elements of the HPLC process, such as the vol of acetonitrile and pH of water. The development of the HPLC method for ceftriaxone sodium involved the application of analytical QbD concepts. A multivariant analysis of several significant process parameters, including the combination of two factors: volume of acetonitrile and the pH of the water at three different levels was carried out in order to identify the optimal system and the final design space. Using central composite design, their relationships were examined and optimized on several levels. The study was done on three critical quality attributes: retention duration of NDI, Retention duration of ADAP, resolution between them. A crucial component of response surface mythology is the CCD model. The primary benefit of this kind of optimization model is its increased accuracy, which eliminates the necessity for a three-level factorial experiment when creating a second-order quadratic model [25]. There is a lower possibility of failure during method validation and transfer thanks to the improved understanding of method variables made possible by the QbD approach to method creation. The Design Expert software-based automated QbD method development technique has offered a more reliable, high-performing technique in less time than developing a manual approach. The developed method was also apply to forced degradation study and drug stability was studied. The validation was done completely as per ICH Q2(R1) guideline and it was concluded that all parameters were in range of standard criteria and method was found to be linear, precise, robust, specific and reproducible result.
ACKNOWLEDGEMENTS:
The author is thankful to her guide Dr. Zarna Dedania (HOD and Professor) for the constant support during this work. The author also thanks to Dr. Arindam Paul (Principal) ROFEL SHRI G M BILAKHIA COLLEGE OF PHARMACY, Vapi for providing me environment and moral support throughout my research work.
REFERENCES


Naik Shreya*, Zarna Dedania, Application of Central Composite Design for RP-HPLC Assay Method in Concurrent Quantitation of Nadifloxacin and Adapalene: Development and Validation with Forced Degradation Study, Int. J. of Pharm. Sci., 2025, Vol 3, Issue 1, 1442-1457. https://doi.org/10.5281/zenodo.14685265
 10.5281/zenodo.14685265