DCS’s ARA College of Pharmacy, Nagaon, Dhule.
This research aimed to develop and validate a simple, precise, and rapid reverse-phase high-performance liquid chromatography (RP-HPLC) method for the quantitative analysis of Afatinib in tablet dosage form using the Analytical Quality by Design (AQBD) approach. The method utilized a C18 column (100 mm × 4.6 mm, 2.5 ?m particle size) in gradient mode, with a mobile phase composed of methanol (65 mL) and 0.1% triethylamine (TEA) in water (35 mL, pH 3.3), at a flow rate of 1.0 mL/min. Detection was performed at 256 nm, with Afatinib eluting at a retention time of 3.838 minutes. The method was validated as per ICH guidelines for parameters including accuracy, precision, linearity, specificity, and sensitivity. Calibration curves demonstrated linearity in the range of 10–50 ?g/mL, with a recovery rate of 99.48%, confirming the method's reliability and reproducibility. The RP-HPLC method was applied successfully to the analysis of marketed tablet formulations and proved to be economical, robust, and suitable for routine quality control. This approach offers a cost-effective alternative to MS-based methods while maintaining high accuracy, precision, and robustness, making it an efficient tool for the routine analysis of Afatinib in pharmaceutical formulations.
Afatinib, a second-generation tyrosine kinase inhibitor, is widely used for the treatment of non-small cell lung cancer (NSCLC) with epidermal growth factor receptor (EGFR) mutations. Its potent and irreversible inhibition of EGFR, along with other members of the ERBB family, provides significant clinical advantages over first-generation inhibitors. The accurate quantification of Afatinib in pharmaceutical dosage forms is essential for quality control, ensuring therapeutic efficacy, and maintaining regulatory compliance. Reverse-phase high-performance liquid chromatography (RP-HPLC) is a widely employed analytical technique due to its robustness, sensitivity, and precision in pharmaceutical analysis. Recent advancements in analytical quality by design (AQbD) have revolutionized method development by providing a systematic, risk-based approach that ensures reliability and reproducibility. The AQbD framework emphasizes a science-driven understanding of method parameters and their impact on critical quality attributes (CQAs), enabling the development of a robust analytical method with minimal variability. The current study focuses on the development and validation of a rapid RP-HPLC method for the quantitative analysis of Afatinib in tablet dosage forms using the AQbD approach. The method was designed to achieve optimal separation, sensitivity, and reproducibility within a minimal runtime, ensuring efficiency for routine quality control applications. Method validation was performed in accordance with International Council for Harmonisation (ICH) guidelines, assessing parameters such as specificity, linearity, accuracy, precision, and robustness. This work aims to bridge the gap in existing literature by providing a comprehensive and efficient analytical solution for Afatinib quantification. By employing the AQbD approach, the developed method ensures enhanced analytical performance while aligning with regulatory expectations for method robustness and quality assurance. This study highlights the critical role of AQBD in modern pharmaceutical analysis, paving the way for future advancements in method development.
MATERIALS AND METHOD:
1. Selection and Procurement of Drug: In method development and validation of preservatives following chemicals and reagents were used.
Table 1: List of Reagents and Chemicals used
|
Sr. No. |
Name of chemicals |
Suppliers |
|
1 |
Afatinib |
R.S.I.T.C Jalgaon |
|
2. |
Acetonitrile (HPLC grade) |
Merck Ltd., India |
|
3. |
Methanol (HPLC grade) |
Merck Ltd., India |
|
4. |
0.1% TEA (HPLC grade) |
Merck Ltd., India |
|
5. |
water (HPLC grade) |
Merck Ltd., India |
2. Selection of formulation: From the literature survey and market survey we selected Maxide formulation for work.
Marketed Preparation: The marketed preparation was obtained from local market.
Table 2: List of brand names of combined formulations of Afatinib
|
Sr. No |
Brand Name |
Formulation |
Available strength |
Company |
|
1. |
Xovoltib |
Tablet |
Afatinib= 40 mg |
Shree Pharma Pvt.
ltd |
3. Selection of Analytical Technique
HPLC was selected as analytical technique for estimation of Afatinib. The analysis of the drug was carried out on Agilent Tech. Gradient System with Auto injector, (DAD) &Gradient Detector. Equipped with Reverse Phase (Agilent) C18 column (4.6mm x 100mm; 2.5µm), a 20µl and UV730D Absorbance detector and running chemstation 10.1 software.
Stock preparations:
Stock I: Standard Sample Preparation: Std. AFATINIB 10 mg in 10 ml Methanol = 1000 µgm/ml.
Stock II: Tab solution Preparation: Take 15.5 mgs in 10 ml water i.e. = 1000 µgm/ml
For Accuracy Solution Preparations: Take 10 µgm/ml tab solution for accuracy,
80 % = 0.1 ml tab solution and add 8µgm/ml std. and make up vol 10 ml with mobile phase
100 % =0.1 ml tab solution and add 10 µgm/ml std. and make up vol 10 ml with mobile phase
120 %= 0.1 ml tab solution and add12 µgm/ml std. and make up vol 10 ml with mobile phase
Chromatographic conditions: The following chromatographic conditions were established by trial and error and were kept constant throughout the experimentation.
Table 3: chromatographic conditions (HPLC) details used during method Development:
|
1. |
HPLC |
Agilent ( S.K)Gradient System
DAD Detector |
|
2. |
Software |
Chemstation |
|
3. |
Column |
(Agilent) C18 column (4.6mm x 100mm) |
|
4. |
Particle size packing |
2.5 um |
|
5. |
Stationary phase |
C-18 (Agilent) |
|
6. |
Mobile Phase |
MEOH : Water (0.1% with TEA ) 65:35 |
|
7. |
Detection Wavelength |
256 nm |
|
8. |
Flow rate |
1.0 ml/min |
|
9. |
Temperature |
26° C (Ambient) |
|
10. |
Sample size |
20 ul |
|
11. |
pH |
3.3 |
|
12. |
Run Time |
15 min |
|
13. |
Filter paper |
0.45 um |
RESULT AND DISCUSSION:
Preliminary studies on Afatinib
1. Melting point: The procured reference standard of Afatinib was found to melt in the range of 183-186 0C respectively.
2. Solubility: The drug was found to be freely soluble in Methanol.
3. UV Spectroscopy: UV absorption of 10 µg/mL solution of Afatinib in Methanol was generated and absorbance was taken in the range of 200-400 nm. ? max of Afatinib in Methanol was found to be 256 nm.

Fig No.1: UV Spectrum of Afatinib.
4. Optimized Method: In the standard mixture of Afatinib theoretical plates were found above 2000 i.e. for Afatinib 6028 at minimum RT 3.826.
Table 3: Optimized Method
|
Flow rate (Ml/min)
|
Mobile phase composition (mL) |
|
1 mL |
Methanol: Water (0.1%TEA) (65:35) |
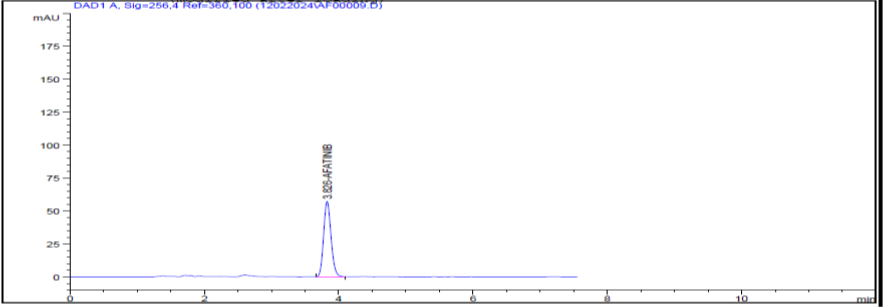
Fig No. 2: Chromatogram of standard Combination of Afatinib
Table4:Details of chromatogram of standard containing Afatinib
|
No. |
RT [min] |
Area[mV*s] |
TP |
TF |
Resolution |
|
1 |
3.826 |
438.32938 |
6028 |
0.83 |
- |
5. Std. Calibration curve: The data obtained in the calibration experiments when subjected to linear regression analysis showed a linear relationship between peak areas and concentrations in the range 10-50 µg/mL for Afatinib (Table 5) depict the calibration data of Afatinib The respective linear equation for Afatinib was y = 8.7621x – 0.564 equation where x is the concentration and y is area of peak. The correlation coefficient was 0.999. The calibration curve of Afatinib is depicted in (Fig No. 3).
Table 5: Result of Linearity data for Afatinib
|
Method |
Conc. µg/ml |
Peak area(µV.sec) |
Average peak area (µV.sec) |
S.D. of Peak Area |
% RSD of Peak Area |
|
|
1 |
2 |
|||||
|
RP-HPLC Method |
10 |
88.711 |
88.3342 |
88.5226 |
0.2664 |
0.3010 |
|
20 |
173.5036 |
173.6889 |
173.5963 |
0.1310 |
0.0755 |
|
|
30 |
260.3951 |
260.9037 |
260.6494 |
0.3596 |
0.1380 |
|
|
40 |
350.7162 |
350.4809 |
350.5986 |
0.1664 |
0.0475 |
|
|
50 |
438.3293 |
437.9244 |
438.1269 |
0.2863 |
0.0653 |
|
|
|
Equation |
y = 8.7621x-0.564 |
||||
|
R2 |
0.999 |
|||||
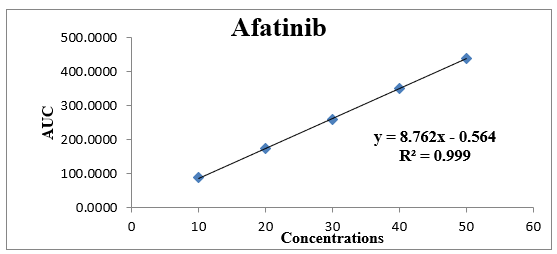
Fig.No.3: Std. Calibration curve of Afatinib.
The RP-HPLC Method for respective linear equation for Afatinib was y = 8.762X+0.564 where x is the concentration and y is area of peak. The correlation coefficient was 0.9999. The calibration curve of Afatinib is depicted in Fig No.3
Result of Analytical of Method Validation:
Linearity: From Afatinib standard stock solution, different working standard solutions (10-50?g/ml) were prepared in mobile phase were prepared in mobile phase 20 ?L of sample solution was injected into the chromatographic system using fixed volume loop injector. Chromatograms were recorded. The area for each Conc. was recorded (Table 6). The Calibration curves are shown in Fig. No. 4)
Table 6: Linearity of AFATINIB
|
Concentration ?g/ml |
Area Afatinib |
|
10 |
88.5226 |
|
20 |
173.5963 |
|
30 |
260.6494 |
|
40 |
350.5986 |
|
50 |
438.1269 |
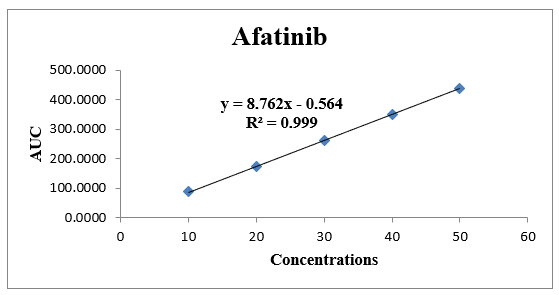
Fig. No. 4: Calibration curve for HPLC method.
Table 7: Result of Regression equation data for Afatinib
|
Regression Equation Data Y= mx + c
|
|
|
Slope(m) |
8.762x |
|
Intercept(c) |
0.564 |
|
Correlation Coefficient |
0.9999 |
Linearity of of Afatinib was observed in the range of 10-50?g/ml. Detection wavelength used was 256nm (Table 7). The plot should be linear passing through the origin, Correlation Coefficient should not be less than 0.999.that concluded..
Accuracy: Recovery studies were performed to validate the accuracy of developed method. To pre analyzed tablet solution, a definite concentration of standard drug (80%, 100%, and 120%) was added and then its recovery was analyzed (Table 8).
Table 8: Result of Recovery data for Afatinib
|
Level (%) |
Amt. taken (?g/ml |
Amt. Added(?g/ml) |
Area Mean* ± S.D. |
Amt. Recovered Mean *±S.D. |
% Recovery Mean *± S.D. |
|
80% |
10 |
08 |
18.00±0.06 |
8.00±0.06 |
100.4±0.82 |
|
100% |
10 |
10 |
20.01±0.04 |
20.58±0.04 |
100.19±0.4 |
|
120% |
10 |
12 |
22.00±0.02 |
20.58±0.23 |
100.01±0.18 |
Accuracy of RP-HPLC method is ascertained by recovery studies performed at different levels of concentrations (80%, 100% and 120%). The % recovery was found to be within 99-101% (Table 8).
System suitability parameters :( Repeatability): To ascertain the resolution and reproducibility of the proposed chromatographic system for estimation of Afatinib system suitability parameters were studied the result shown in below (Table 9, and 10).
Table no 37: Chromatogram of System suitability -1(40).
|
No. |
RT [min] |
Area[mV*s] |
TP |
TF |
Resolution |
|
1 |
3.839 |
349.8402 |
5930 |
0.84 |
0.000 |
Table 10: Repeatability studies on RP-HPLC for Afatinib:
|
Method |
Concentration of Afatinib (mg/ml) |
Peak area |
Amount found (mg) |
% Amount found |
|
RP-HPLC Method for AFT |
40 |
349.8402 |
40.05 |
100.14 |
|
40 |
351.5623 |
40.06 |
100.15 |
|
|
|
Mean |
40.05 |
100.14 |
|
|
|
SD |
0.75 |
0.76 |
|
|
|
%RSD |
0.21 |
0.21 |
Repeatability studies on RP-HPLC for Afatinib was found to be ,The %RSD was less than 2%, which shows high percentage amount found in between 100.14% indicates the analytical method that concluded (Table 10).
Precision: The method was established by analyzing various replicates standards of Afatinib. All the solution was analyzed thrice in order to record any intra-day & inter-day variation in the result that concluded. The result obtained for intraday is shown in (Table 11) respectively.
Table 11: Result of Intraday and Inter day Precision studies on RP-HPLC
|
Method |
Drug |
Concn (µg/ml) |
Intraday Precision |
Interday Precision |
||
|
Mean± SD |
%Amt Found |
Mean± SD |
%Amt Found |
|||
|
Rp- HPLC Method
|
AFT |
20 |
173.74± 0.96 |
99.77 |
173.54± 5.65 |
99.35 |
|
30 |
260.58±0.571 |
99.34 |
262.32±1.69 |
100.00 |
||
|
40 |
349.86±0.92 |
99.98 |
350.74±3.06 |
100.23 |
||
*Mean of each 3 reading for RP-HPLC method
Intraday and Inter day Precision studies on RP-HPLC method for Afatinib which shows the high precision %amount in between 98% to 102% indicates to analytical method that concluded.
Robustness: The Robustness of a method is its ability to remain unaffected by small deliberate changes in parameters. To evaluate the robustness of the proposed method, small but deliberate variations in the optimized method parameters were done. The effect of changes in mobile phase composition and flow rate, wavelength on retention time and tailing factor of drug peak was studied. The mobile phase composition was changed in (±1 ml/min-1) proportion and the flow rate was varied by(±1ml/min-1), and wavelength change(±1 ml/min-1)of optimized chromatographic condition. The results of robustness studies are shown in (Table 12, 13, and 14).Robustness parameters were also found satisfactory; hence the analytical method would be concluded.
Table 12: Chromatogram of flow change 0.9 ml
|
No. |
RT [min] |
Area[mV*s] |
TP |
TF |
Resolution |
|
1 |
4.473 |
511.6609 |
6236 |
0.84 |
- |
Table 13: Chromatogram of flow change 1.1 ml
|
No. |
RT [min] |
Area[mV*s] |
TP |
TF |
Resolution |
|
1 |
3.358 |
382.0206 |
5632 |
0.85 |
- |
Table 14: Chromatogram of Mobile phase composition
|
No. |
RT [min] |
Area[mV*s] |
TP |
TF |
Resolution |
|
1 |
4.060 |
438.5600 |
5812 |
0.85 |
- |
Mobile phase change (66% MEOH, 34% 0.1% TEA) :-
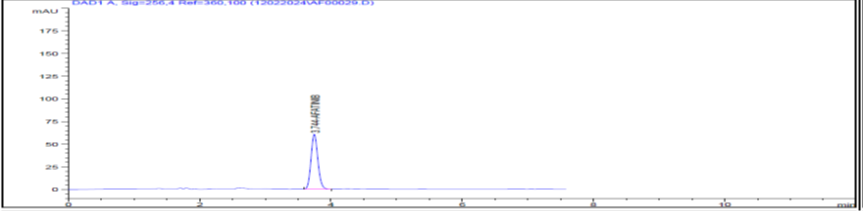
Fig No. 5: Chromatogram of Mobile phase composition (66 MEOH+34% TEA
Table 15: Chromatogram of Mobile phase composition (66 MEOH+34% 0.1 %TEA):
|
No. |
RT[min] |
Area[mV*s] |
TP |
TF |
Resolution |
|
1 |
3.744 |
438.0704 |
6498 |
0.85 |
- |
2) Wavelength changes 255 nm:
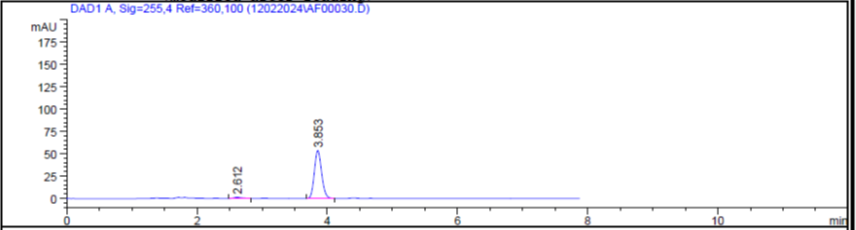
Fig. No 6: Chromatogram of wavelength changes 255 nm.
Table 16: Chromatogram change wavelength change 255 nm:
|
No. |
RT [min] |
Area[mV*s] |
TP |
TF |
Resolution |
|
1 |
3.853 |
418.5823 |
5840 |
0.84 |
0.000 |
3) Wavelength change 257 nm:
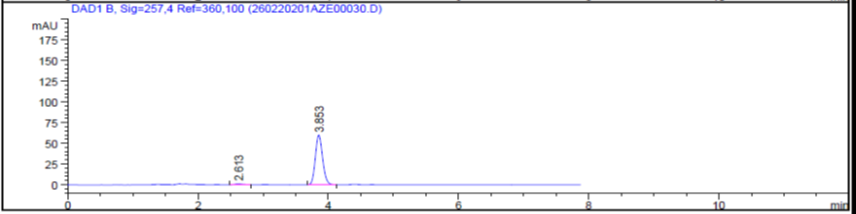
Fig. No 7: Chromatogram of comp change wavelength change 257 nm.
Table 17: Chromatogram of comp change wavelength change 257nm:
|
No. |
RT [min] |
Area[mV*s] |
TP |
TF |
Resolution |
|
1 |
3.853 |
465.8335 |
5840 |
0.84 |
- |
Table 18: Result of Robustness Study of Afatinib:
|
Parameters
|
Conc.(µg/ml) |
Amount of detected (mean ±SD) |
% RSD |
|
Chromatogram of flow change 0.9ml |
50 |
512.18±0.73 |
0.14 |
|
Chromatogram of flow change 1.1 ml |
50 |
383.69±1.50 |
0.62 |
|
Chromatogram of comp change 64Meoh +36 WATER |
50 |
439.4±1.20 |
0.20 |
|
Chromatogram of comp change 66 MEOH + 34 WATER |
50 |
438.83±2.48 |
0.57 |
|
Chromatogram of comp change wavelength change 255nm |
50 |
466.68±1.20 |
0.26 |
|
Chromatogram of comp change wavelength change 257nm |
50 |
418.1±0.66 |
0.16 |
Robustness Study of Afatinib: The changes were did flow rate (±1 ml/ min-1), PH of mobile phase composition (±1 ml/ min-1), and Wavelength (±1 ml/ min-1). %RSD for peak area was calculated which should be less than 2%.the result shown in analytical method that concluded.
Result of Limit of detection = 3.3 X 0.24/8.762= 0.5174 (?g/mL). The LOD of Afatinib was found to be 0.5174 (?g/mL) analytical methods that concluded
Result of Limit of Quantitation = 10 X0.24/ 8.762=0.2739 (?g/mL). The LOQ of Afatinib was found to be 0.2739 (?g/mL), analytical method that concluded.
Result of Analysis tablet formulation: The simple chromatogram of test Afatinib Shown in (Fig No. 8) the amounts of Afatinib per tablet were calculated by extrapolating the value of area from the calibration curve. Analysis procedure was repeated five times with tablet formulation. Tablet Assay for % Label claim for %RSD Calculated, Result was shown in (Table No. 19)

Fig No. 8: Chromatogram for Marketed Formulation
Table 19: Chromatogram of Marketed Formulation:
|
No. |
RT [min] |
Area[mV*s] |
TP |
TF |
Resolution |
|
1 |
3.839 |
260.9451 |
6066 |
0.85 |
- |
Table 20: Analysis of marketed formulation:
|
Assay |
Drug |
Lable Claimed |
Amt. Found |
% Lable Claim |
SD |
%RSD |
|
RP-HPLC Method
|
AFT |
30 |
29.84 |
99.48 |
0.11 |
0.94 |
|
AFT |
30 |
30.00 |
100.02 |
0.14 |
0.37 |
Analysis of marketed formulation were also %Lable Claim was found to be 99-101% Satisfactory are concluded (Table No.20).
Result of Specificity and Selectivity: The analytes should have no interference from the extraneous components and be well resolved from them. Specificity is the procedure to detect quantitatively the analyte in presence of component that may be expected to be present in the sample matrix, while selectivity is the procedure to detect qualitatively the analyte in presence of components that may be expected to be present in the sample matrix.
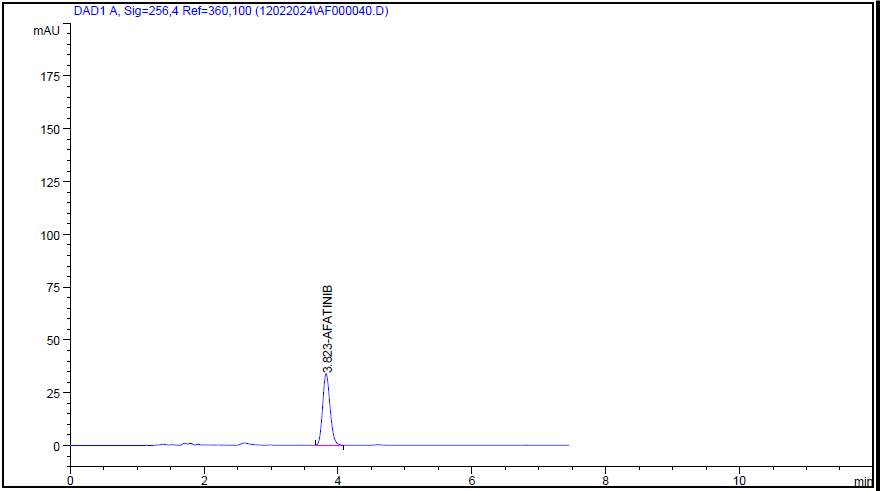
Fig. No 9: Chromatogram of Specificity and Selectivity.
Table . No 21: Details of Chromatogram of Specificity and Selectivity:
|
No. |
RT [min] |
Area[mV*s] |
TP |
TF |
Resolution |
|
1 |
3.823 |
262.63214 |
8956 |
0.86 |
- |
Result of Force Degradation: Forced degradation studies of both the drugs namely Afatinib were carried out individually and in combination under different stress conditions like acid hydrolysis, alkaline hydrolysis, hydrogen peroxide oxidation and photolysis. The results are shown in (Table 22).
Table 22: Degradation of different stress condition:
|
Sr. No. |
Degradation parameter |
?gradation of Afatinib |
|
1 |
Alkali DEG. 0. 1 N NAOH - AFTER 1hr 20mcg |
100.0 |
|
2 |
Acid DEG.0. 1 N HCL- AFTER 1hr |
8.51 |
|
3 |
3% H202 DEG AFTER 1hr |
6.56 |
|
4 |
Neutral After 2hr. |
0.89 |
|
5 |
Photolytic 24 hrs. |
0.34 |
Fig no.10: Degradation for 0.1N NAOH at 2hrs.
2. Acid hydrolysis: The acid hydrolysis performed using 0.1N HCl 2hrs for Afatinib. The major degradation products for Afatinib were observed at 2 hrs ?gradation 8.51 % for Afatinib. The degradation product was observed at RRT of 2 hrs. These impurities were also detected in Afatinib.
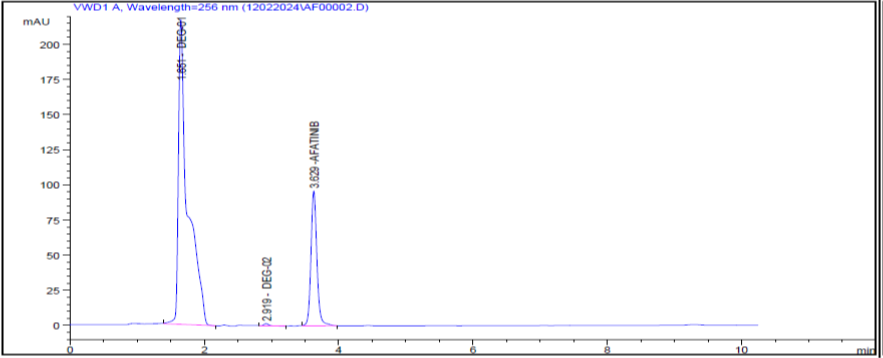
Fig no. 11: Degradation for 0.1N HCL at 2 hrs.
Oxidation: In the oxidation condition with 3% H2O2 for 2 hrs, Afatinib did not show any oxidative stress degradation peak in the chromatogram observed at 2 hrs ?gradation (2 hrs. 6.56 %for Afatinib).
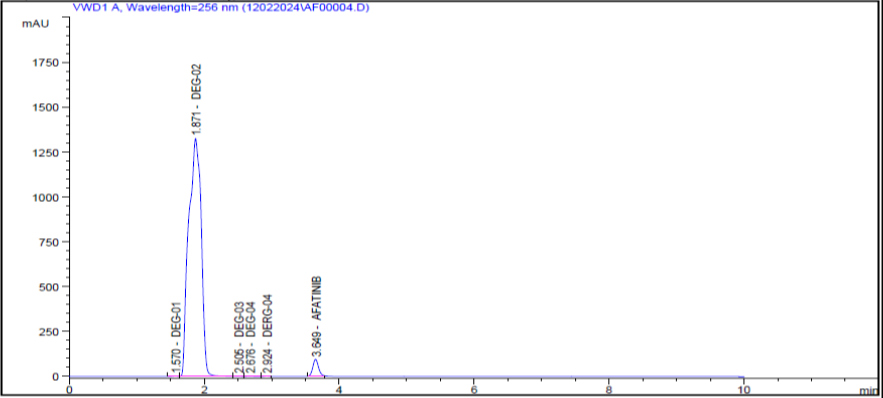
Fig no. 12: Degradation for 3% H2O2 at 2 hrs.
Neutral Studies: There was no major degradation observed for both Afatinib and Dutasteride and hence they were not sensitive to light.
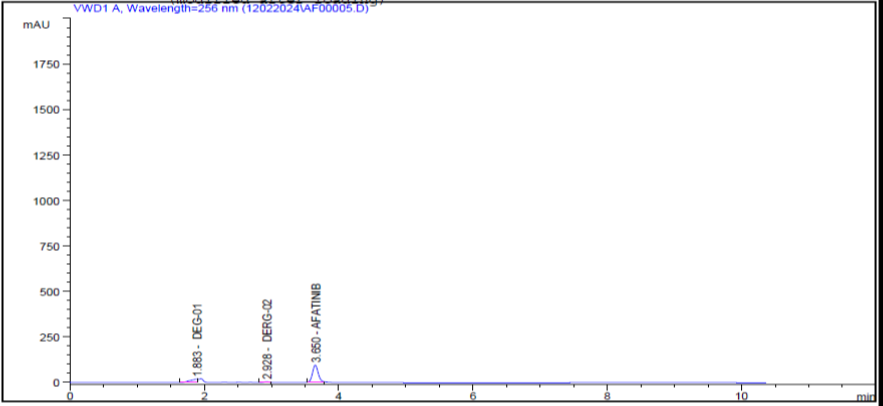
Fig no. 13: Degradation for neutral at 2hrs.
CONCLUSION:
A novel, efficient, and reliable RP-HPLC method has been successfully developed and validated for the routine quantification of Afatinib in both active pharmaceutical ingredients (API) and tablet dosage forms. This method demonstrates exceptional suitability for the simultaneous determination of Afatinib in single-component formulations, ensuring no interference from excipients or other factors. Its robustness and precision make it highly recommended for quality control and routine analysis in pharmaceutical industries. The findings indicate a strong correlation between the proposed method’s results and the labeled claims of the formulations. Furthermore, the low standard deviation and coefficient of variation affirm its reliability, making this method a promising analytical tool for future pharmaceutical advancements and stringent quality assurance practices in the development of Afatinib-based formulations.
Declaration Statement:
I hereby certify that the research work presented in this article is original and solely conducted by me. It has not been submitted to any other journal for publication consideration. All sources of information utilized in this study have been appropriately cited and acknowledged. I also assume full responsibility for the accuracy and integrity of the data and findings reported in this article.
Conflict of Interest:
The authors affirm that they have no conflicts of interest to disclose.
Funding:
No funding applicable.
ACKNOWLEDGMENT:
I would like to express my sincere appreciation to the Principal of DCS’s ARA College of pharmacy, Nagaon, Dhule for his priceless mentorship and unwavering assistance. Additionally, I would like to extend my gratitude to the Principal of DCS’ ARA College of pharmacy, Nagaon, Dhule, for their unwavering support and inspiration throughout this undertaking.
REFERENCES

Ankita Dhiware*, Dr. V. L. Badgujar, Dr. R. D. Wagh, Development and Validation of a Rapid RP-HPLC Method for the Analysis of Afatinib in Tablet Dosage Form Using AQBD Approach, Int. J. of Pharm. Sci., 2025, Vol 3, Issue 2, 739-752. https://doi.org/10.5281/zenodo.14849652
 10.5281/zenodo.14849652
