Abstract
Aim:
The objective of this work was to develop and validate a novel, high-performance thin-layer chromatography (HPTLC) technique for the identification and quantification of the biomarker rutin in the methanolic leaf extract of Morus alba L., Morus nigra L. and Morus indica L (family: Moraceae).
Method:
The compounds were separated using, Merck, silica gel 60 F254 precoated HPTLC plates as stationary phase and solvent system containing, Ethyl acetate: Ethyl methyl ketone: Formic acid: Water (10: 6 :1 :2) v/v/v/v was optimized as the best mobile phase. At a wavelength of 363 nm in absorbance mode, densitometric scanning was performed, anisaldehyde sulphuric acid was used for derivatization. The International Conference of Harmonization (ICH) specifications for precision, accuracy, and reproducibility were complied with to ensure the accuracy of the procedure and method validation.
Results:
The system was found to give compact spot for rutin at RF= 0.099 ± 0.037. The linear calibration curve gave a polynomial equation showing a coefficient of correlation equal to; 0.992 ± 4.91% (R ± SD). The LOD; limit of detection for rutin was 0.00087 ng and LOQ; limit of quantification was found to be 0.0026 ng. The Average concentration of rutin was found to be 268.6 ng/mL with Concentration standard deviation, CV= 0.45 % in the methanolic leaf extract of Morus alba L., 59.69 ng/mL with Concentration standard deviation, CV= 1.05% in the methanolic leaf extract of Morus nigra L. and 233.0 ng/mL with Concentration standard deviation, CV= 0.11 % in the methanolic leaf extract of Morus indica L Regarding continual quality assurance and formulation of standardized products containing Morus alba L., Morus nigra L. and Morus indica L. as well as the bioactive marker rutin, the present specified and validated HPTLC method can be implemented.
Conclusion:
This HPTLC approach is sensitive, determined, and accurate technique to quantify the concentration of rutin in Morus alba L. leaves.
Keywords
Morus alba L., Morus nigra L. and Morus indica L., HPTLC, Rutin, Quantification, Method Validation.
Introduction
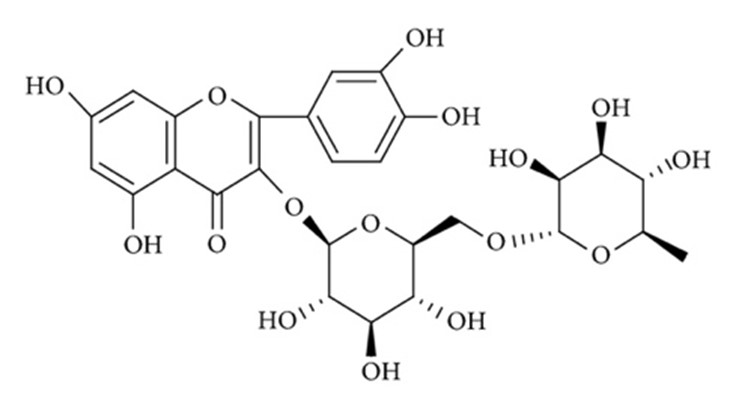
The growing popularity of natural compounds has led to a surge in demand for natural drugs. To ensure effectiveness, safety, and quality, phytochemical assessment is crucial. This includes marker compound analysis, chemo-profiling, and preliminary screening. High-performance thin-layer chromatography (HPTLC) is a key technique for studying herbal medications and formulations. Natural bioactive phytochemicals in plants can be used as markers to identify plant species and varieties, ensuring safety and efficacy. Mulberry, a plant with medicinal properties, has been used by humans for over 5,000 years. It is the only food source for silkworms and is used in traditional medicine, culinary components, and health restoration due to rich vitamin and mineral content. [2] [3]. Morus alba L. leaves are used in Chinese medicine for detoxification, liver and lung cleansing, vision enhancement, and treating conditions like inflammation, diabetes, hyperglycemia, atherosclerosis, and arthritis.[4] Morus indica L. leaves contain bioactive compounds like flavonoids, iridoids, and anthraquinones, [5] while Morus nigra L. leaves treat fever, digestive issues, and skin problems. [6]. Mulberry leaves, known for their hypoglycemic and anti-diabetic properties, are utilized in herbal tea to reduce cholesterol, blood sugar, and blood pressure levels. [7] Phenolic compounds, the most common secondary metabolites in plants, have gained significant research interest due to their unique bioactivities. The majority of these are flavonoids, which are classified into various sub-classes.[8]. Mulberry leaves contain flavonoids, which have significant antioxidant properties. [9] The study aims to develop a simple, cost-effective, accurate, consistent, and reliable HPTLC methodology for estimating Rutin in mulberry leaf extracts. As reported by Sánchez-Salcedo et al. and Polumackanycz M. et.al. Rutin is a biomarker found in Morus alba L. leaves, which can be used to confirm the medicinal identity of the mulberry plant. [10] [11] The research aims to create an authentic fingerprint for confirming the medicinal identity of the mulberry plant. Rutin, also known as quercetin-3-O-rhamnoglucoside, (Figure 1) is a naturally occurring, low-molecular-weight flavonol that is found in a variety of plants. [12] High levels of antioxidant, antimicrobial, and radical scavenging activities have all been linked to rutin. [13] HPTLC is a widely used technique for the analysis of rutin and other compounds in mulberry leaves. It offers a relatively simple, fast, and cost-effective method for assessing the presence and quantity of rutin, which is one of the key bioactive compounds in mulberry leaves.

Figure 1: Chemical structure of Rutin. [14]
Rutin
Synonyms:
rutoside, Quercetin 3-rutinoside, Vitamin P etc.
Chemical Formula:
C27H30O16
Molecular weight:
610.518
Chemical class:
Flavonoid
MATERIAL AND METHODS
Plant Material:
Fresh, robust leaves of Morus alba L., Morus nigra L. and Morus indica L Morus alba L., Morus nigra L., and Morus indica L., leaves were procured and verified by Central Sericulture Research and Training Institute, Galander, Pampore, Jammu and Kashmir, India. They were completely cleaned with deionized water to get rid of the sand and debris, allowed to air dry in the shade at room temperature, and then crushed into a fine powder using a mechanical grinder before being kept in airtight glass vials for subsequent investigation.
Preparation of plant extract:
The method of preparation of the plant extract was modified to be specific for extraction of rutin according to the Chinese Pharmacopeia in order to obtain accurate fingerprinting and to effectively extract the bio marker rutin. 5 gm each of Morus alba L., Morus nigra L. and Morus indica L leaf powder was dissolved in 60 ml of methanol and water (1:1) to which 1ml of HCl was added and the solution was heated under reflux for 2 hours and then filtered and extracted with ethyl acetate and used freshly prepared for HPTLC analysis.
Preparation of standard solution:
In a volumetric flask, 10 mg of rutin was dissolved in 10 mL of methanol to obtain rutin (1mg/mL) standard stock solution. It was then sonicated for 10 minute.
Instrumentation and Chromatographic set-up:
0.2 mm thick silica gel 60 F254 (Merck) pre-coated TLC aluminum plates (20 X 10 cm) were used for HPTLC. Standard solutions of Rutin (100-700 µg/ml) and Mulberry leaf extracts(10 ?l) applied using a CAMAG Linomat V sample applicator, Application position Y: 8.0 mm, length: 8.0 mm, Band distance: 11.4 mm and Solvent front position: 70 mm. Mobile phase: Ethyl acetate: Ethyl methyl ketone: Formic acid: Water (10: 6: 1: 2) v/v/v/v. The plate was placed in the CAMAG twin trough developing chamber for 20 min at room temperature for saturation. The plate was developed, solvent system evaporated, using a drier, and then scanned at 363 nm using a CAMAG TLC Scanner IV connected to win CATS software. After development, the plates were examined in a CAMAG TLC visualizer (R 254 and R 366 nm).

Table 1: Chromatographic conditions for HPTLC studies
Statistical Evaluation:
Each experiment was conducted three times and the findings reported as the mean ± standard deviation.
Method validation for quantification of Rutin by HPTLC analysis:
Method validation for determination of Rutin was performed according to the International Conference on Harmonization (ICH) Guideline. The guideline describes several validation characteristics that should be considered during method validation by HPTLC. These characteristics include specificity, linearity range, accuracy, precision, detection limit, quantitation limit, and robustness. This ensures the reliability and accuracy of the analysis.
Linearity range:
To establish the linearity range of standard rutin, a set of 7 bands of varying volumes between 1.0 to 7.0?L were placed on the HPTLC plate and a peak area vs. concentration per spot graph was generated.
Precision and Accuracy:
The precision of the developed method was estimated by analyzing the extracts at three different time intervals on the same day for inter-day and on three different days for intraday and the results were determined as % RSD.
Limits of detection (LOD) and quantitation (LOQ):
The signal-to-noise ratio of blank methanol was calculated in order to determine the limits of detection (LOD) and quantitation (LOQ). LOD was interpreted as 3:1 and LOQ as 10:1. Using different concentrations of the rutin standard solution along with the control (methanol) until the average responses were around three or ten times the standard deviation of the responses for six duplicate determinations, LOD and LOQ were calculated.
Specificity:
By matching the RF values and spectra of the plant sample with the standard rutin, the specificity of the methodology was determined.
Robustness:
By altering the mobile phase volume, mobile phase composition, and mobile phase saturation time, the robustness of the method can be assessed.
Recovery:
By conducting recovery experiments using standard additions at three different tracks in triplicates, the efficacy of the method was established.
RESULT AND DISCUSSION
Identification
Rutin was detected in all three samples by comparing the Rf value of the extracts with that of a standard rutin and noting a comparable migratory pattern, it was possible to confirm the presence of rutin in the extracts. The research yielded conclusive evidence of rutin's presence in the samples, confirming its constant prevalence in all three samples.
Method development
A specific, accurate and reliable HPTLC method has been developed for the detection and quantification of rutin in the methanolic leaf extract of Morus alba L., Morus nigra L. and Morus indica L. The developed methodology demonstrated strong peaks of standard rutin with the specified mobile phase when investigated at 363 nm wavelength, demonstrating effectiveness in the separation of components contained in the leaf extract. The optimization of the mobile phase leads to the production of sharp, well-defined peaks with a consistent RF value of 0.099 ± 0.037 which is crucial for the effective separation of phytoconstituents present in a specific sample. To find the most effective mobile phase, many mobile phases were investigated, among which Ethyl acetate: Ethyl methyl ketone: Formic acid: Water (10: 6: 1: 2) v/v/v/v was found to give the best separation of bands.
Method validation
Linearity
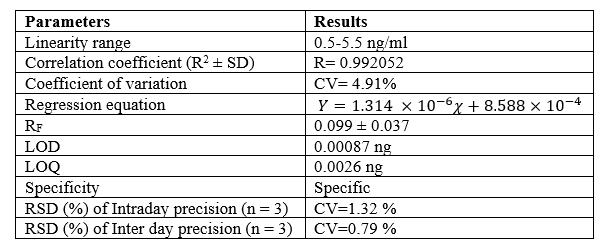
The concentration of rutin was plotted against the average peak area to create the calibration curve, and its linearity varied between 0.5 to 5.5 ng/ml. (Figure 2). Data from linear regression was used to validate the plot's excellent linear interaction. The correlation coefficient of Rutin was determined to be R=0.992052. The linear regression of standard curve of rutin was calculated as 0.992052 ± 4.91% and the calibration function as Y=1.314 ×10^(-6) ?+8.588×10^(-4)

Figure: 2 The calibration curve of rutin
Specificity
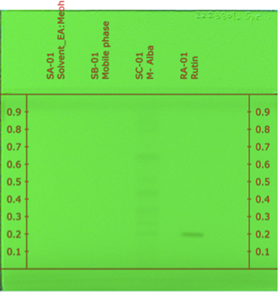
By matching the RF values of the standard rutin with those of the plant sample, the specificity of the method has been established. At a wavelength of 363 nm, the peaks of standard as well as plant extract were discovered to have the same RF value, this confirmed the presence of rutin in the sample, the method was discovered to be extremely specific because the densitograms only exhibited the bands for track having the leaf extract and the track with standard rutin solution, and no bands were formed in the tracks with the solvent EA: MeOH (1:1) and the mobile phase (Ethyl acetate: Ethyl methyl ketone: Formic acid: Water (10: 6: 1: 2) v/v/v/v). (Figure 3)

Figure: 3: Specificity chromatogram for Rutin (bands visible only for plant sample and rutin standard tracks)
Precision
To assess the method's accuracy, Intra-day and inter-day precision were evaluated and RSD% was determined to be less than 2%, demonstrating the new method's great precision and reproducibility. The mean of % RSD (n=3) in Intra-day and inter-day precision and accuracy observations for rutin were calculated to be 1.32% and 0.79% respectively (Table 2 and 3).

Table 2: Intra-day Precision for Rutin

Table 3: Inter-day Precision for Rutin
The limit of detection (LOD) and the limit of quantitation (LOQ) were calculated with a signal to noise ratio of 3:1 and 10:1 respectively. The LOD value for rutin was found to be 0.00087 ng whereas the LOQ value was estimated to be 0.0026 ng. This demonstrated the instrument's sensitivity for quantifying the phytochemical, rutin. (Table 4).

Table 4: Method validation of Rutin using HPTLC
Recovery
For the recovery study, Standard rutin solutions (1.2, 1.5 and 1.8 ?L) were used to spike the mulberry leaf extracts at three different levels (80%, 100% and 120%), the readings were observed in triplicates and the mean recovery percentage for the biomarker rutin was determined to be 95%. (Table 5).

HPTLC profile for recovery of Rutin in Morus alba L. Morus nigra L. and Morus indica L. leaf extract

Table 5: Mean Recovery percentage for Rutin
Robustness
To determine the robustness of the method the saturation time of the plate development was increased from 20 min to 30 min and there was no significant variation in the coefficient of correlation values which were determined to be R=0.992187 for 30 min saturation time and R= 0.992052 for 20 min saturation time, thus confirming the robustness of the analysis.
Quantification
The concentration of rutin was determined to be 268.6 ng/mL with Concentration standard deviation, CV= 0.45 % in the methanolic leaf extract of Morus alba L., 59.69 ng/mL with Concentration standard deviation, CV= 1.05% in the methanolic leaf extract of Morus nigra L. and 233.0 ng/mL with Concentration standard deviation, CV= 0.11 % in the methanolic leaf extract of Morus indica L. (Table 6). The maximum concentration of rutin was found to be present in Morus alba L. leaf extract.

Table 6: Quantification of Rutin

Figure: 4 HPTLC Chromatogram of Rutin (in different concentrations) and Morus alba L. Morus nigra L. and Morus indica L. leaf extract (10 ?L)

Figure 5: Densitogram of Rutin (in different concentrations) and Morus alba L. Morus nigra L. and Morus indica L. leaf extract (10 ?L)

Figure 6: Spectrum overlay of Rutin (in different concentrations) and Morus alba L. Morus nigra L. and Morus indica L. leaf extract (10 ?L)

Figure: 7 HPTLC Densitogram for the standard Rutin, Vol- 5.0ml.

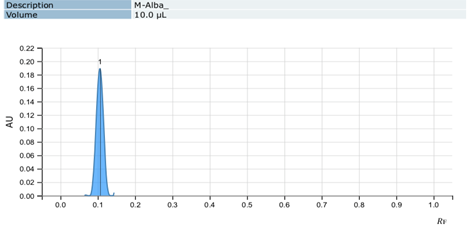
Figure: 8 Densitogram of leaf extract of Morus alba L., Vol- 10 ?L

Figure: 9 Densitogram of leaf extract of Morus nigra L., Vol- 20 ?L

Figure: 10 Densitogram of leaf extract of Morus indica L., Vol- 10 ?L
Present study is the first to report the simultaneous analysis and quantification of the biomarker flavonoid, Rutin in the methanolic leaf extracts of the three different species of Mulberry; Morus alba L., Morus nigra L., and Morus indica L. For the simultaneous quantitative determination of the flavonoid-Rutin in leaf extracts of Morus alba L., Morus nigra L., and Morus indica L. (family: Moraceae), densitometric assessment by HPTLC method was adopted. The best technique for evaluating the secondary metabolites found in plant products is densitometric HPTLC. [15] HPTLC method validated by the present study can therefore be used as an analytical tool for quality evaluation of plants and formulations containing Rutin as a biomarker. Due to the higher concentrations of flavonoids found in mulberry leaves, it is recommended to use these plants as an adjunct source of flavonoids and to benefit from their anti-oxidant, anti-tumor, anti-cancer and anti-inflammatory potential. [16] The recommended technique can be utilized for regular monitoring of quality control of different Morus species because it is a basic, swift, reliable, accurate, specific and robust method to quantify rutin in crude herbal drugs. [17] The resultant data obtained by HPTLC analysis for the presence of various bioactive phytochemicals in Mulberry species could be regarded as biomarkers. Future research on these bioactive substances could result in the production of model innovative drugs for the treatment of numerous ailments.
ACKNOWLEDGEMENT:
The authors are grateful to the Anchrom Lab, Mulund, Mumbai, for providing HPTLC analysis facility.
FUNDING:
The research article was prepared by the authors without any external funding.
CONFLICTS OF INTEREST:
The authors declare no conflicts of interest.
REFERENCE
- D.B.Shinde, M.J.Chavan & P. S.Wakte, "HPTLC in Herbal Drug Quantification," High-Performance Thin-Layer Chromatography (HPTLC), , pp. 117–139. doi:10.1007/978-3-642-14025-9_8 , 2010.
- S.Dhiman, V.Kumar, C.M.Mehta, Y.Gat, S.Kaur, "Bioactive compounds, health benefits and utilisation of Morus spp.– a comprehensive review," J. Hortic. Sci. Biotechnol, p. DOI 10.1080/14620316.2019.1644969, 2020.
- S.P.Eyduran, S.Ercisli, M.Akin, O.Beyhan, M.K.Gecer, E.Eyduran and Y.E.Erturk, "Organic acids, sugars, vitamin C, antioxidant capacity, and phenolic compounds in fruits of white (Morus alba L.) and black (Morus nigra L.) mulberry genotypes," J. Appl. Bot., p. Doi 10.5073/JABFQ.2015.088.019, 2015.
- EWC.Chan, PY.Lye, Wong.SK, "Phytochemistry, pharmacology, and clinical trials of Morus alba," Chin J Nat Med , vol. 14, no. 1, p. 17?30, 2016.
- Bisma Jani, Rabea Parveen, Sultan Zahiruddin, Mohammad Umar Khan, Sradhanjali Mohapatra and Sayeed Ahmad, "Nutritional constituents of mulberry and their potential applications in food and pharmaceuticals: A review," Saudi Journal of Biological Sciences, vol. 28, no. 7, pp. 3909-3921 https://doi.org/10.1016/j.sjbs.2021.03.056, 2021.
- D.L.Aulifa, S.N.Fitriansyah, S.A.Ardiansyah, D.P.Wibowo, Y.A.Julata and D.S.Christy, "Phytochemical Screening, Antibacterial Activity, and Mode of Action on Morus nigra.," Pharmacogn. J., vol. 10, p. 167–171 doi: 10.5530/pj.2018.1.28., 2018.
- S.Dhiman, V.Kumar, C.M.Mehta, Y.Gat, S.Kaur, "Bioactive compounds, health benefits and utilisation of Morus spp.– a comprehensive review," J. Hortic. Sci. Biotechnol, p. DOI 10.1080/14620316.2019.1644969, 2020.
- C.C.Xu, B.Wang, Y.Q.Pu, J.S.Tao and T.Zhang, "Advances in extraction and analysis of phenolic compounds from plant materials," Chin. J. Nat. Med, vol. 15, pp. 721–731 doi: 10.1016/S1875-5364(17)30103-6., 2017.
- S.M. Nabavi, D.Šamec, M.Tomczyk, L.Milella, D.Russo, S.Habtemariam, I.Suntar, L Rastrelli., M.Daglia and Xiao, "Flavonoid biosynthetic pathways in plants: Versatile targets for metabolic engineering," J. Biotechnol. Adv, p. doi: 10.1016/j.biotechadv.2018.11.005, 2020.
- E.M.Sánchez-Salcedo, P.Mena, C.García-Viguera, F.Hernández and J.J.Martínez, "(Poly) phenolic compounds and antioxidant activity of white (Morus alba) and black (Morus nigra) mulberry leaves: Their potential for new products rich in phytochemicals," J. Funct. Foods , vol. 18, pp. 1039-1046 doi: 10.1016/j.jff.2015.03.053., 2015.
- M.Polumackanycz, T.Sledzinski, E.Goyke, M.Wesolowski, A.Viapiana. "A Comparative Study on the Phenolic Composition and Biological Activities of Morus alba L. Commercial Samples.," Molecules, p. doi: 10.3390/molecules24173082., 2019.
- Gunathilake K.D.P.P., Ranaweera K.K.D.S., Rupasinghe H.P.V. "Analysis of rutin, ?-carotene, and lutein content and evaluation of antioxidant activities of six edible leaves on free radicals and reactive oxygen species," J. Food Biochem, p. doi: 10.1111/jfbc.12579., 2018
- Gunathilake K.D.P.P., Ranaweera K.K.D.S., Rupasinghe H.P.V. "Analysis of rutin, ?-carotene, and lutein content and evaluation of antioxidant activities of six edible leaves on free radicals and reactive oxygen species," J. Food Biochem, p. doi: 10.1111/jfbc.12579., 2018.
- Yang J., Guo J., Yuan J, "In vitro antioxidant properties of rutin," LWT Food Sci. Technol, p. 1060–1066 doi: 10.1016/j.lwt.2007.06.010., 2008.
- S. G. Tian, L. D. Xin, Halmuart Upur, "High-Performance Thin-Layer Chromatographic Quantification of Rosmarinic Acid and Rutin in Abnormal Savda Munziq," Journal of Chemistry, p. https://doi.org/10.1155/2013/89816, 2013.
- K.D.P.P.Gunathilake, K.K.D.S.Ranaweera and H.P.V.Rupasinghe, "High-Performance Thin-Layer Chromatography for Rutin, Chlorogenic Acid, Caffeic Acid, Ursolic Acid, and Stigmasterol Analysis in Periploca aphylla Extracts," Separations, vol. 8, no. 4, p. https://doi.org/10.3390/separations8040044, 2021.
- Dipanwita S. Ghoshal, Sopan N. Kharat , Sangeeta A. Godbole, "HPTLC Quantification and Estimation of Rutin and Kaempferol using aerial parts of Ixora javanica (blume) dc. and Ixora barbata roxb. ex. sm.," Research J. Pharm. and Tech, vol. 15, no. 10, pp. 4533-4541. DOI: 10.52711/0974-360X.2022.00761, 2022.
- H.Yadav, M.Kumar, M.Nivsarkar and S.Anandjiwala,., "Multiple marker-based evaluation of Kalanchoe pinnata,Bombax ceiba, and Morus alba leaves: Quantification of ?-amyrin, lupeol, and ?-sitosterol using high-performance thin-layer chromatography.," Journal of Planar Chromatography – Modern TLC, vol. 27, no. 6, p. 438–443. doi:10.1556/jpc.27.2014.6.6 , 2014.


 Nikki Huria* 1
 Aparna saraf 2
 Amit Saraf 2


 10.5281/zenodo.10954737